DT-HEAT+: Predicting Heat-Related Mortality Risk in Cities
A Digital Twin service for real-time decision-making and urban resilience

What is DT-HEAT+?
DT-HEAT+ is a web-based digital twin service that provides short-term predictions of heat-related mortality risk in urban areas. Developed by the SENSE-NOA team of the National Observatory of Athens (NOA) in collaboration with partners from the EU-funded CARMINE project, DT-HEAT+ combines real-time meteorological forecasts, environmental indicators, and AI-driven models to estimate today’s and tomorrow’s deaths attributable to extreme heat.
Its purpose is to support cities, policymakers, emergency responders, and planners with timely and science-based insights that can save lives and guide interventions during heatwaves. The vision is to enrich the content per city with valuable tools and features to make an one-stop place for heat-related resilience.
Why It Matters?
Heatwaves are a growing public health threat — called the “silent killer” by the World Health Organization. Yet mortality due to heat is often misunderstood or under-reported. DT-HEAT+ helps change that by making the impact of heat visible, measurable, and actionable, helping cities plan smarter and respond faster.
How Does It Work?
DT-HEAT+ integrates data from several key sources and applies sophisticated models to estimate daily mortality risk:
✅ Meteorological data (air temperature, humidity, wind, precipitation)
✅ Forecast models: IFS-NEMO (ECMWF/Extremes DT), GFS, Academy of Athens (for Athens)
✅ Historical mortality data for model training and validation
✅ ERA5 reanalysis for model training and percentile calculations
Two AI models are used in parallel to improve reliability, depending on available forecast inputs.
The system uses this data to:
Estimate heat-attributable mortality risk for today
Classify heat risk based on past climatology (95th / 99th percentiles)
Visualize trends and correlations to explain what drives the risk
Position today in the statistics of the last 5 years, for easy assessment of the situation
What Will You See in the Platform?
The platform is intuitive and visual, organized into three main tabs/pages:
Cities
Select the metropolitan area of interest of interest (currently: Athens, Prague, London and Bucharest with more to follow).

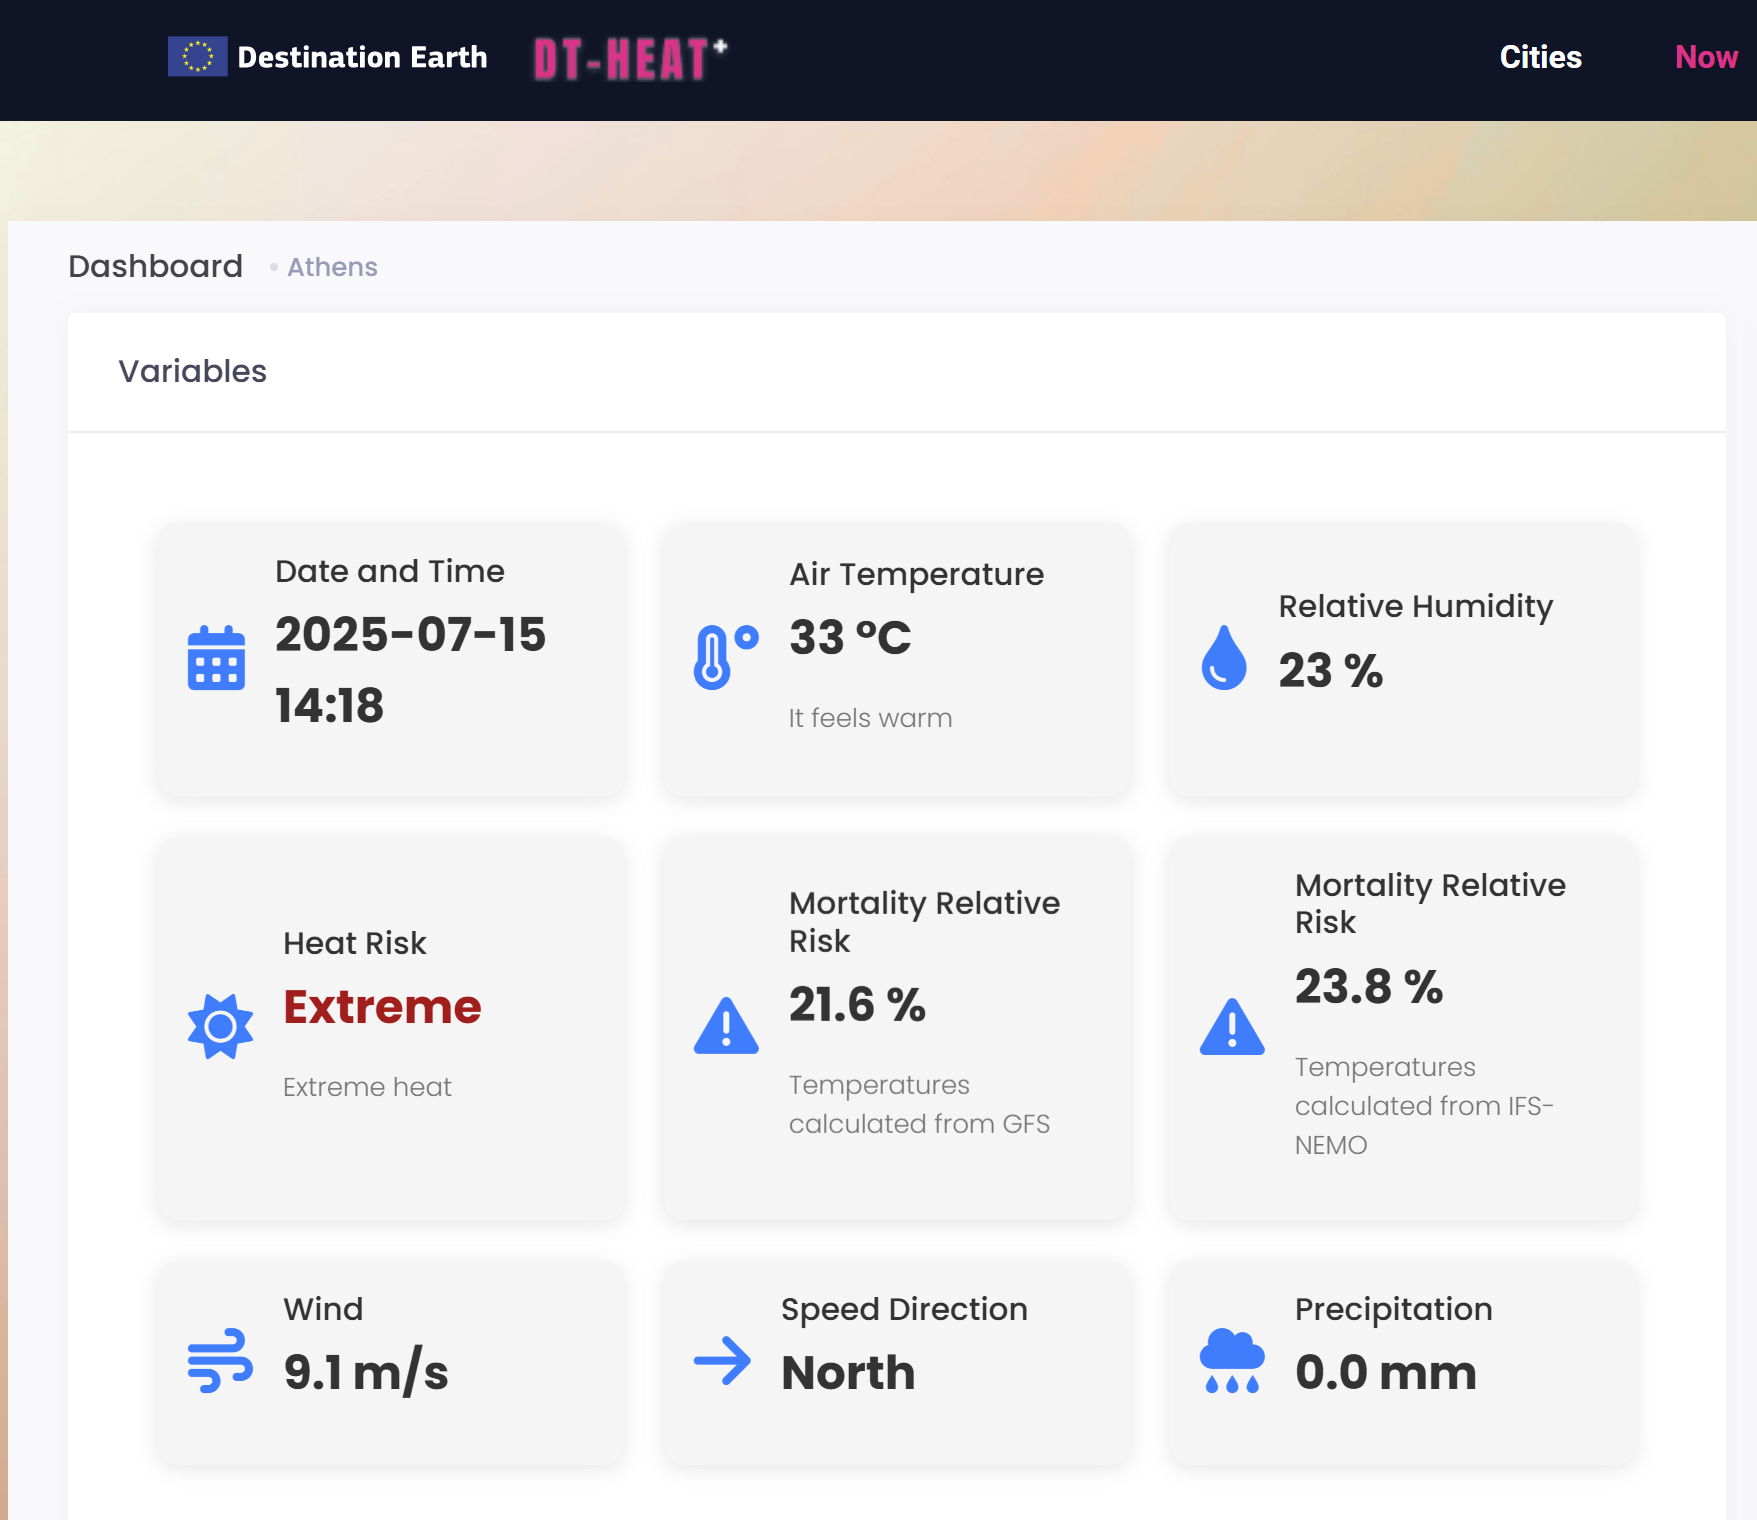
Now
See current meteorological conditions and predicted heat-related mortality. View trends through horizon charts, compare forecast sources, and explore risk level indicators.
How is today’s mortality due to heat estimated?
In DT-HEAT+, the calculation of heat-related mortality relative risk is based on an Exposure-Response Function (ERF) derived from historical epidemiological data. This function characterizes the relationship between daily temperature and mortality risk for each city. A distributed lag non-linear model (DLNM) is first applied to historical mortality and temperature data to estimate a city-specific ERF. The ERF captures the increased risk of death associated with daily mean temperatures above a locally defined minimum mortality temperature (MMT), which is typically near the 75th percentile of the historical temperature distribution.
The tool is powered by data streams from weather forecasts (e.g., IFS-NEMO, GFS) and localized simulations (from AoA), ensuring precise short-term assessments critical for saving lives during heatwaves.
Reference: Masselot, Pierre et al., Excess mortality attributed to heat and cold: a health impact assessment study in 854 cities in Europe, The Lancet Planetary Health, Volume 7, Issue 4, e271 - e281, 2023.
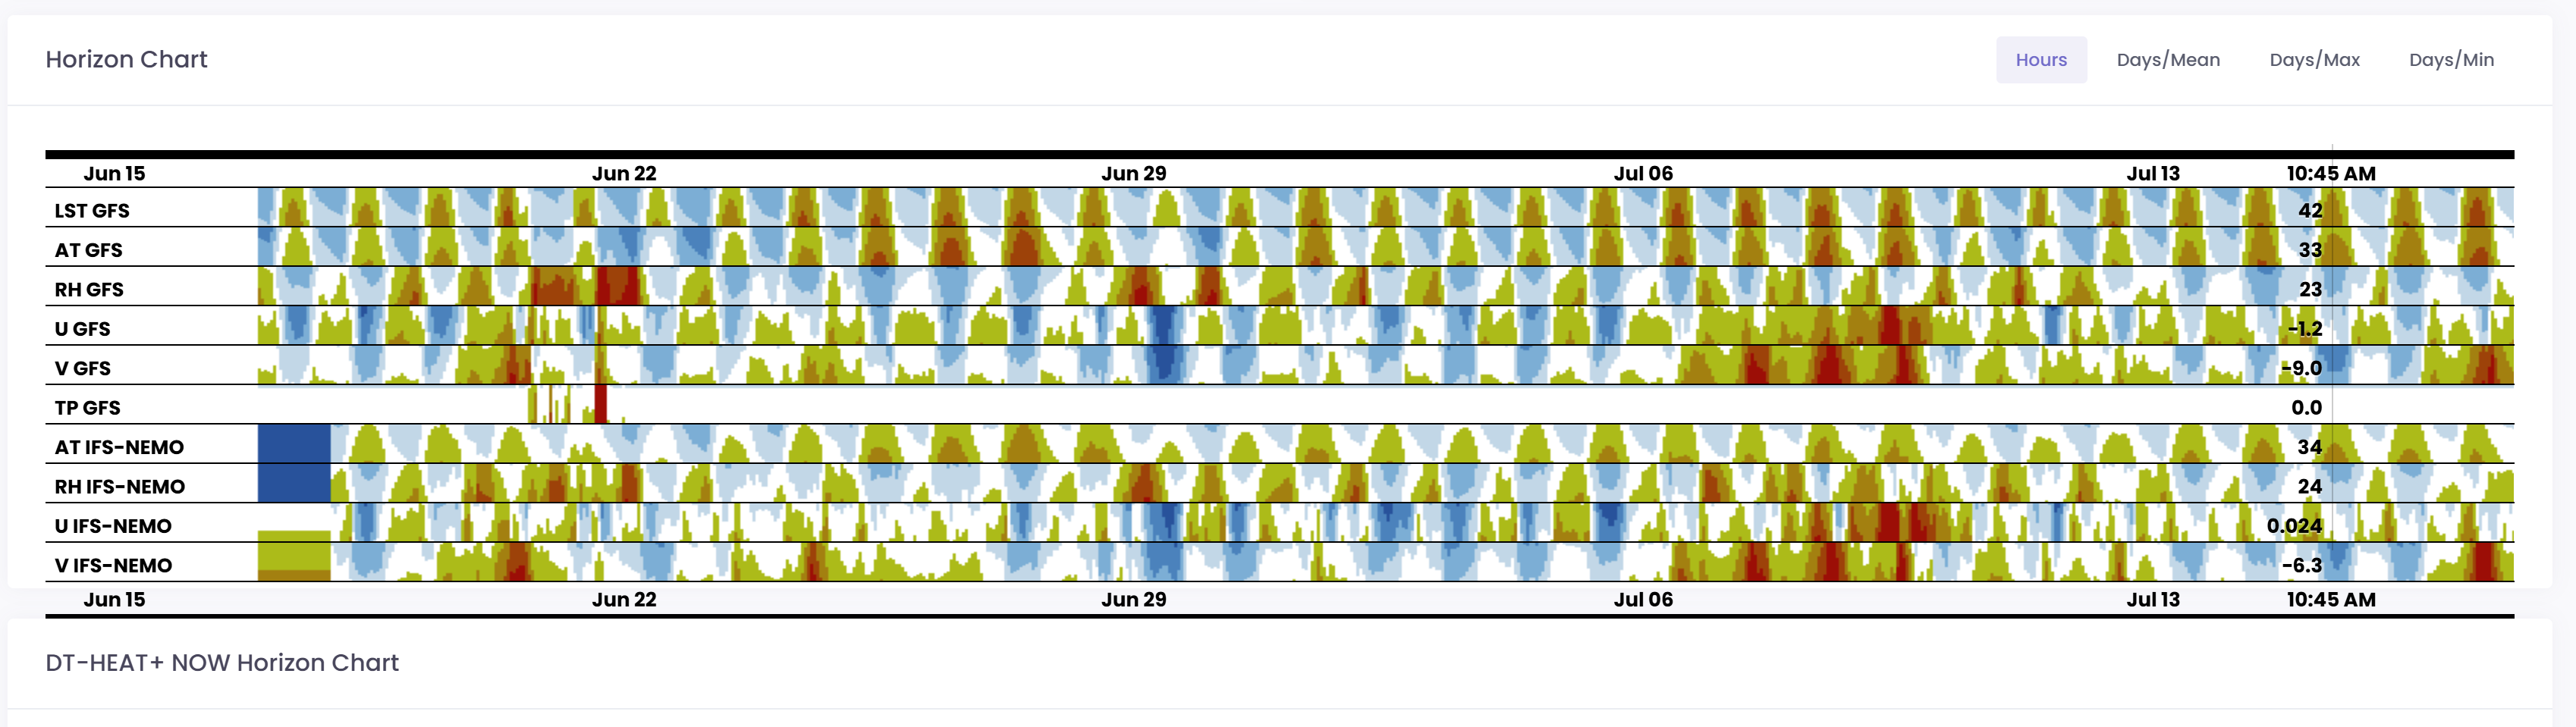
Horizon Chart
The horizon chart visualizes meteorological trends, including air temperature (AT), land surface temperature (LST), relative humidity (RH), and wind components (u, v). Users can track hourly and daily trends, including mean, max, and min values.
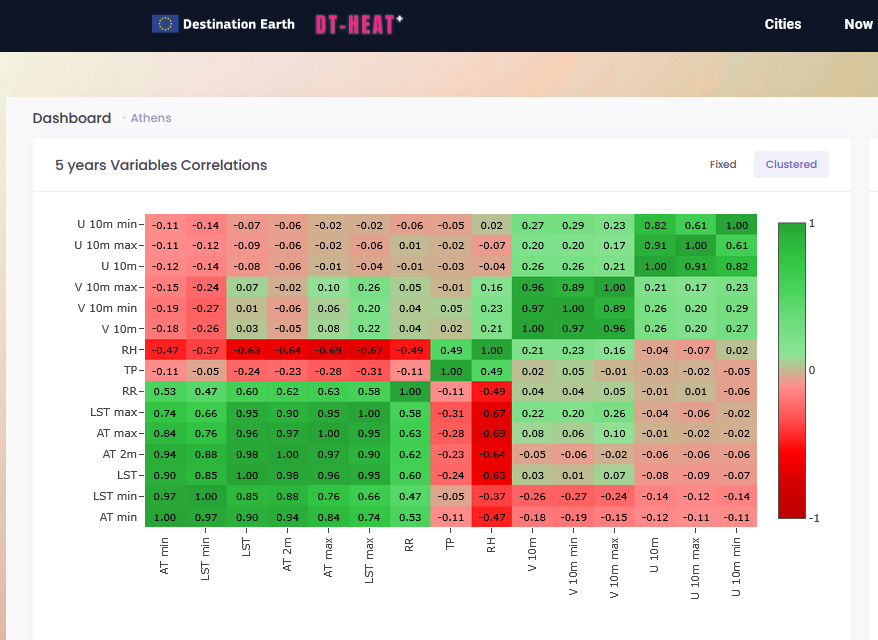
Last 5 Years
Explore a cumulative histogram showing how today’s temperature compares with historical norms. Review correlation heat maps showing how different environmental factors are linked to mortality.
💡 Interactive elements: Hover to explore values, switch between models, and choose mean/max/min views.
What’s next in DT-HEAT+?
More cities
Dynamic maps
“What-if” scenario modelling for Nature-based Solutions (NbS)
Long-term mortality projections using climate change scenarios
Future planning tools for urban retrofitting and resilience strategies
Note
DT-HEAT+ was awarded Most Promising Proposal at the 2nd DestinE Innovation Challenge and is being developed in close partnership with ESA, ECMWF, and EUMETSAT under a signed Letter of Intent.
How Can I Use DT-HEAT?
The service is onboard the DestinE platform and is accessible via a secure web interface. Registered users are able to:
Access mortality predictions (restricted access, based on users’ mandate) and risk indicators (for all users)
Explore meteorological data in visual, interactive formats
Use results to inform policy, planning, or emergency response
Future versions will open up scenario testing and strategic urban planning support.
Join the Community
DT-HEAT+ is part of the EU-funded CARMINE project, currently active in Athens, Prague, London, Bucharest. As the platform grows, new cities, more tools, enhanced features, dynamic maps, climate projections, Nature-based Solutions (NbS) and their impact will be added.
Whether you’re a city official, planner, public health expert, or researcher, DT-HEAT+ offers powerful tools to help you act on the challenges of extreme heat.
📩 For more information or to get involved, contact us: dt-heat@noa.gr