Welcome to DTE Hydrology documentation
Introduction
Welcome to DTE Hydrology, the cloud-based web application developed under ESA Digital Twin Earth Hydrology Next, which aims to prototype an advanced Digital Twin Component for Hydrology and Hydro-Risks across Europe and parts of Africa/Central America.
The web application leverages high-resolution satellite Earth Observation data, in-situ data, advanced hydrological and hydraulic modelling, and artificial intelligence to monitor water, energy, and carbon cycles as well as simulate hydro-hazards. In particular, it will support several case studies tackling critical areas such as flood/landslide prediction, drought monitoring, and water resources management.
Getting started
Before diving into the key features of the app, let’s get acquainted with the user interface through some preliminary information.
Map navigation gestures
Action |
On PCs |
On touch devices |
|---|---|---|
Zoom in/out 1 |
Scroll with your mouse wheel |
Pinch the screen |
Pan |
Hold the left button of your mouse and swipe it in any direction |
Swipe in any direction |
Tilt 2 |
Hold the mouse wheel and drag in any direction |
Double swipe in any direction |
1 Alternatively, you can use the + / - buttons in the lower-right corner of the page.
2 Please note that this action is available for 3D projection only.
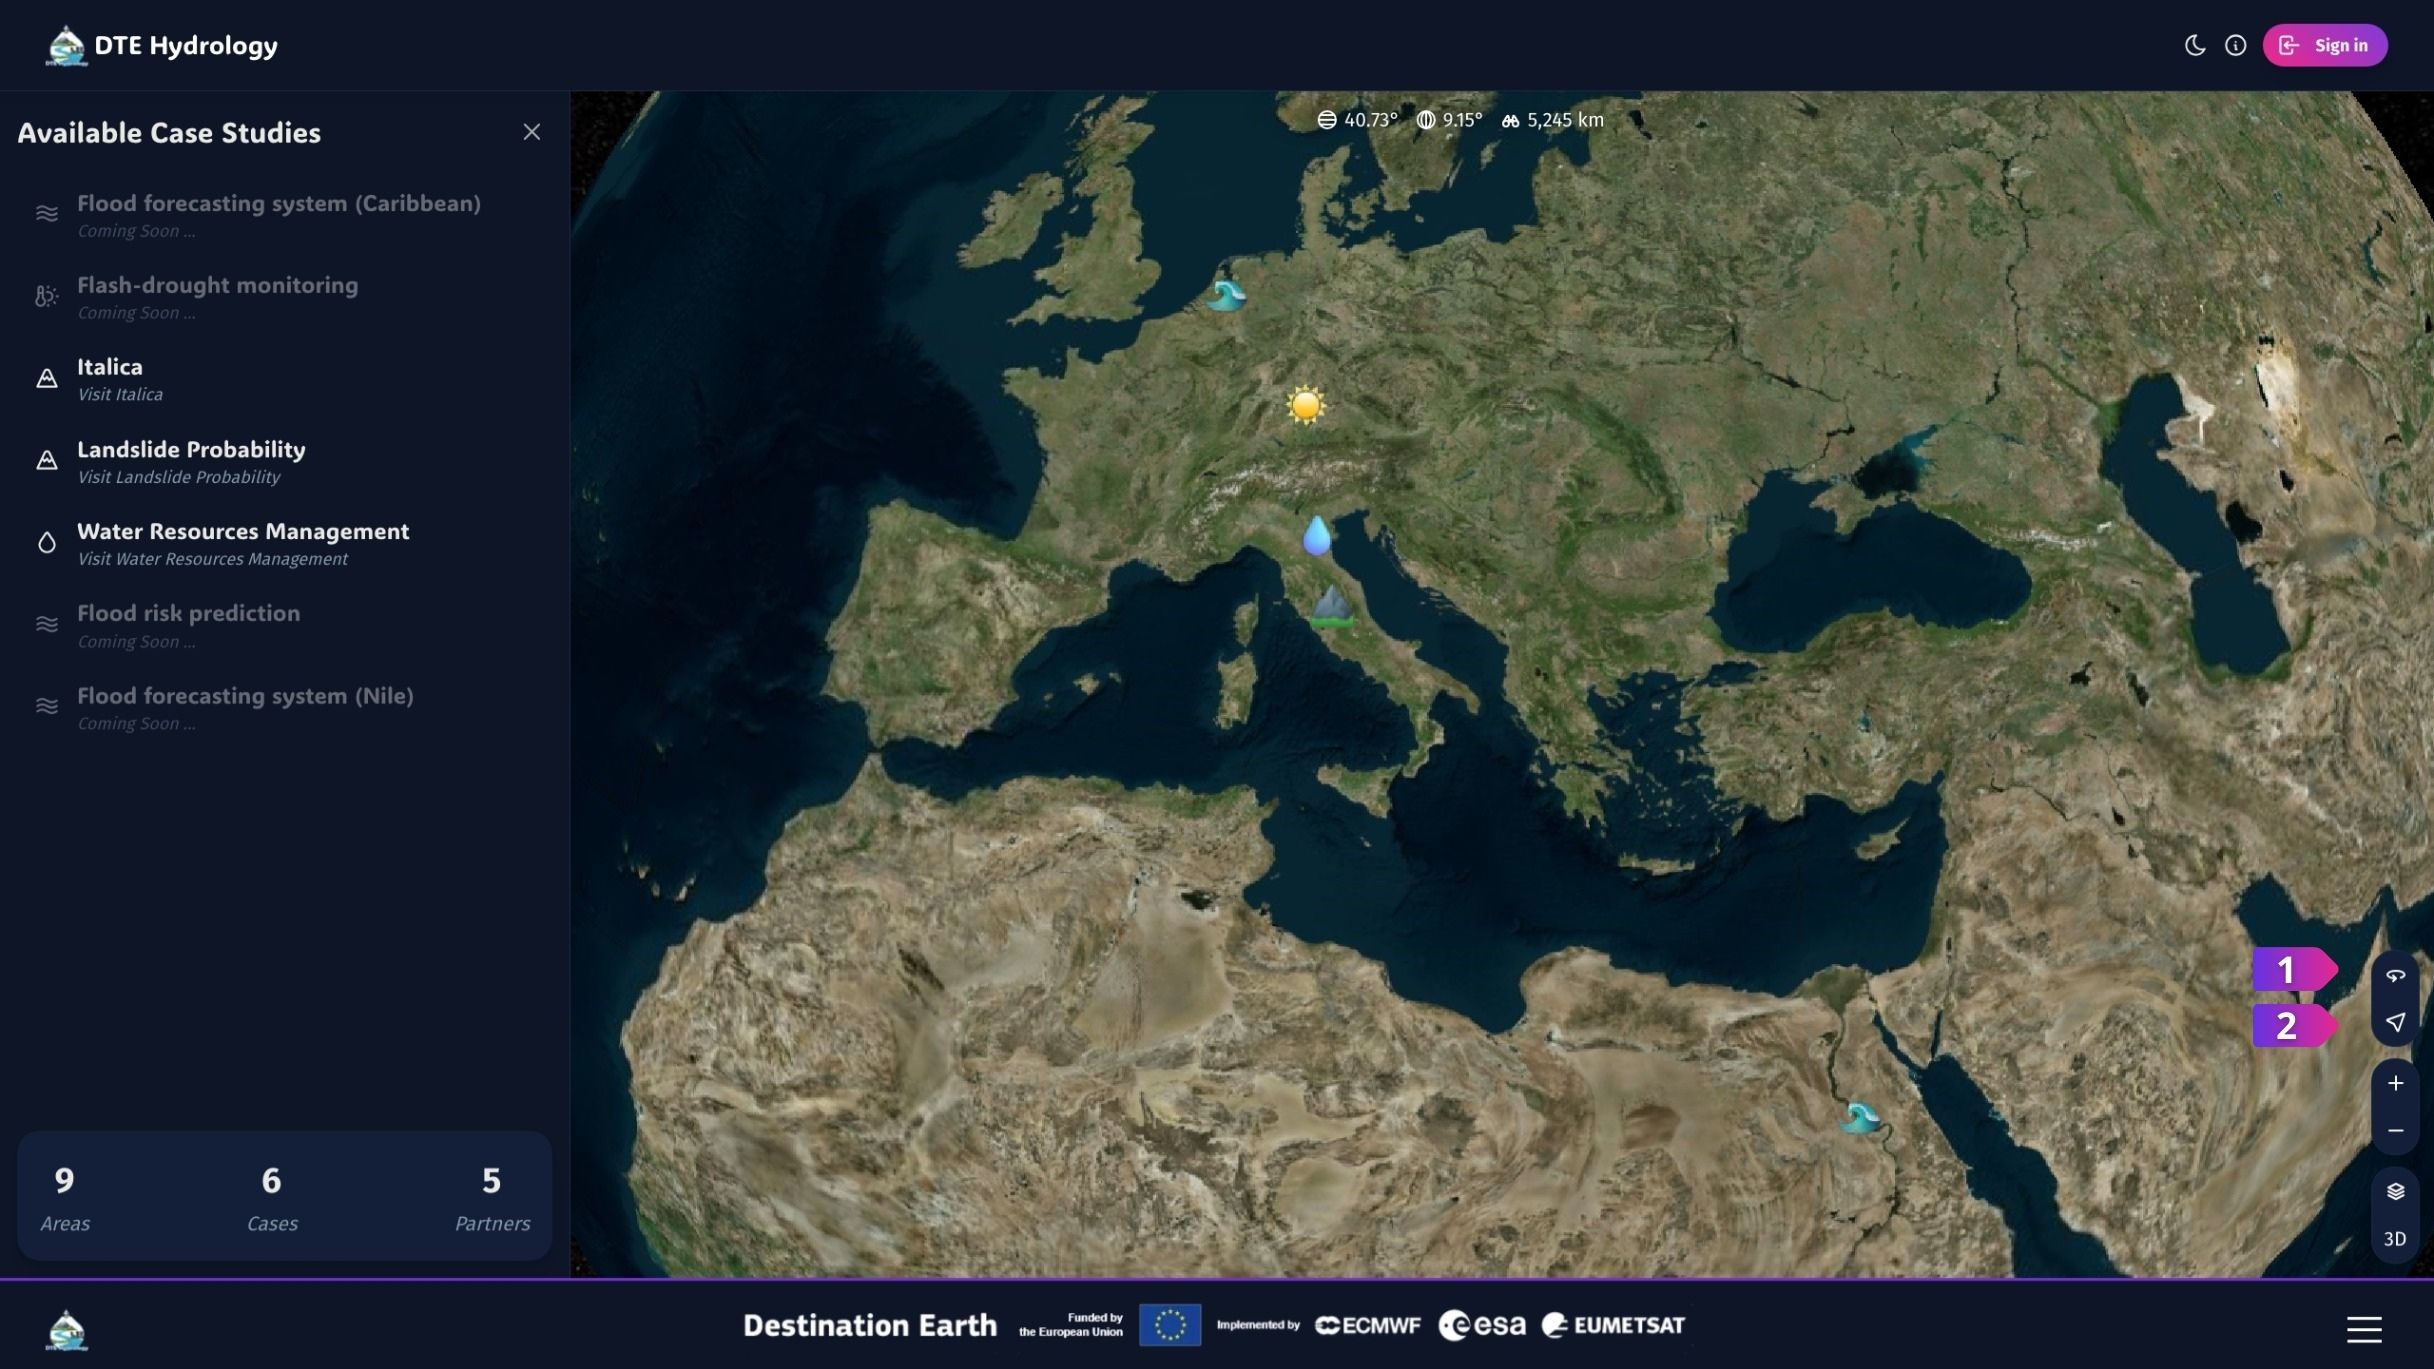
Additionally, icon ① resets the camera position on the map, while icon ② centres the map on your current location. To use this feature, you must grant your browser access to your location.
Tip
For the best user experience, we advise keeping your browser of choice up to date. This ensures compatibility with the latest features and optimisations implemented on the app.
Accessing the case studies
Upon landing on DTE Hydrology, you will find the case studies outlined in the sidebar and on the map. At present, three of them are available for selection:
You have two entry points to access them:
Click on the name of the case study of interest on the sidebar
Zoom the map and click on its icon
Regardless of entry point, the map view and control panels will be updated to reflect the selected study. Click on the DTE Hydrology logo to return to the landing page.
ITALICA
Based on the Italian Rainfall-Induced Landslides Catalogue, this case study represents a comprehensive historical record of 6312 rainfall-induced landslide events in Italy (January 1996-December 2021). It supports retrospective analyses and predictive-model calibration by visualising both spatial and temporal patterns.
The Italian map is overlaid with regions whose height and colour intensity correspond to the total number of landslides recorded in the selected period. Doughnut charts summarise the count of events by five levels of geographic accuracy (P0, P1, P10, P100, P300) and three levels of temporal accuracy (T1, T2, T3) over the full observation period.
Concerning geographic accuracy (P categories = ③), the following scheme has been adopted:
P0 (very high): exact coordinates reported or pinpointed via road-marker, street address, or visible landslide body.
P1 (<1km²): landslide located within ~0.6km radius (e.g., street known but not precise location).
P10 (1-10km²): landslide affects a road sector or city block (~1.8km radius).
P100 (10-100km²): district, borough, or hamlet level.
P300 (100-300km²): municipality level only.
As for temporal accuracy (T categories = ④):
T1: Exact event time (minutes to 1h) known via institutional/news reports.
T2: Time slot or inferred time based on day-period table or first-post timestamp.
T3: Only date known, assumed at 23:59 local time.
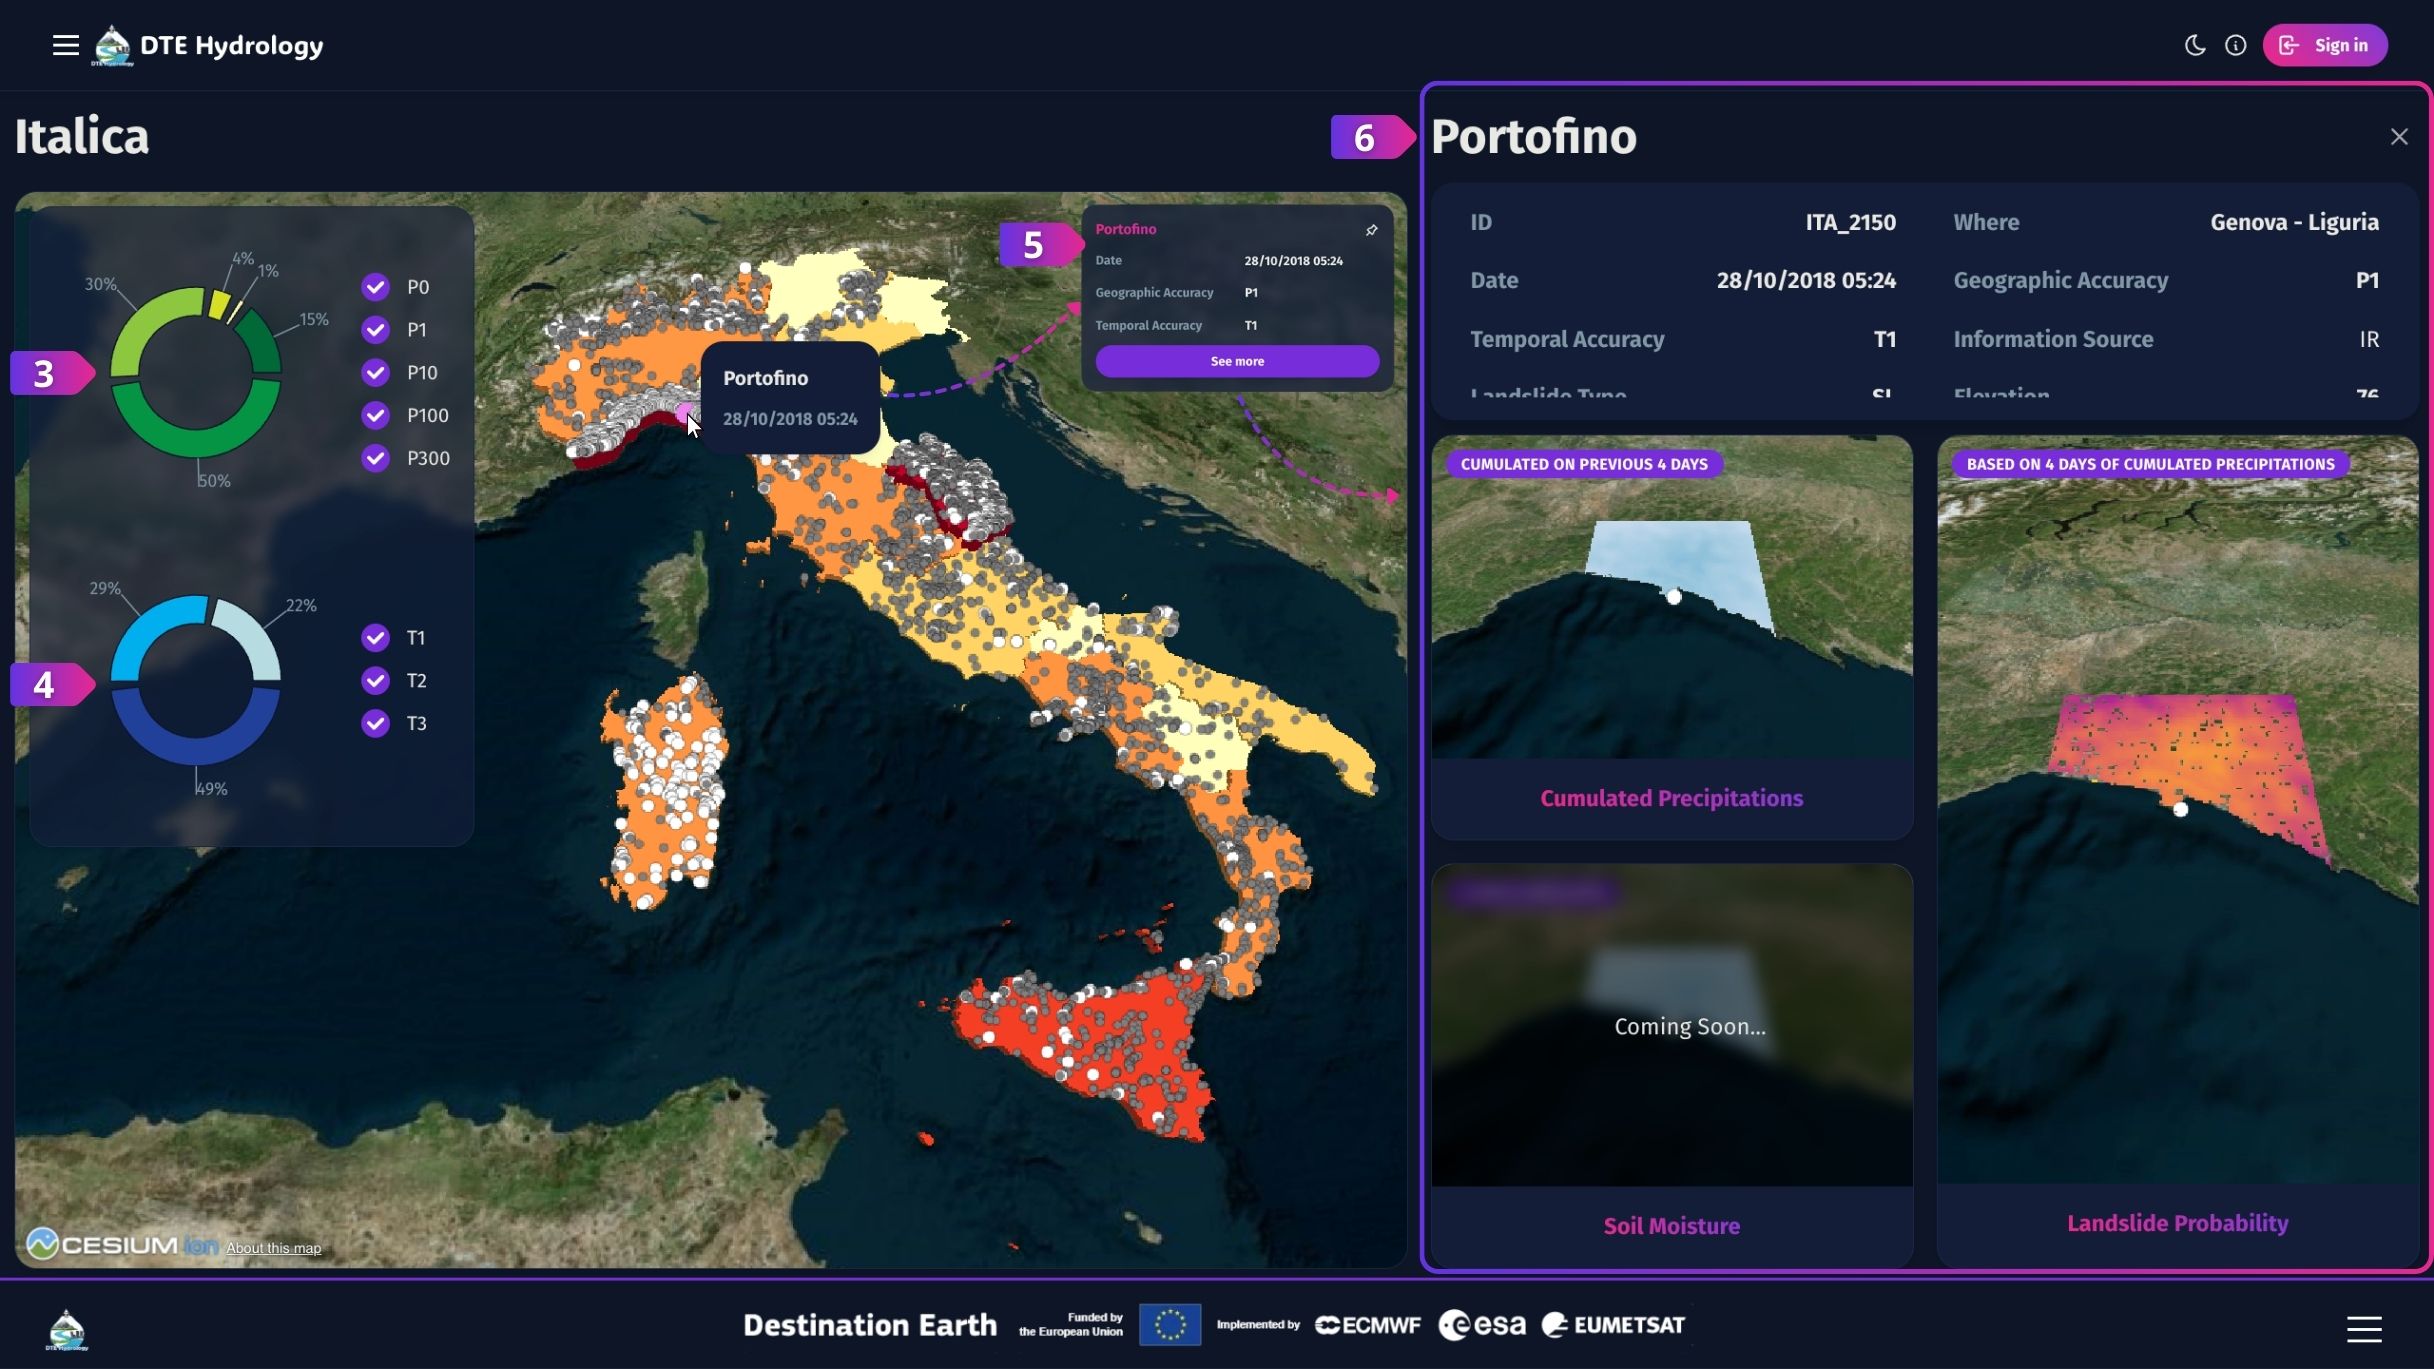
Tick the checkboxes of any categories to include or exclude specific geographic and temporal accuracy classes.
White dots on the map represent individual landslide events matching current filters. Hover to preview event metadata and click to open a detail panel on the right (⑤).
Within the detail panel, See More (⑥) displays additional maps and more event attributes, such as:
Date & Time: Day/Month/Year and Local Time of occurrence (recorded in local date and time).
Landslide Type: one of the following (if reported by the source):
Abbreviation |
Landslide Type |
|---|---|
DEF |
Debris Flow |
EF |
Earth Flow |
MF |
Mud Flow |
RF |
Rock Fall |
SL |
Generic Shallow Landslide |
Coordinates (WGS84, EPSG:4326): longitude and latitude of the location.
Elevation: average elevation of the slope unit containing the landslide point, in metres above sea level.
Landslide Probability
This case study showcases a demonstrative landslide-probability estimate for a single date, 9 November 2011, when Tropical Storm Rolf impacted Italy. The map displays the non-exceedance probability (NEP) computed over a predefined accumulation period using satellite-based precipitation and soil moisture inputs.
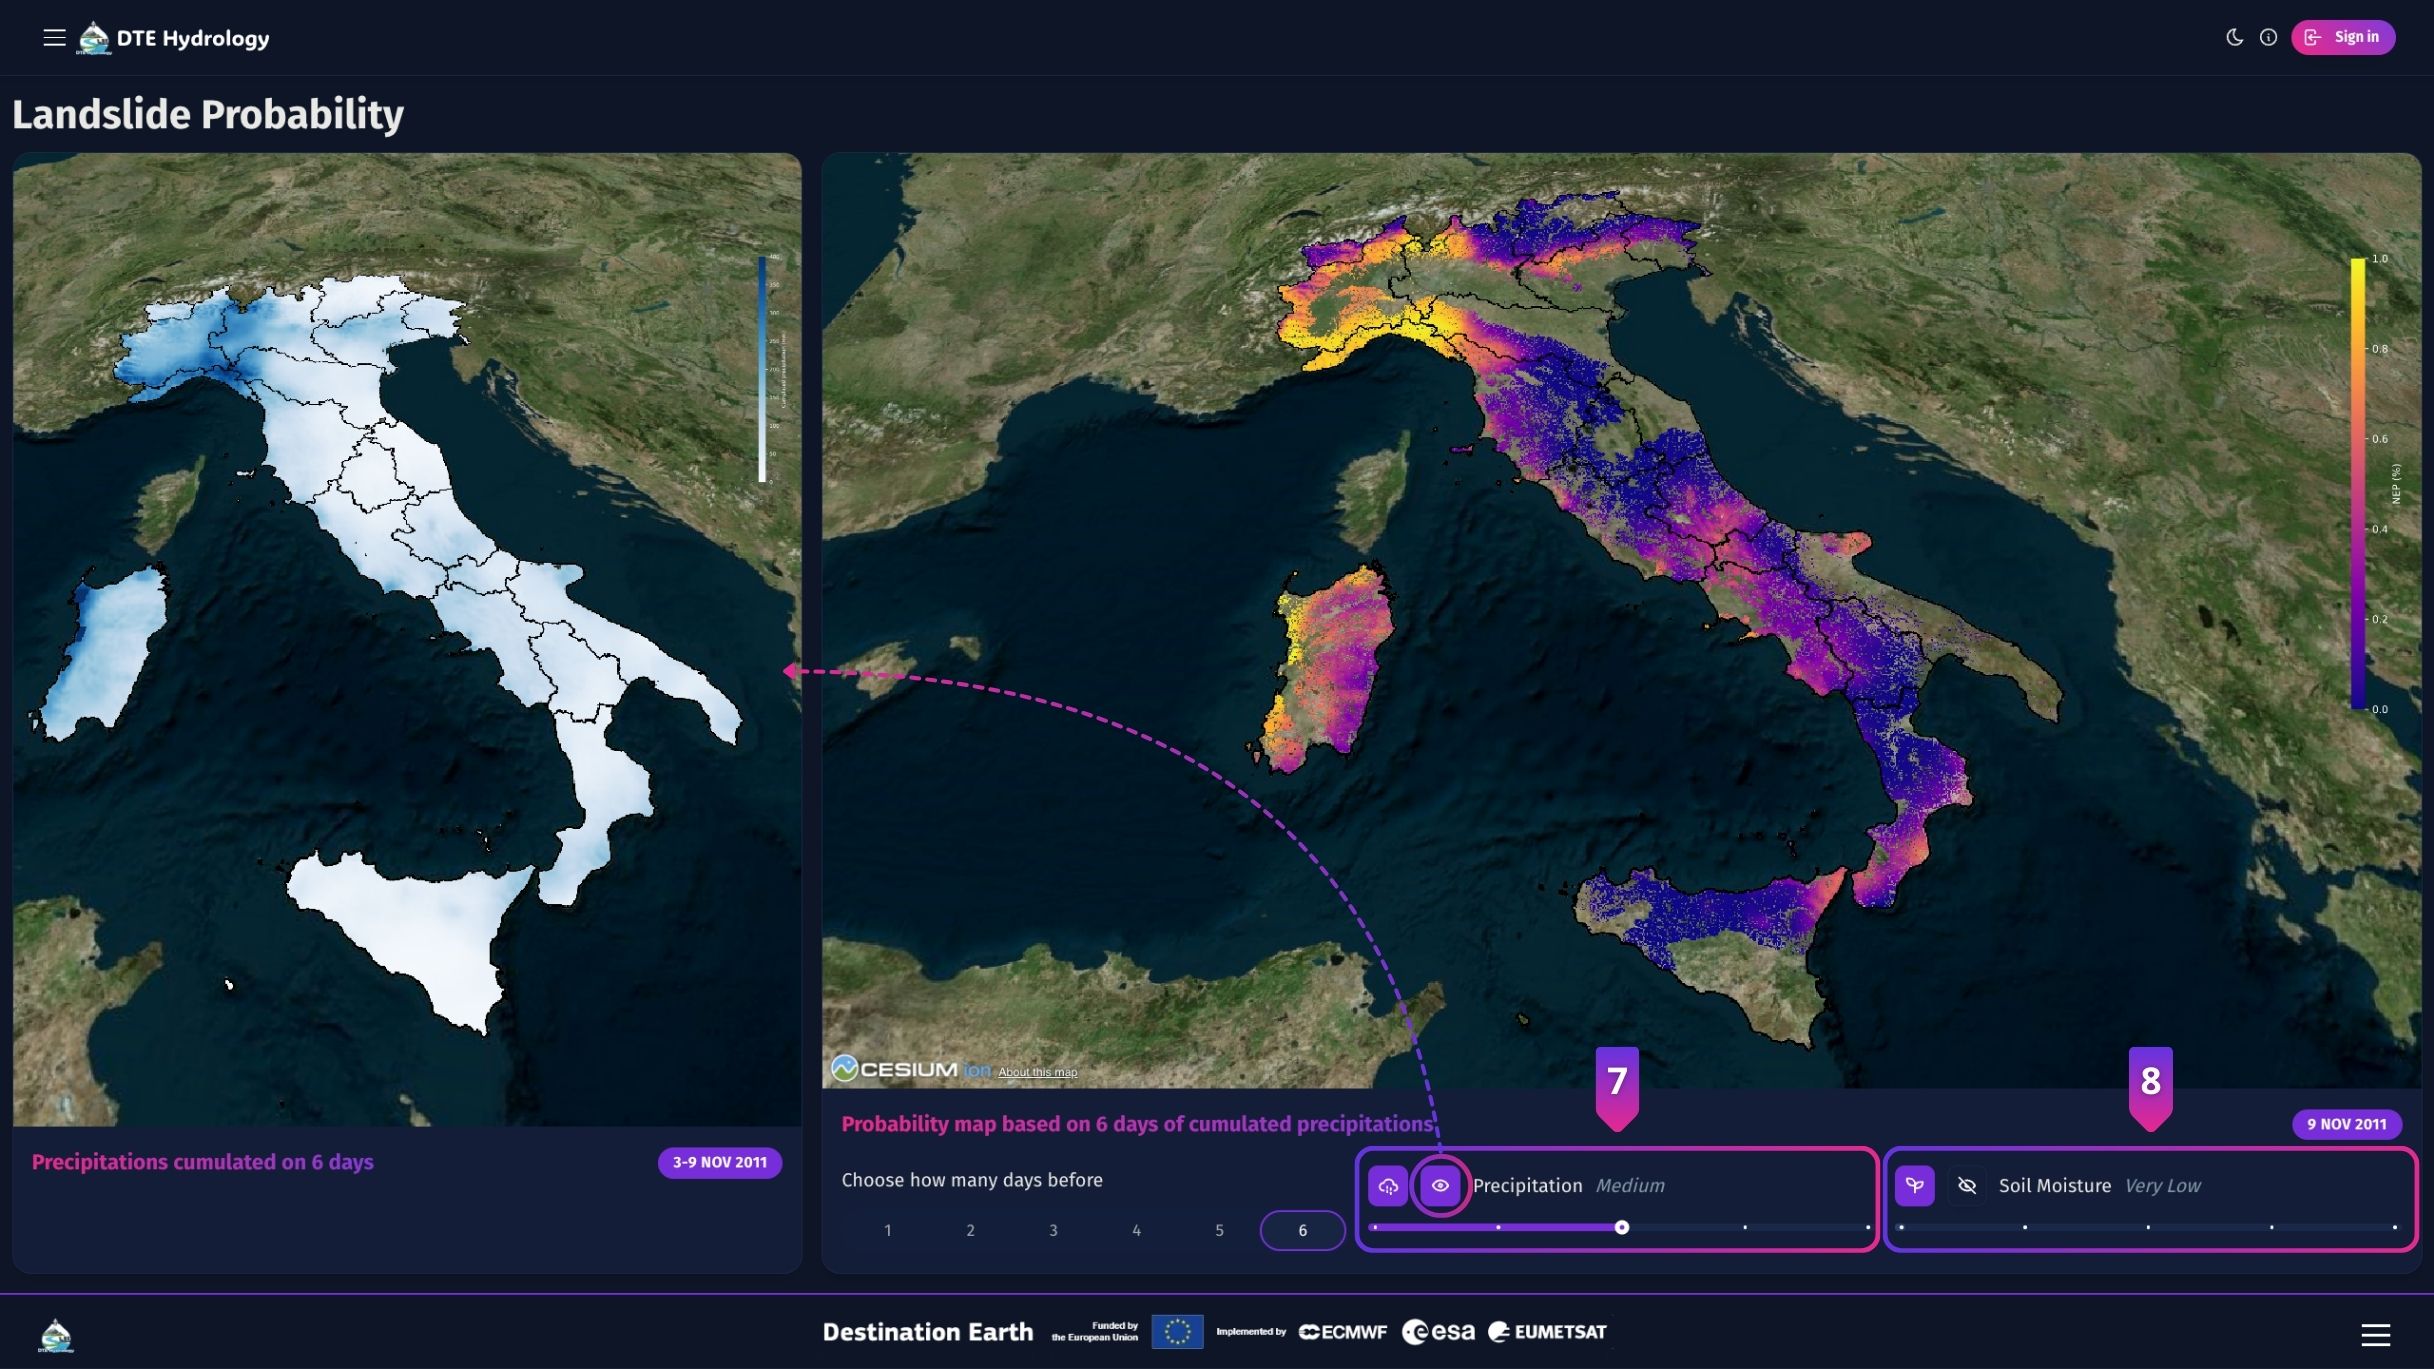
A non-susceptibility mask removes flat, non-hazardous zones, and you can tick input-variable maps - ⑦ and ⑧ - alongside the probability layer to inspect the hydrometeorological conditions that drove the model output on that specific date.
Water Resources Management
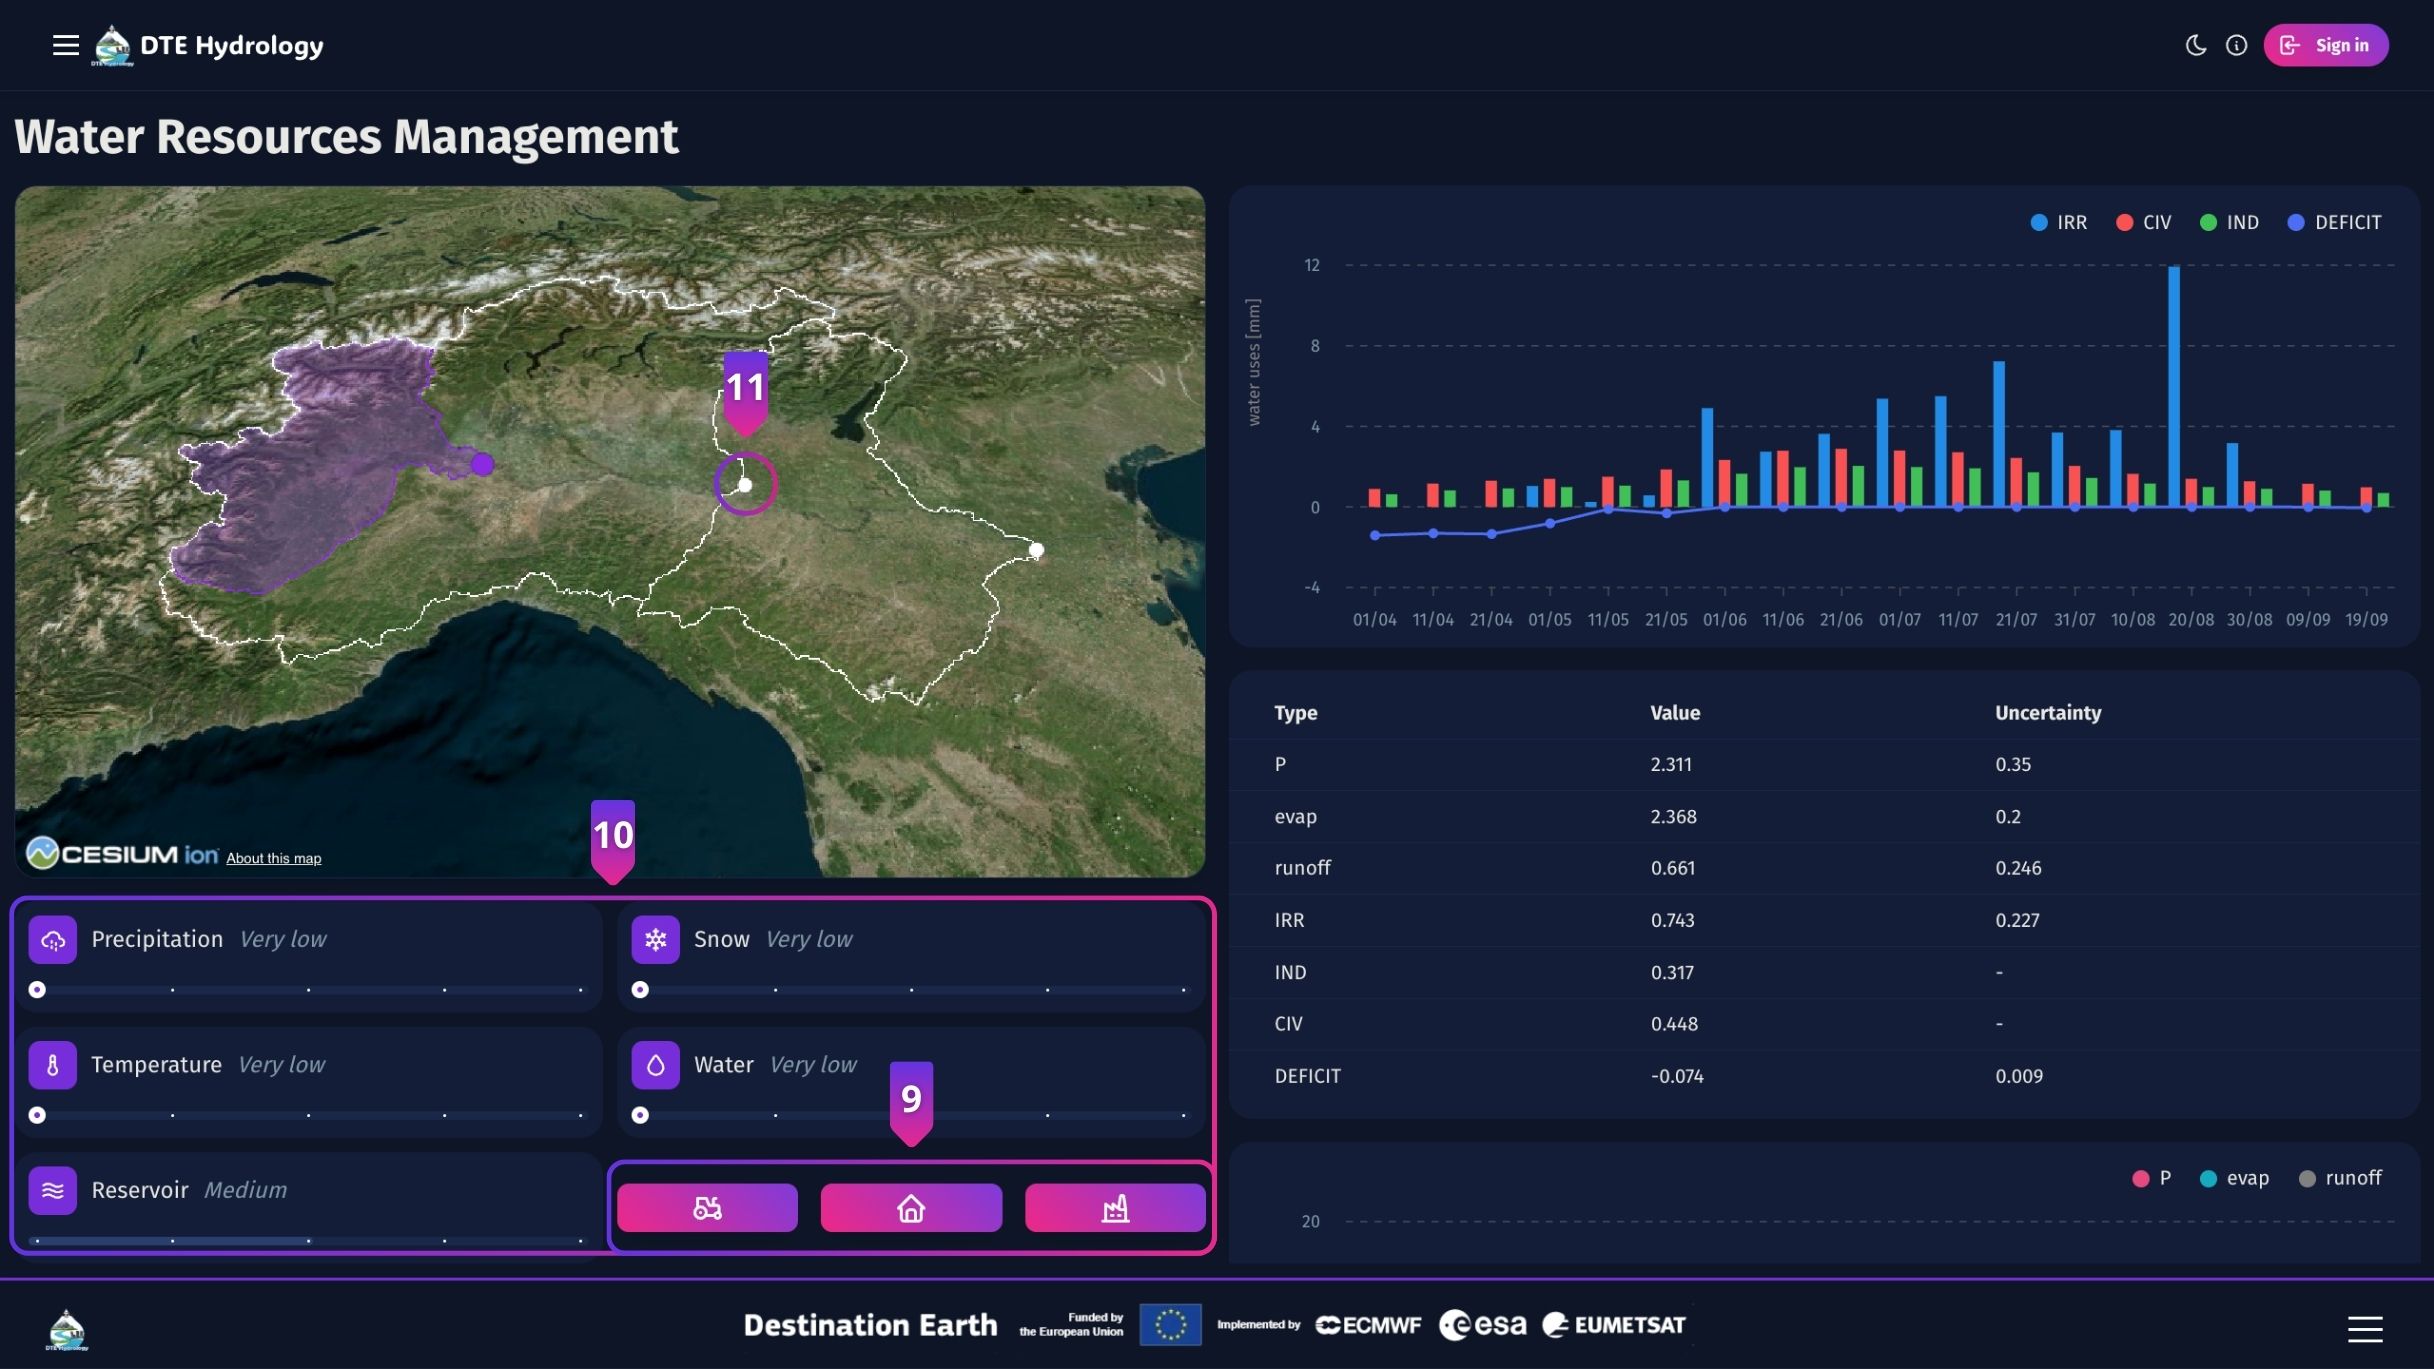
This case study simulates agricultural (IRR), civil (CIV), and industrial (IND) water demands (⑨) in the Po River basin from April to August under varying climatic and operational scenarios (⑩).
Water levels and releases are monitored at three key locations along the Po River: Casale Monferrato (AL), Cremona (CR), and Pontelagoscuro (FE). Click on the corresponding point markers on the map to include or exclude a control unit from the simulation (⑪). Additionally, click on each water-use icon to include or exclude that category from the simulation, assessing its individual impact on overall water-resource management.
Customisation
You can adapt the map interface to your preferences by interacting with various shortcuts located along the top and side of the screen.
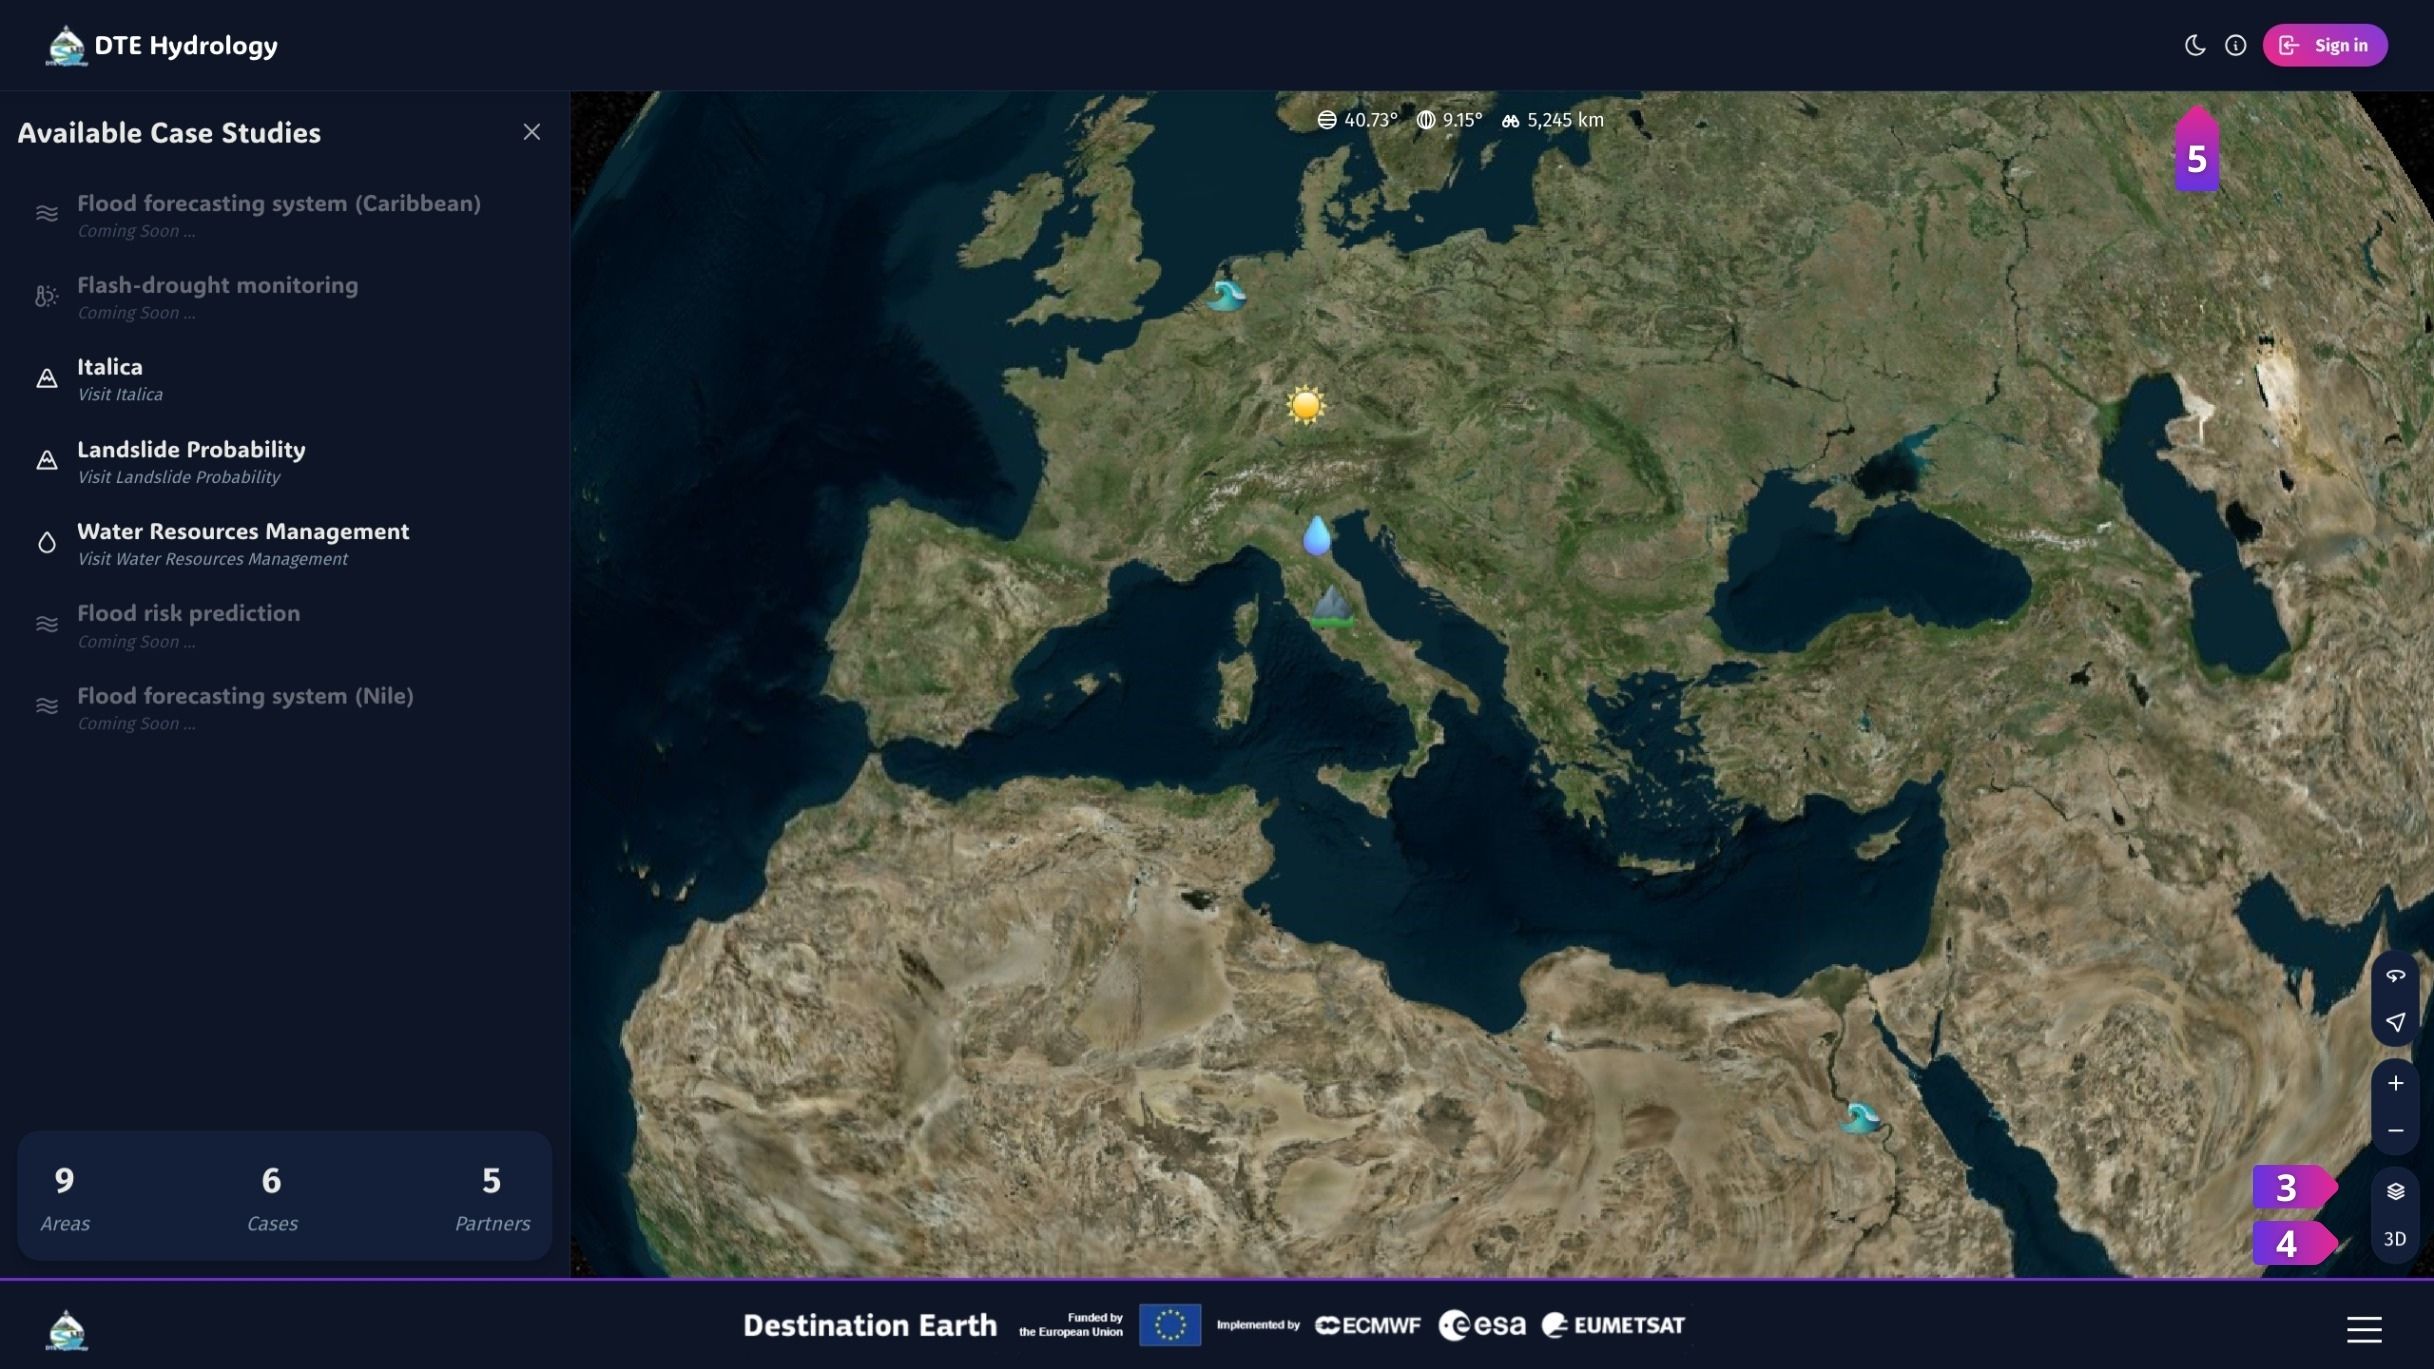
Click icon ⑫ to choose among various base layer options
Click icon ⑬ to switch between 2D and 3D map projection
The app provides the following themes:
The Light Mode uses light colours for background and text, which is ideal if you prefer a bright interface.
Opt for the Dark Mode if you prefer a darker background and lighter text, which can reduce eye strain in low-light environments.
The System Mode synchronises the app’s theme with the system settings of your device.
You can switch between them by clicking icon ⑭, which appears as the visual indicator of the current theme. Each click will immediately switch to the next available theme.
The app will cycle through the themes in this sequence: Light Mode, Dark Mode, and System Mode. Continue clicking until you reach your desired theme. Your settings will be maintained until you delete the browser cache.