General Flow Description
The EO4EU platform enables users to access, process, and analyse Earth observation data by integrating various data sources, automating workflows, and providing advanced visualisation tools. It supports data discovery, workflow creation, fusion algorithms, and machine learning applications to extract meaningful insights from geospatial data.
Steps to Use the EO4EU Platform:
Register and Log In
Create an account and log in to access your profile, manage applications, and configure settings (see Account).
Search for Data
Use the Data Search tool to find relevant datasets by selecting a data source, applying filters such as area of interest and date range, and retrieving the necessary data.
Create a Workflow
In the Workflow Creator, define a new workflow by selecting datasets and structuring the workflow. You can also upload in situ data if needed.
Edit the Workflow
Open the Workflow Editor to design and configure your workflow by dragging and dropping components, setting parameters, and applying processing techniques (see Fusion Functions).
Execute and Monitor Workflow
Save and publish the workflow to start processing. Track progress through the platform’s status indicators and notification system.
Visualize and Analyse Data
Explore processed results using Data Visualization for graphs, Map Visualization for geospatial overlays, and XR/VR Visualization for 3D analysis.
Manage Files and Track History
Access workflow outputs in the File Explorer, execute advanced commands in the Console, and review past workflows in the History section for tracking and iteration.
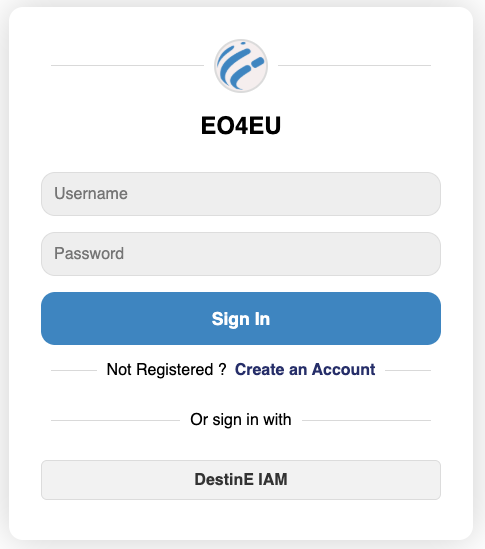
Authentication
To access the EO4EU platform, the user must be registered either as a local service user or through the DestinE federated IAM. Access to the Web Portal requires authentication via the sign-in screen.
Dashboard
The dashboard provides an overview of your data and workflows.
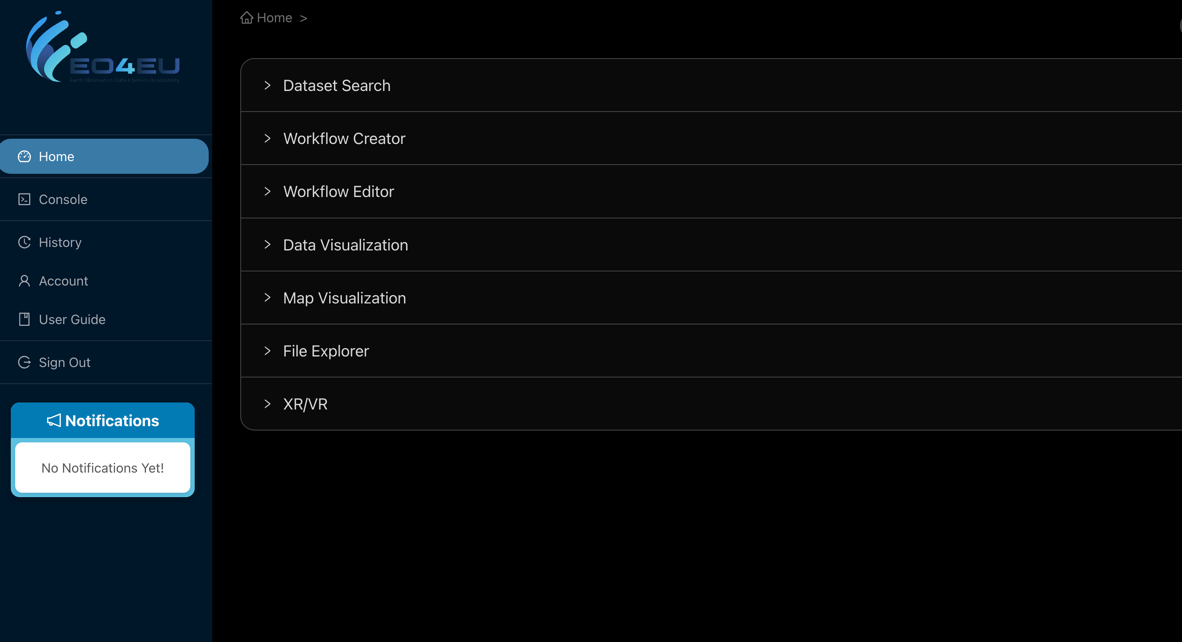
Data Search
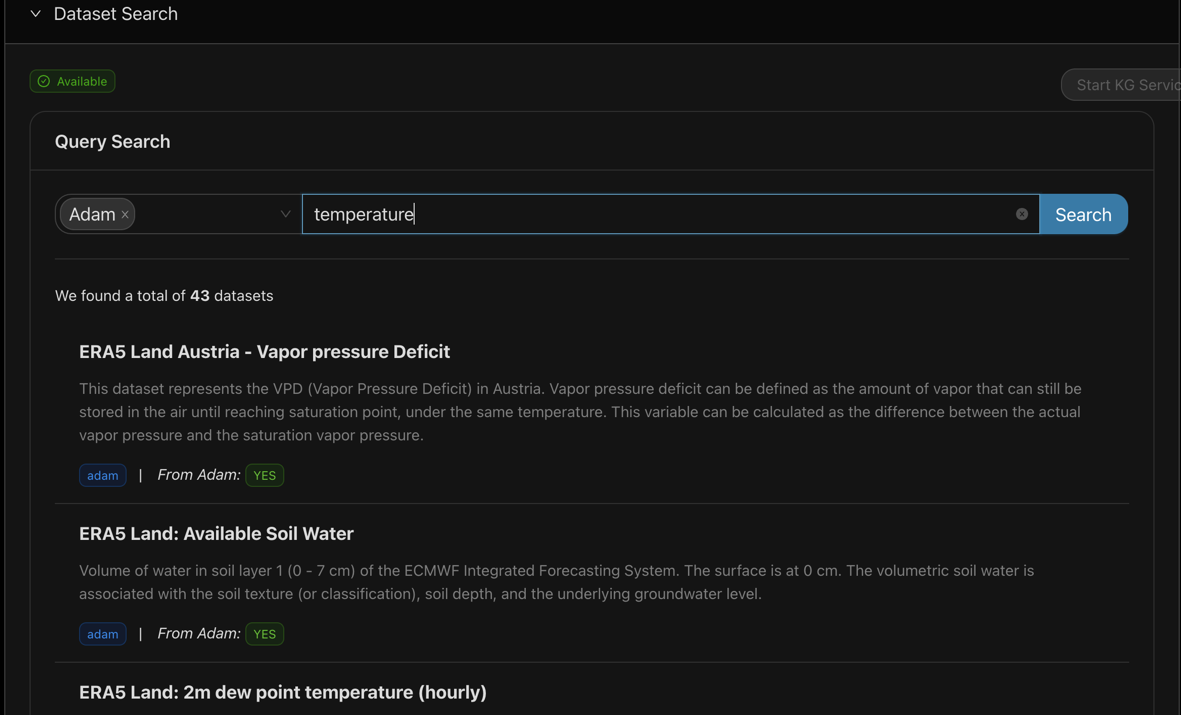
The first step in using the EO4EU platform is to search for the data needed. One of the platform’s main contributions is that it allows semantic data search through various data sources, including the option to upload datasets. Once the user logs in to the portal, the first accordion section is entitled “Dataset Search”, which is the tool used to search through data sources semantically.
From the drop-down menu, the user can choose the data source and provide a keyword.
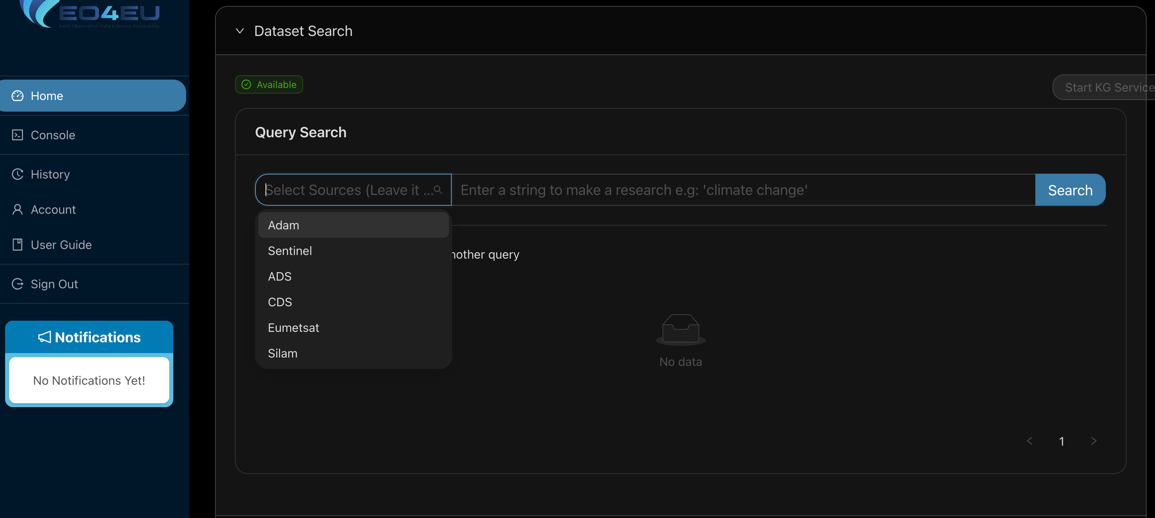
Once the data source and keyword are defined, the user can search using the search button on the top right and the most matching results will be shown.
Once the user chooses the dataset of interest, a specialised menu provides more details/options. The example for the ADAM data source includes a description of the dataset, its variables, file formats, and data types.
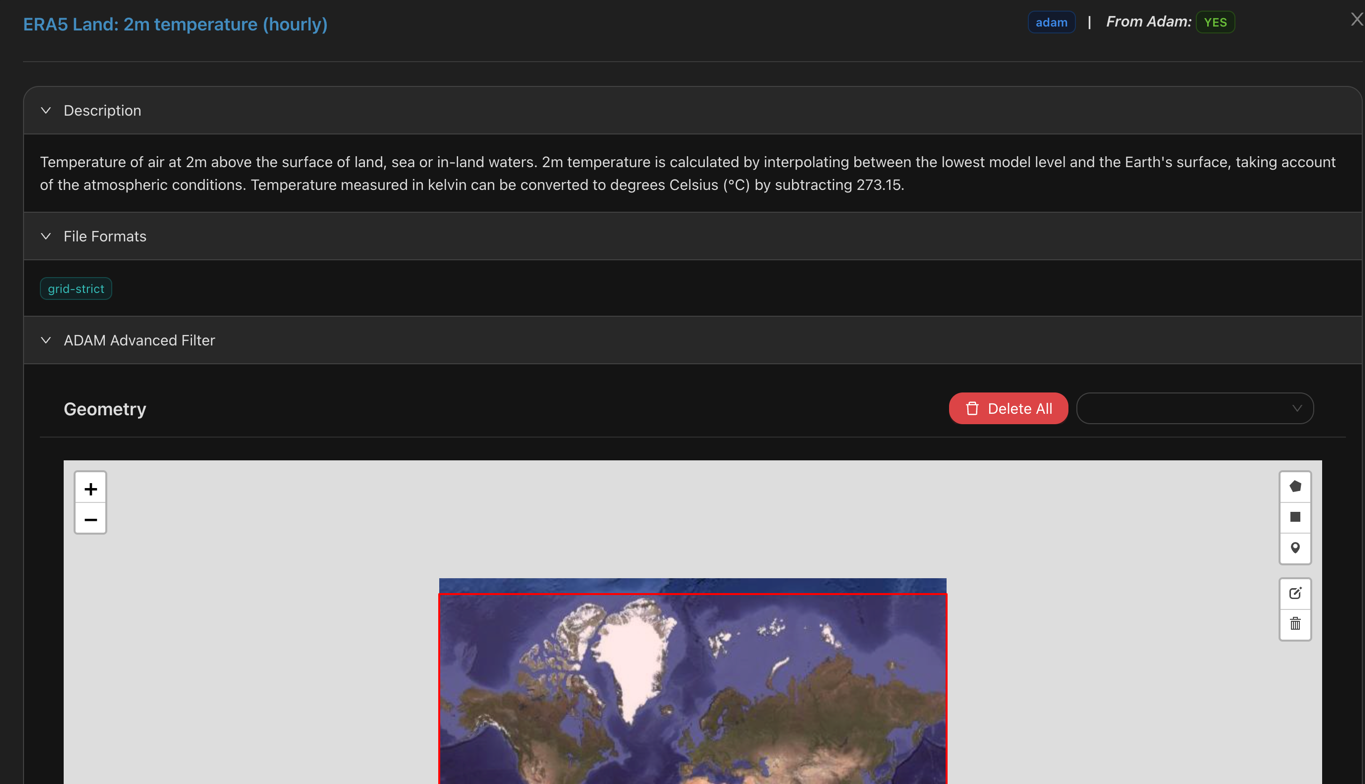
Additionally, another section of this menu is the ADAM Advanced Filter where the user can choose the area of interest on the map.
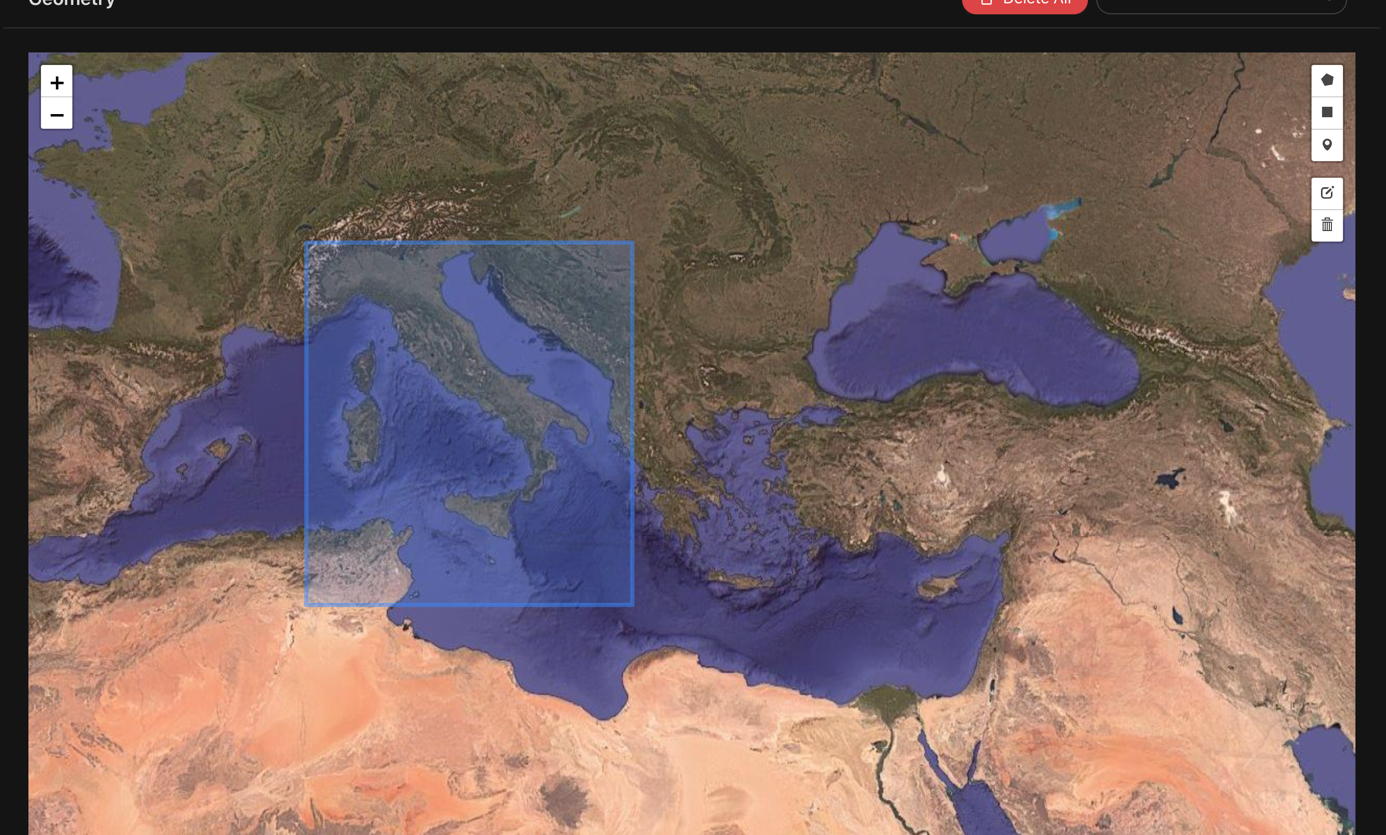
Once the area is defined, the user can choose the date ranges.
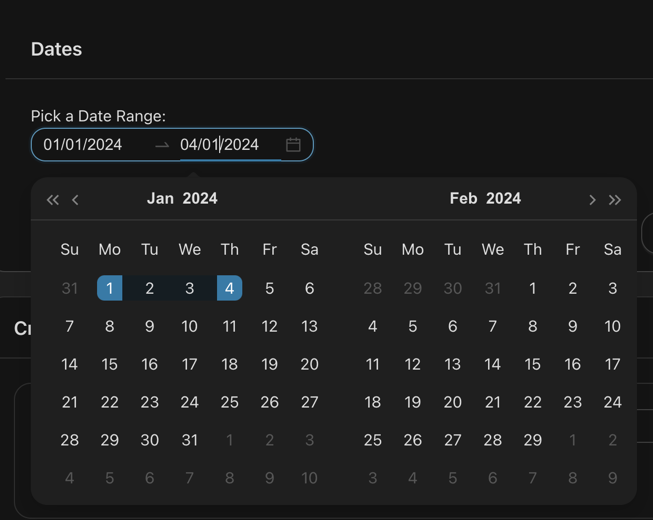
Once the date range is defined you can filter them to identify the correct products to download and select the button “Filter now”.
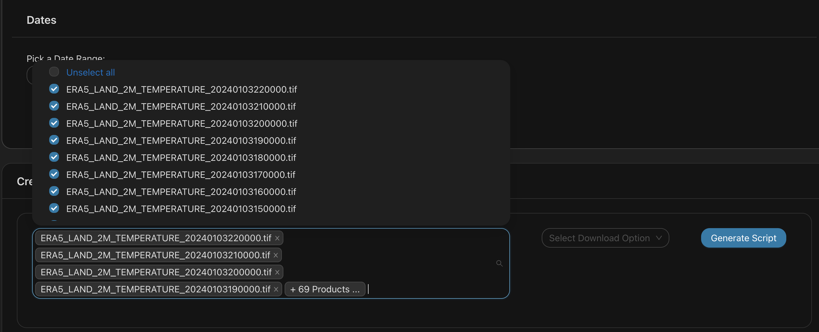
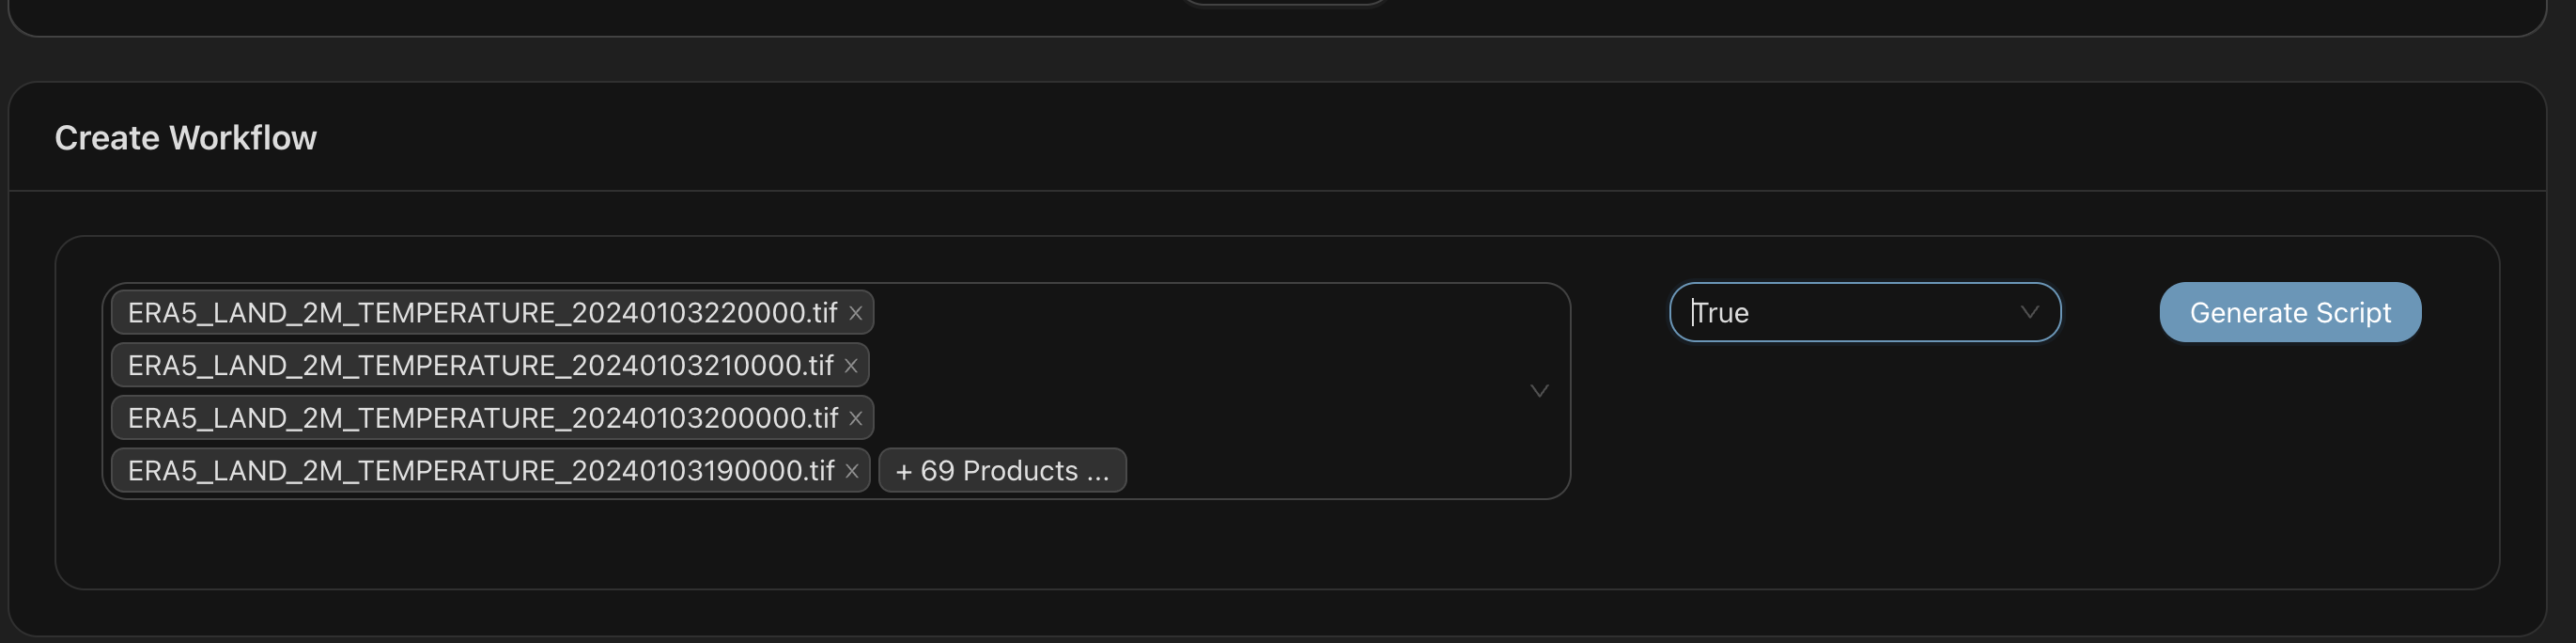
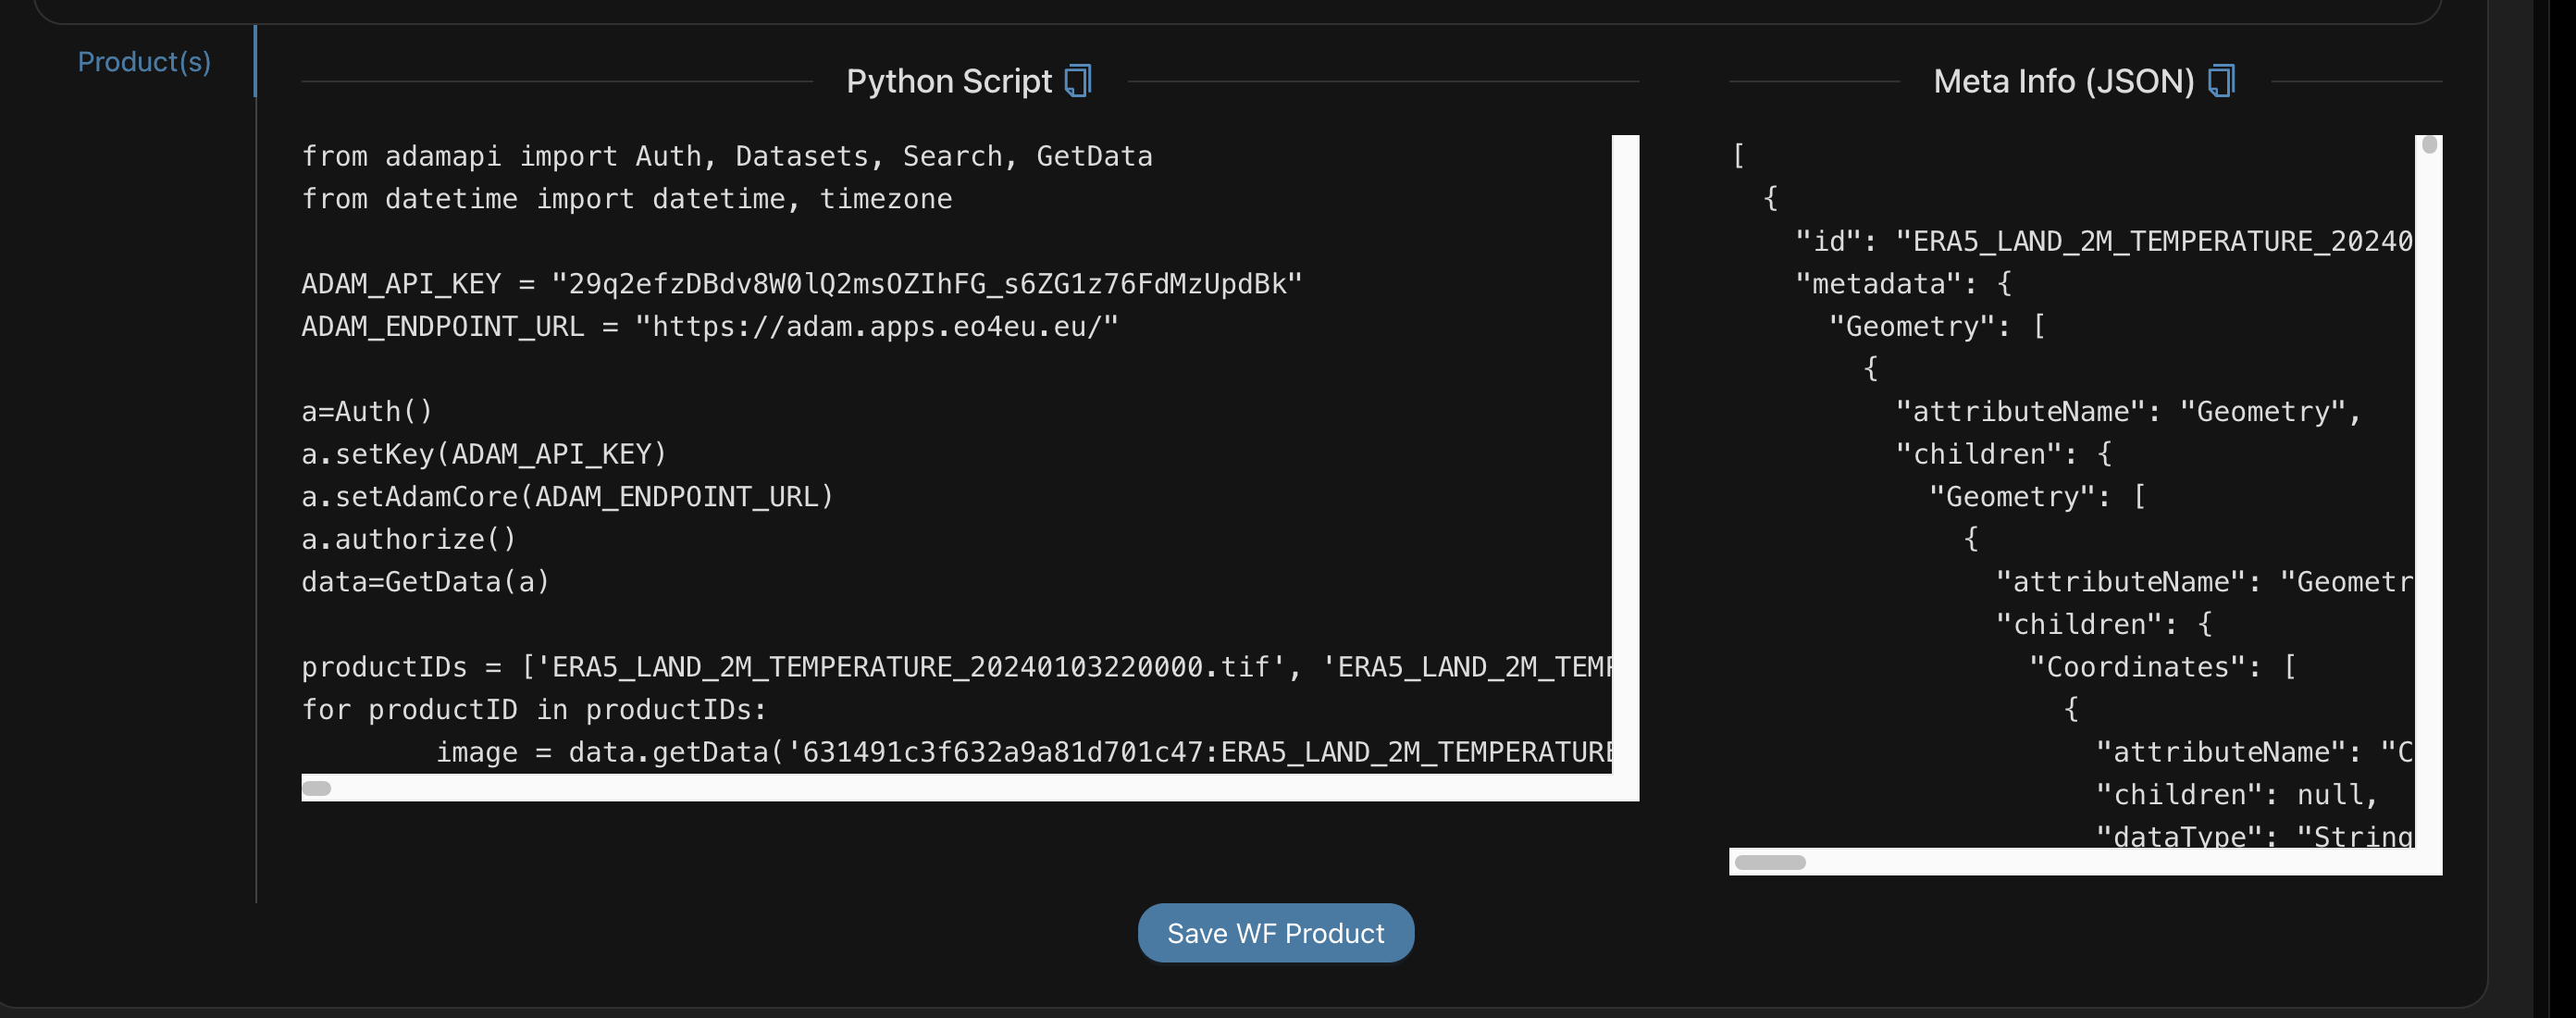
When the products are chosen, the user can choose whether the EO4EU visualisation tool should be used. Then, the user uses the Generate Script button to create the Python Script and the Meta Info JSON that will be passed to the Workflow Editor Component.
The user as a final step shall select the button “Save WF product”. The next thing is the Workflow Creator.
Workflow Creator
Workflow creator is the common space where a user can have an overview of all the saved workflow products in their account.
In this section a user shall type a workflow name in the respective field.
Afterwards the user shall either select some workflow products to be used in this workflow or can select none in order to create an empty workflow. An empty workflow can be used in order to upload in the next step a user its own data, i.e. in situ. The user, after selecting the preferred workflow products, if needed, and adds a name, can press the create workflow button to create the workflow in the workflow editor.
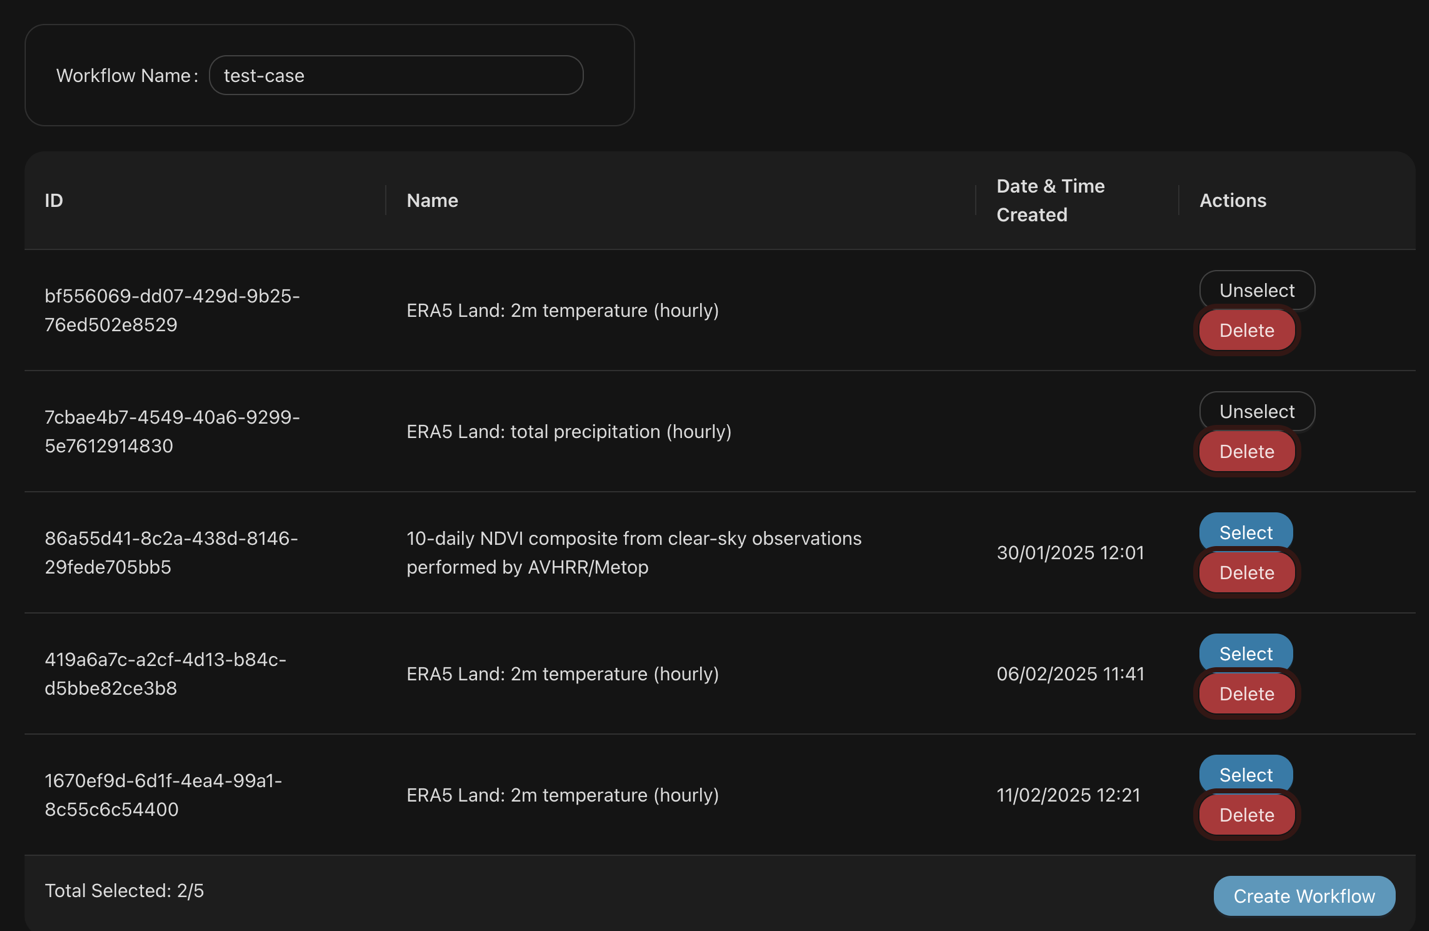
For the specific use case we named our use case as “test-case”, we selected 2 workflow products, and we selected the “Create workflow” button.
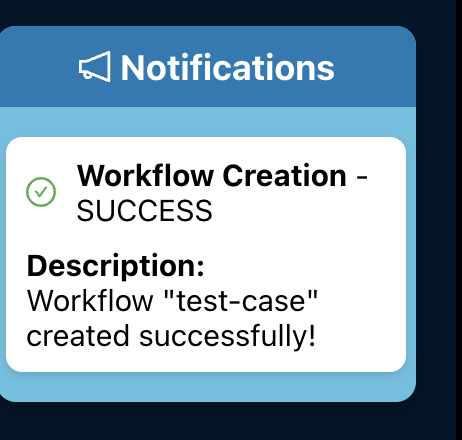
A user can check if the workflow has created correctly by the notification area and the message success in the left part of the platform
The next step is for the user to create a chain of actions in the Workflow Editor for the specific data input.
Workflow Editor
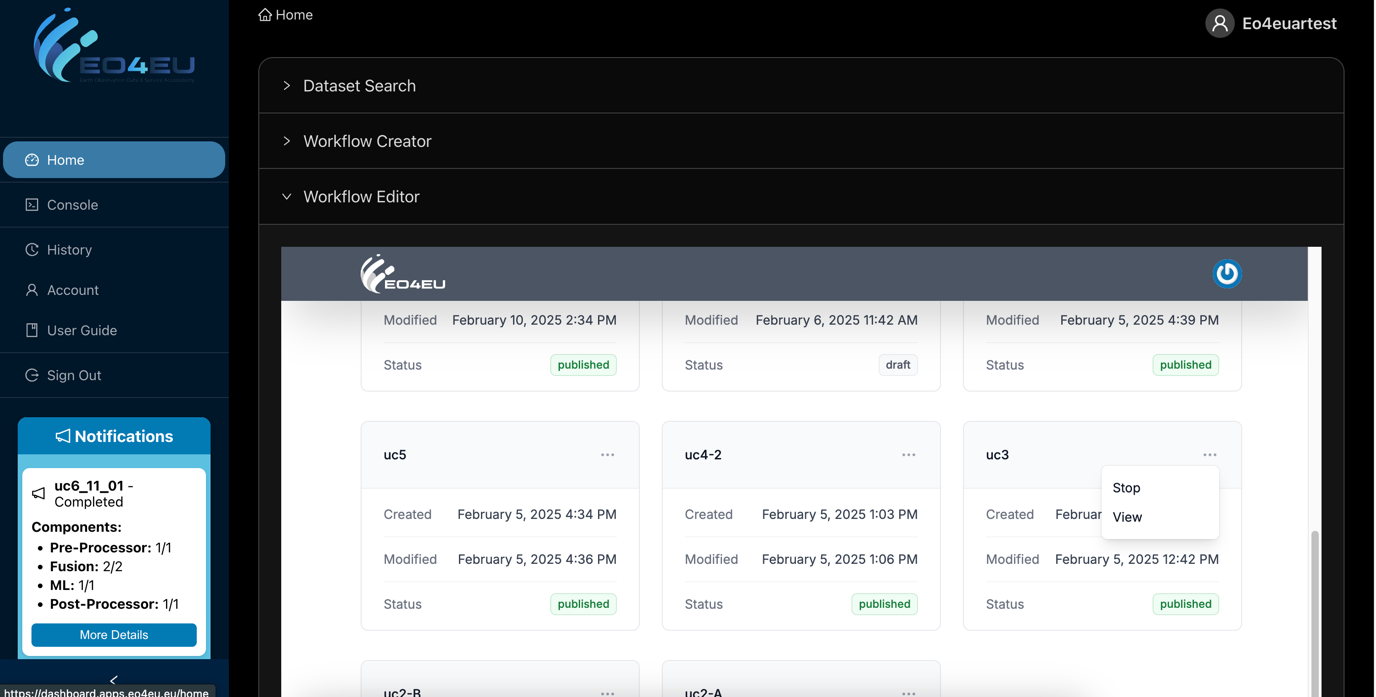
WFE is a component of the EO4EU platform that a user can manage (publish, delete and save as draft) a workflow.
In the application there are two basic views. The view that the user can see and manage all the workflows that have been created, as well as their status and the editing view named as Workflows List.
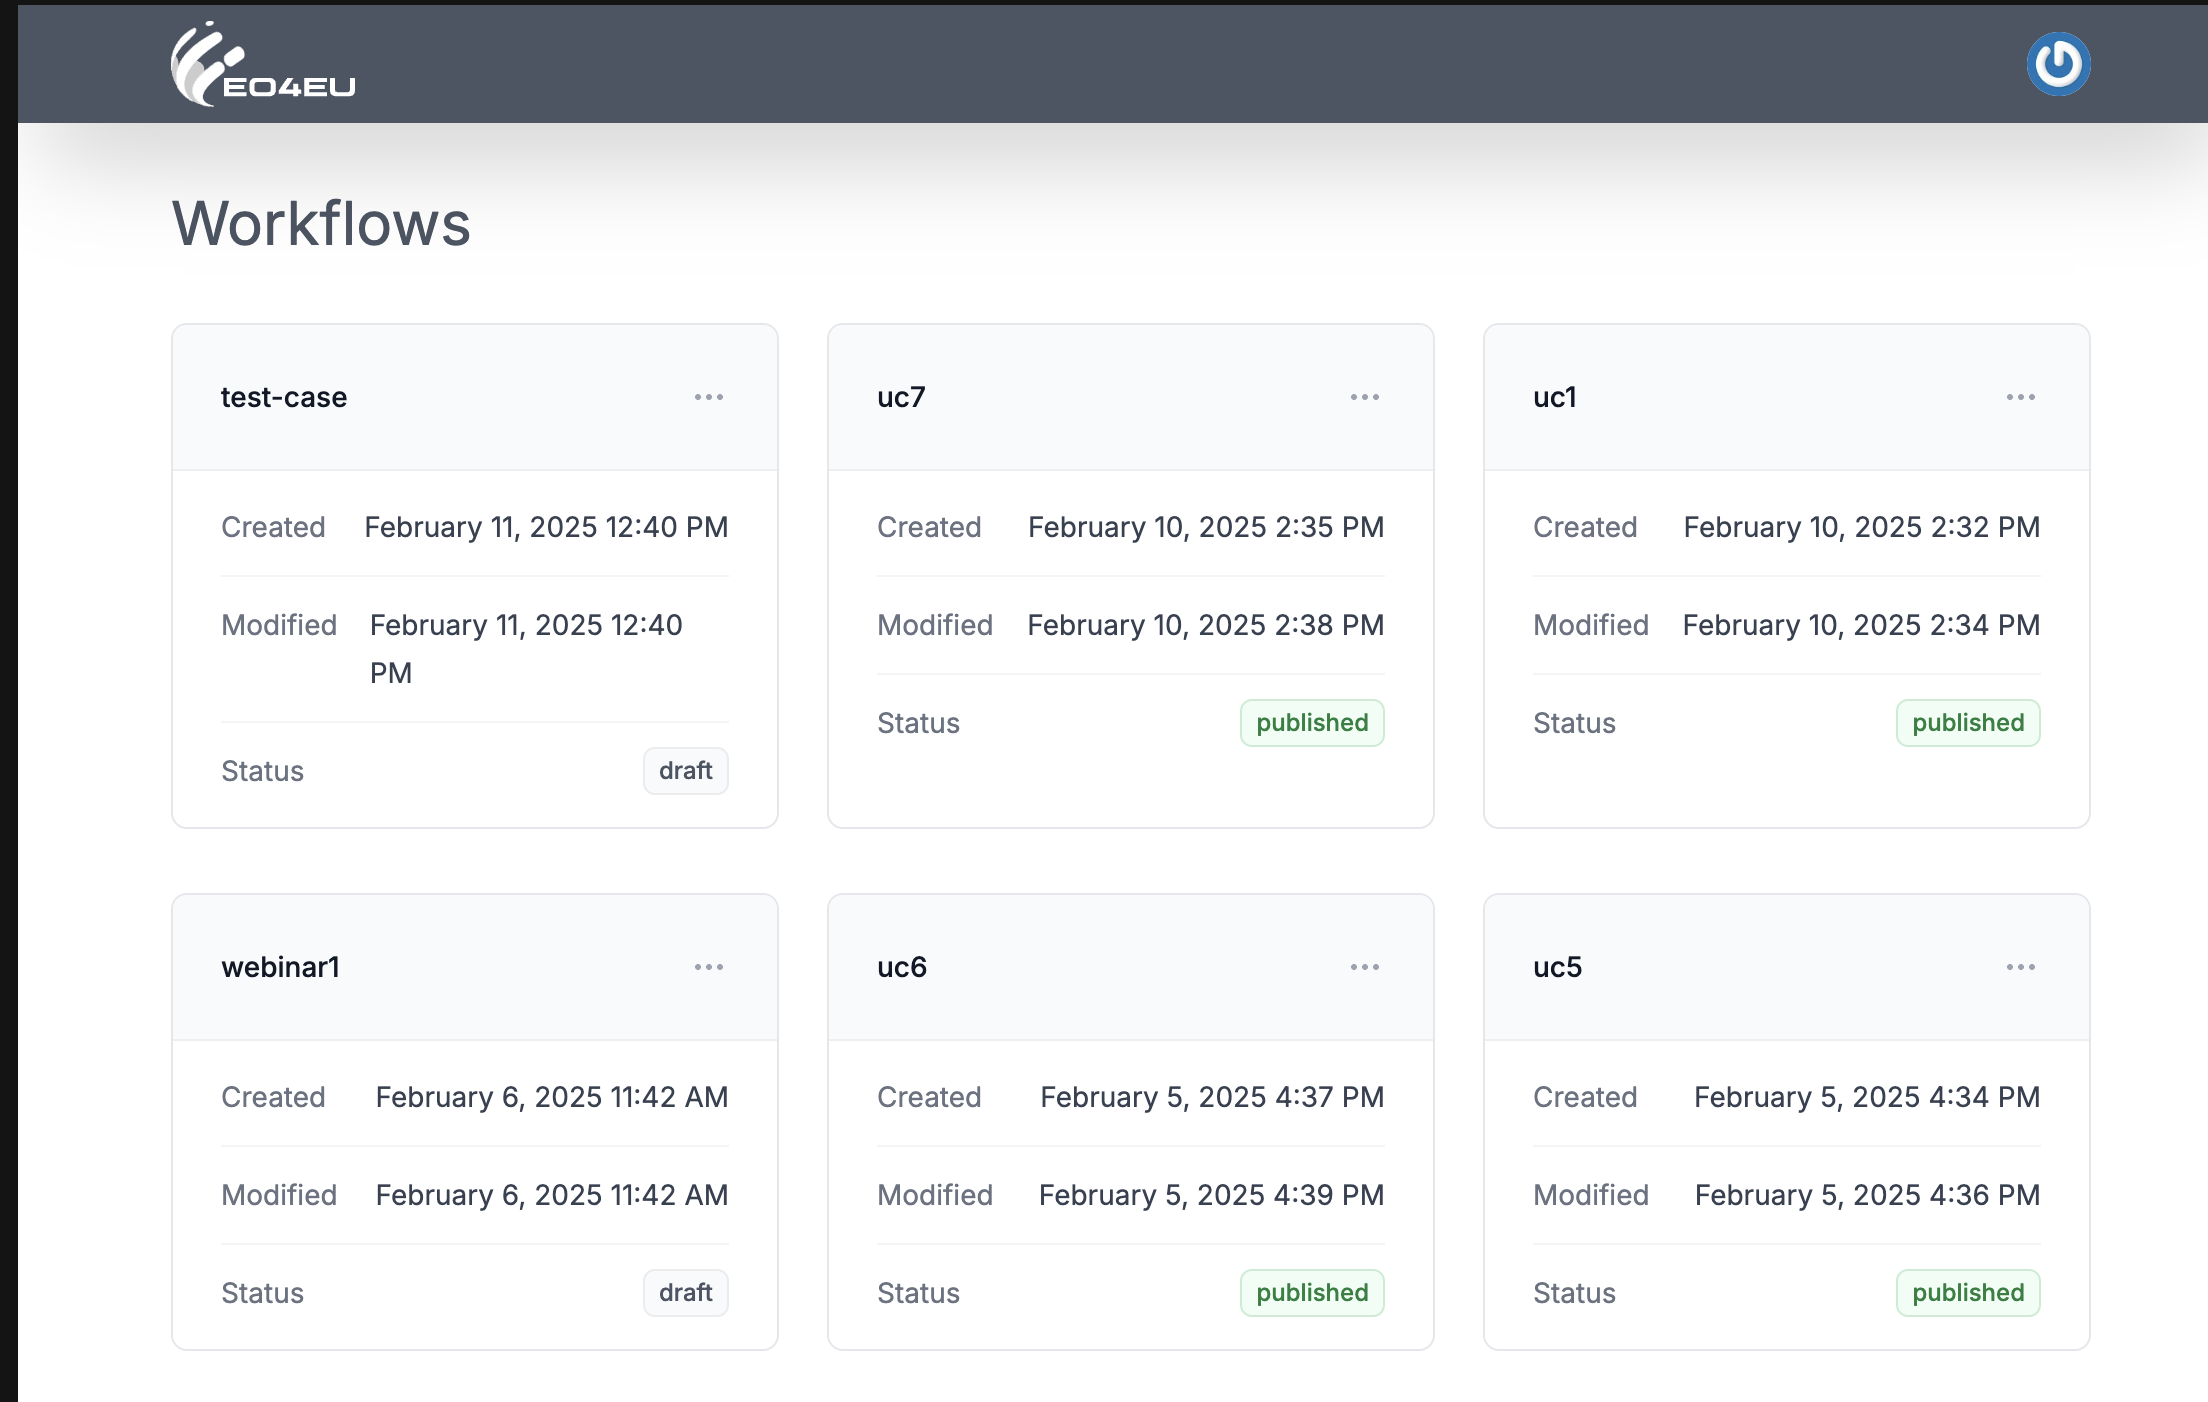
The status of each workflow is visible in each workflow item. All possible statuses are: - compiling
compiled
publishing
published
stopping
Stopped
completed
error
With 3-dots menu, in the top right corner of the item, a user can see publish, view or delete an item depending on the state of this.
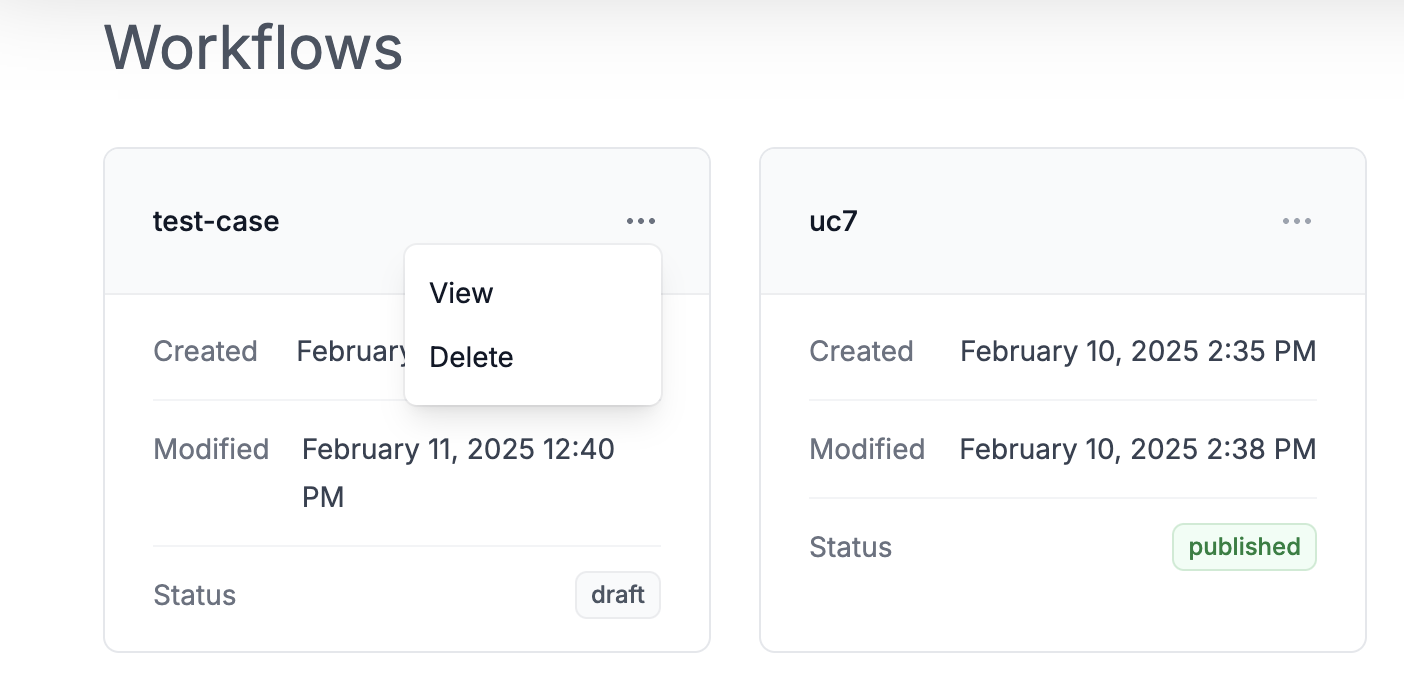
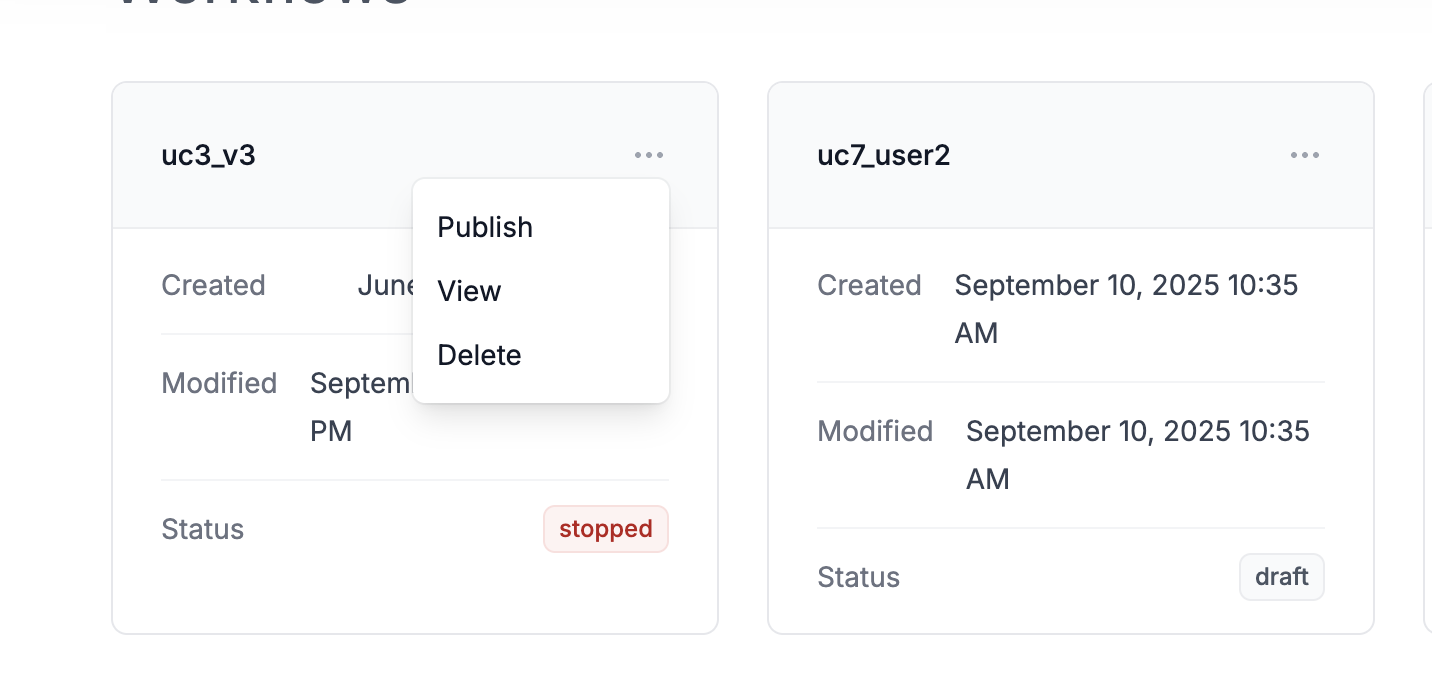
In a user selects view, the workflow editor builder opens.
The editor is divided into three main sections. The top bar where the user can save his work or publish it. The editing canvas and the marketplace of the components available, on the left, for insertion into the workflow.
A user can return in the previous page by clicking the left arrow close to the workflow name.
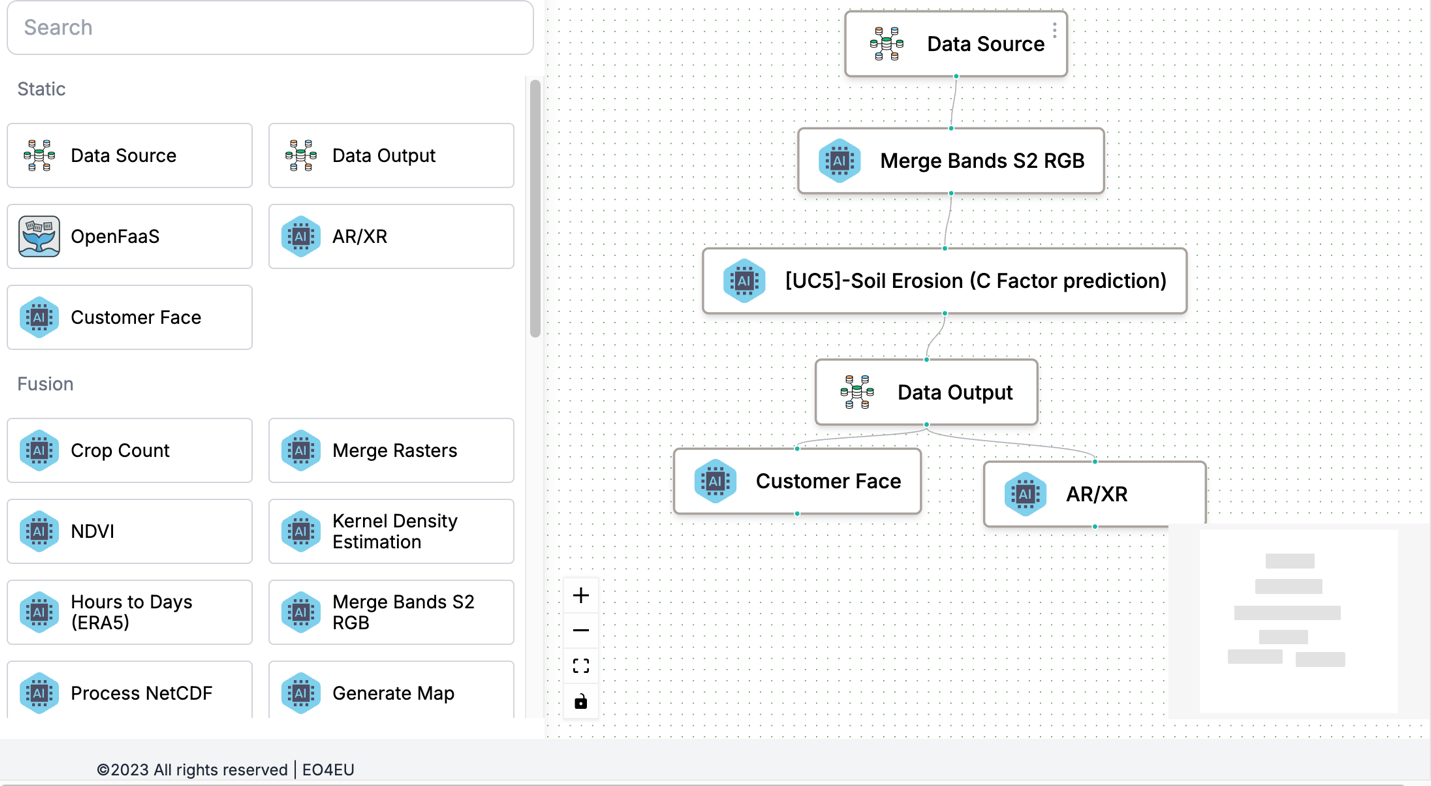
Items in the marketplace are searchable
A workflow building process is by drag-and-drop items from the marketplace to the canvas and connecting them.
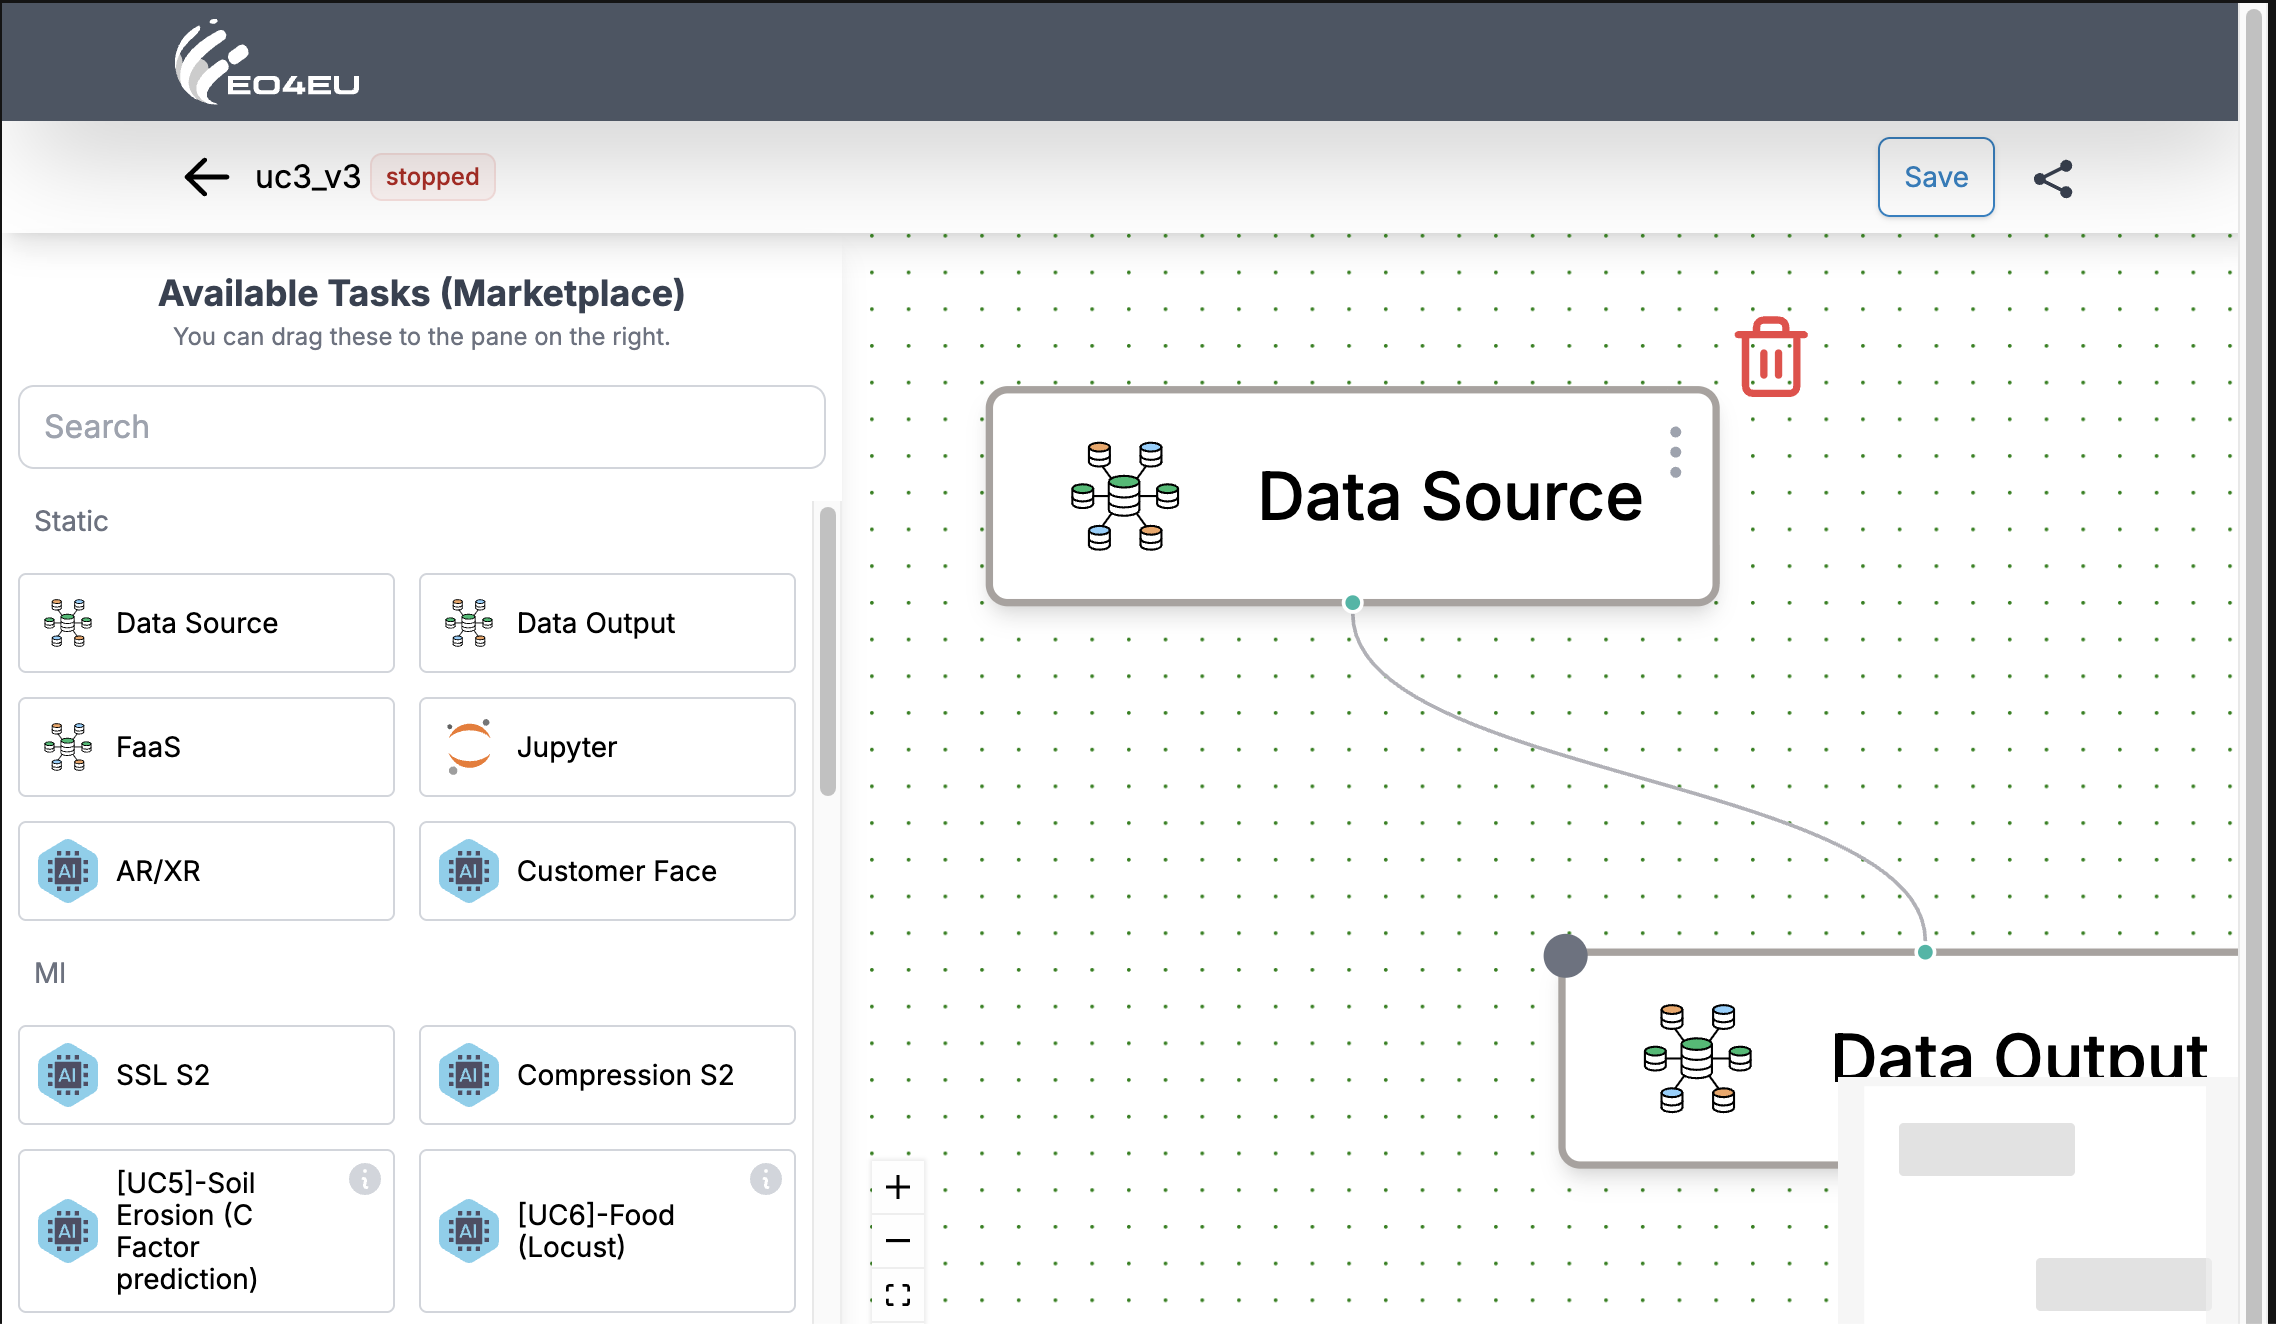
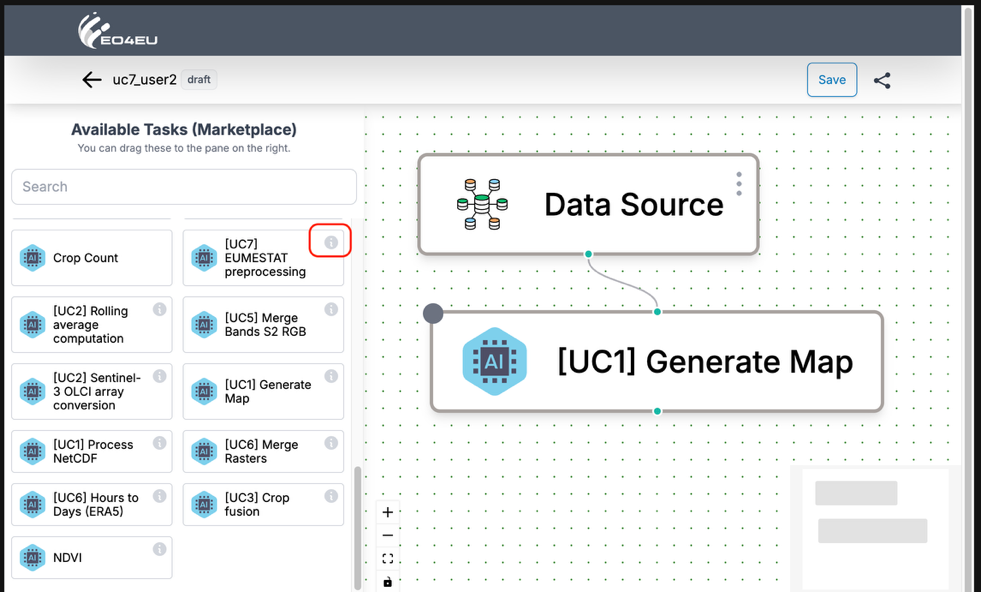
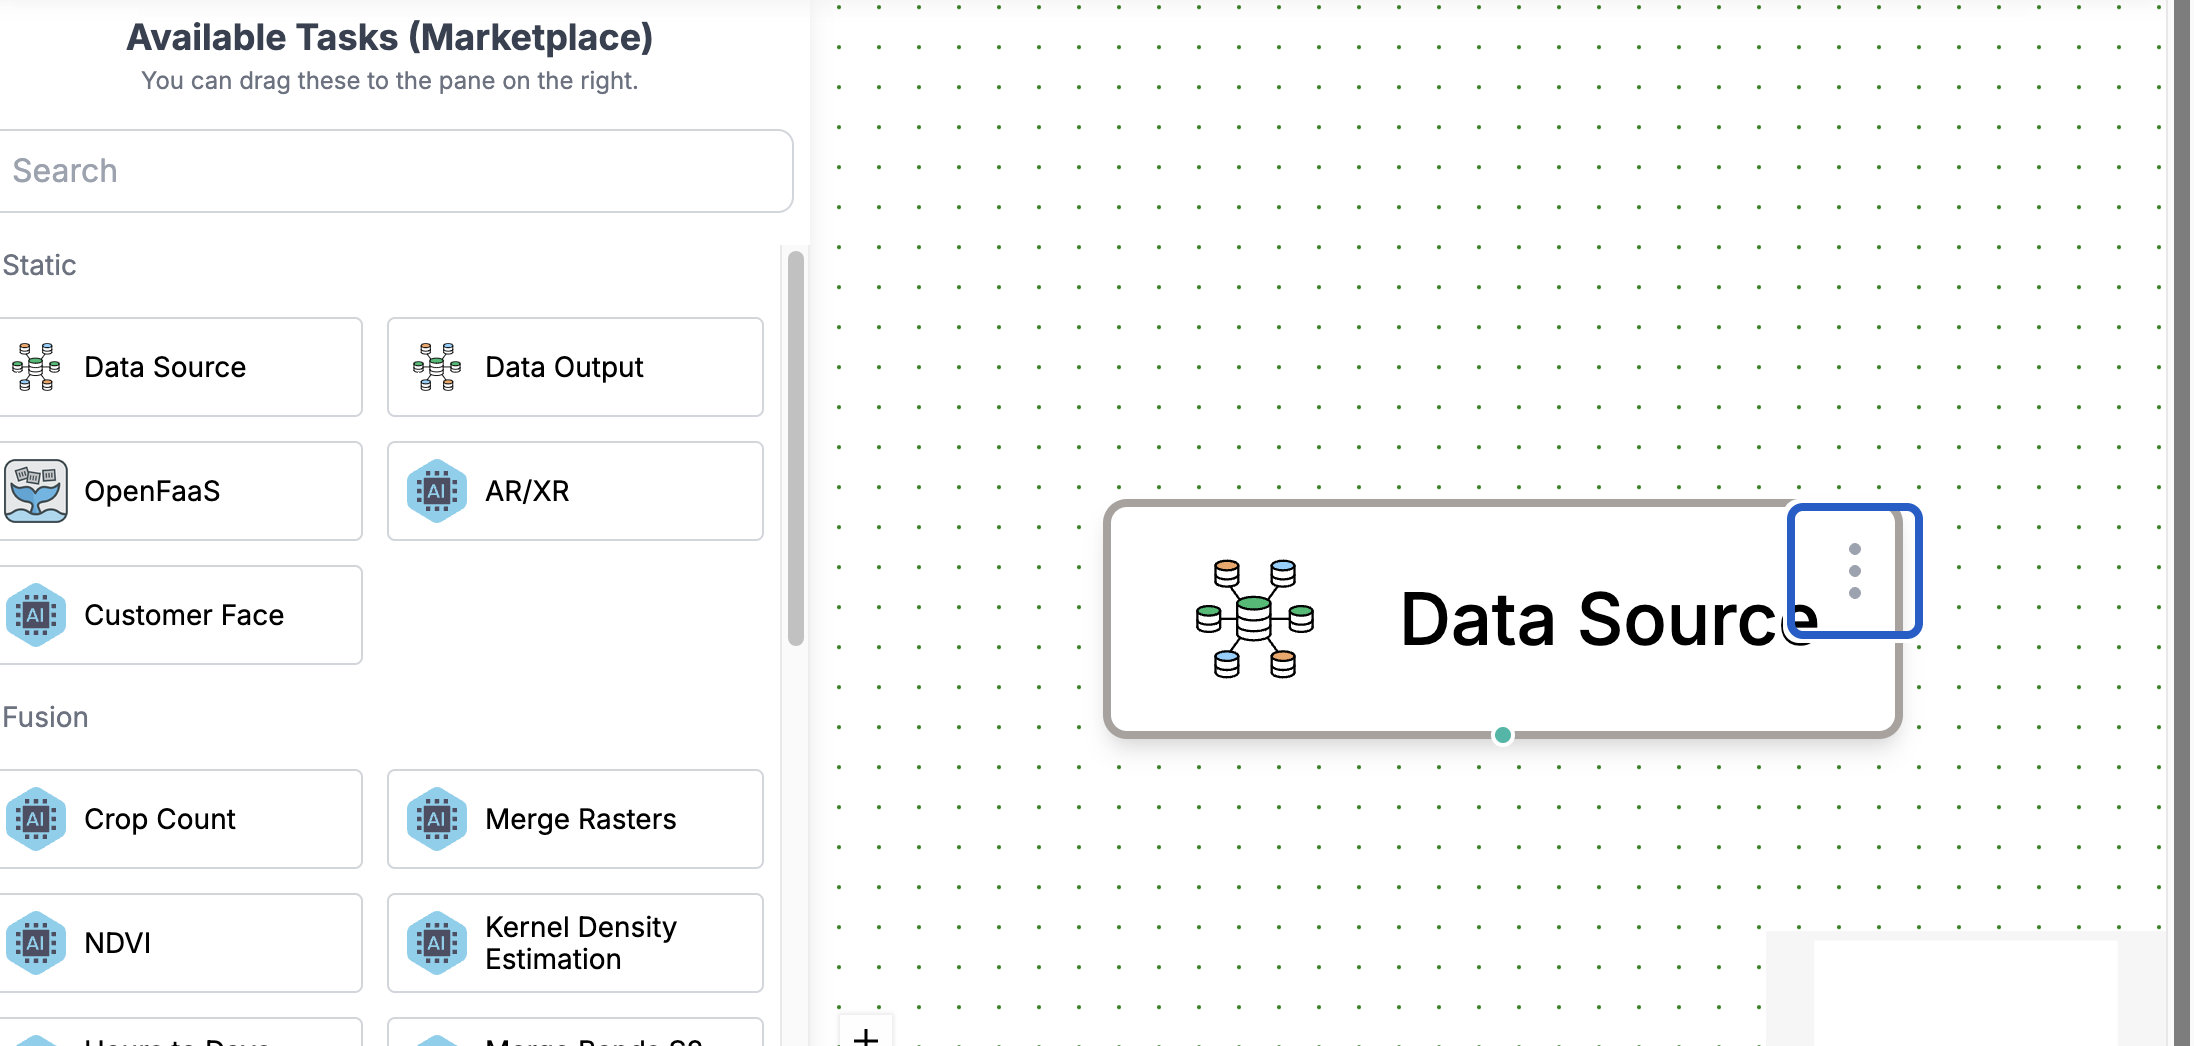
Editable items have a 3-dot menu. Clicking on it opens a new window in which the user can edit the parameters of each component. Items can be deleted if the pointer hovers at the right up corner.
The information for the use cases can be shown if you press the three dots of the components
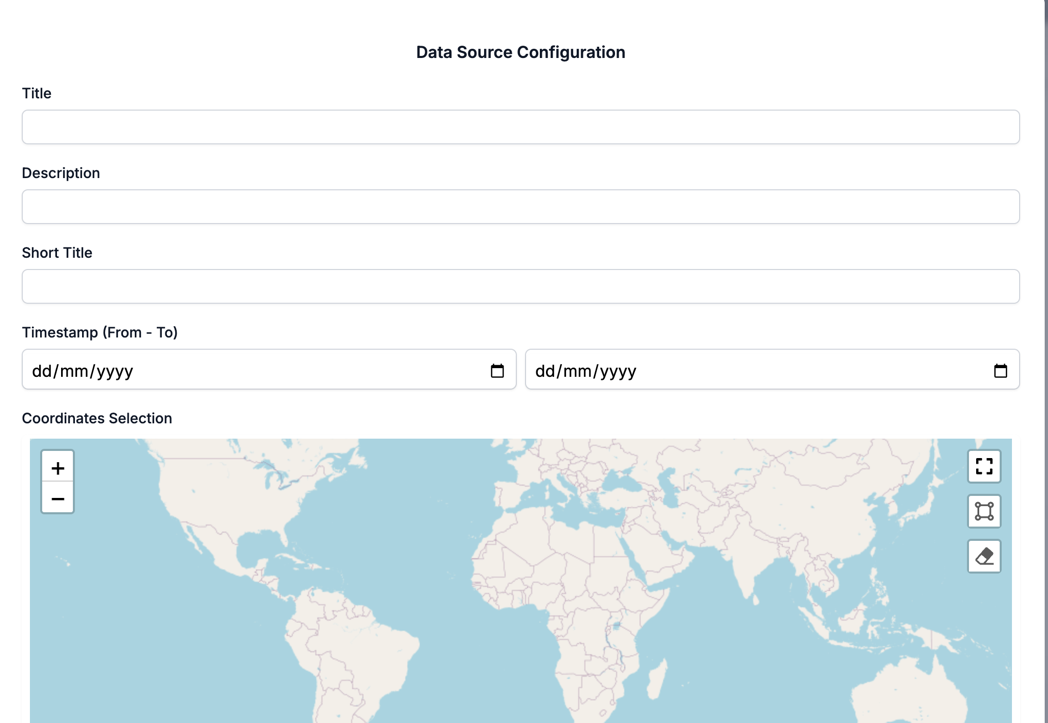
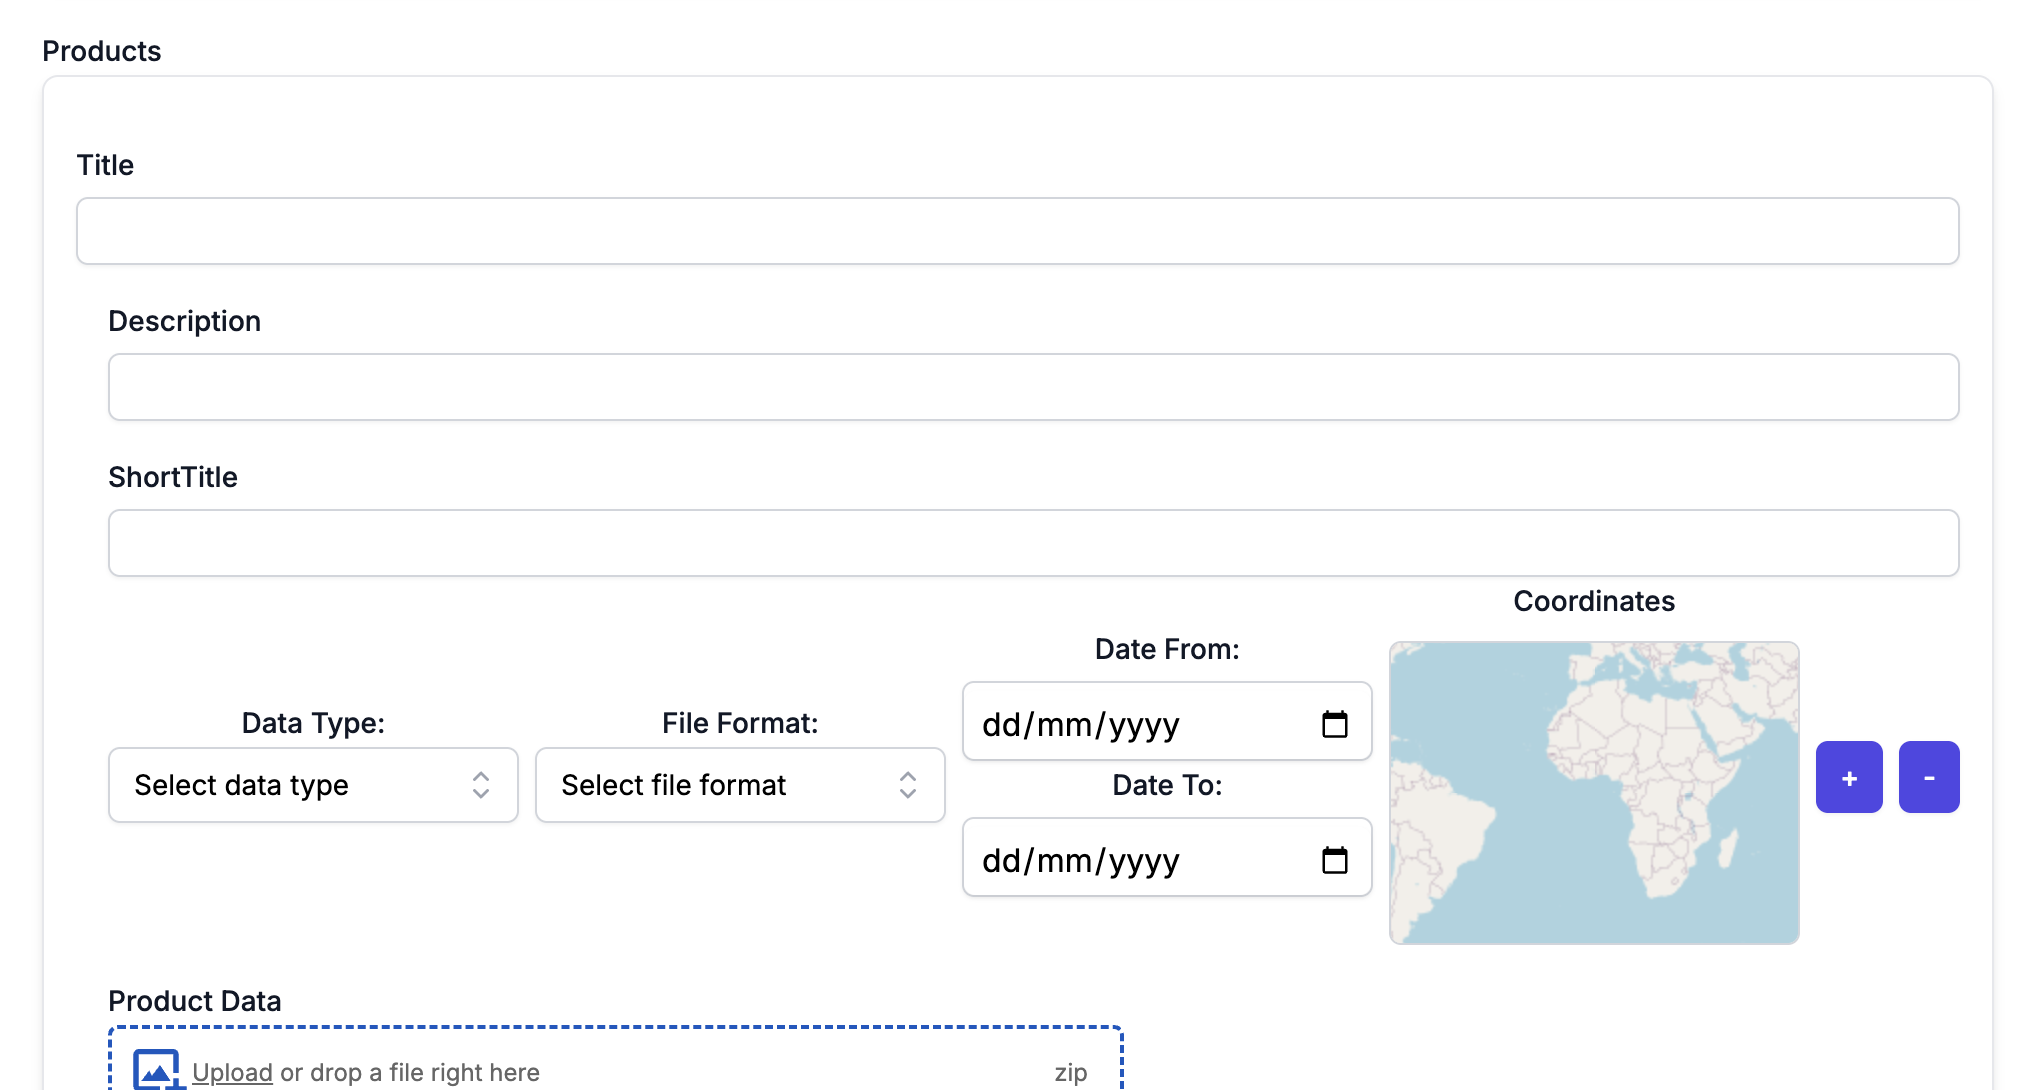
In the data source, users can upload new files and manage their files and directories.
All the insitu data shall be registered with the same notation that all data sources are integrated in KG. The in situ data then can be permantly stored in the KG as an added datasource.
The new data can be characterized as a new Data source with title
When the chain of the actions is completed then the user can either save the workflow or publish the workflow, which is translated to start the workflow.
Finally, if the user wants to go back to the first screen of the WFE, the user should press on the arrow at the top left of the Workflow Editor section.
Once the workflow is started, the progress of the workflow can be found in the notifications section of the EO4EU portal.
The results of the Workflow
Once the workflow processing has been completed, whether raw or processed data, the output files can be visualised in three ways. If the results are geotiffs, they can be visualised on maps by overlaying layers in 2D through the “Map Visualisation” component. The results can be visualised on graphs or tables through the “Data Visualisation” component if the results are arithmetic data. Finally, the platform provides the option to visualise the data in a 3D mode through the XR/VR component. More details on the three components can be found in the following subsections. The files can also be accessible in the File Explorer section.
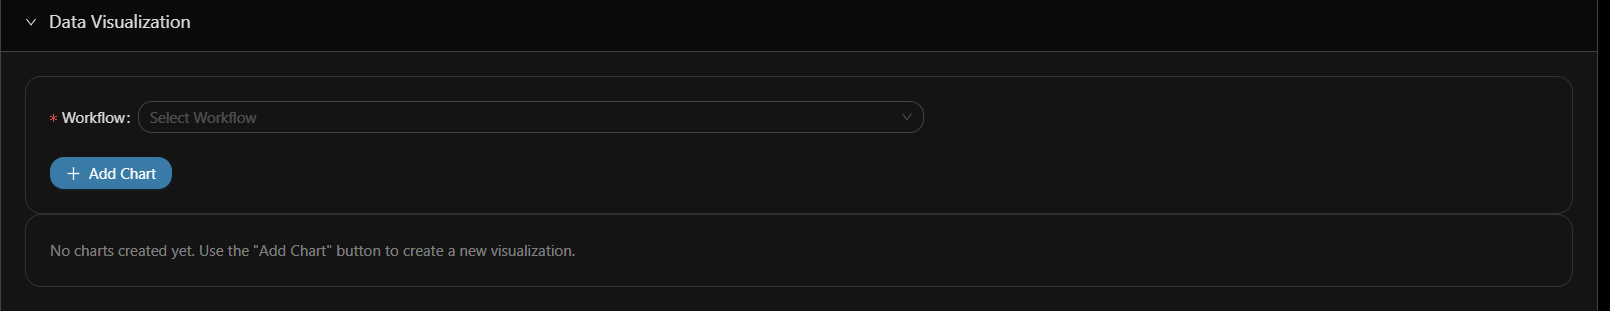
Data Visualization
The Data Visualization tool provides various charts and graphs to help users understand and analyse their data. Users can customise their visualisations and save them for future reference. The users can choose their workflow of interest from the dropdown list and generate charts using the Add Chart button.
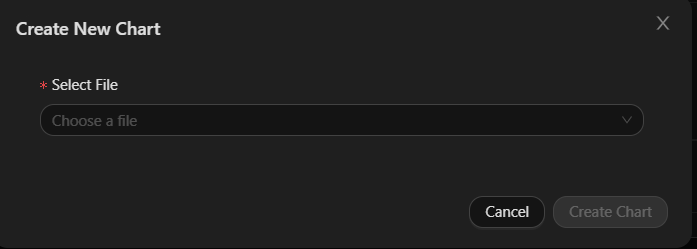
When the users press on the Add Chart button, the below menu appears to choose the file to visualise.
Once the file is chosen, another menu appears to configure what the chart will present.
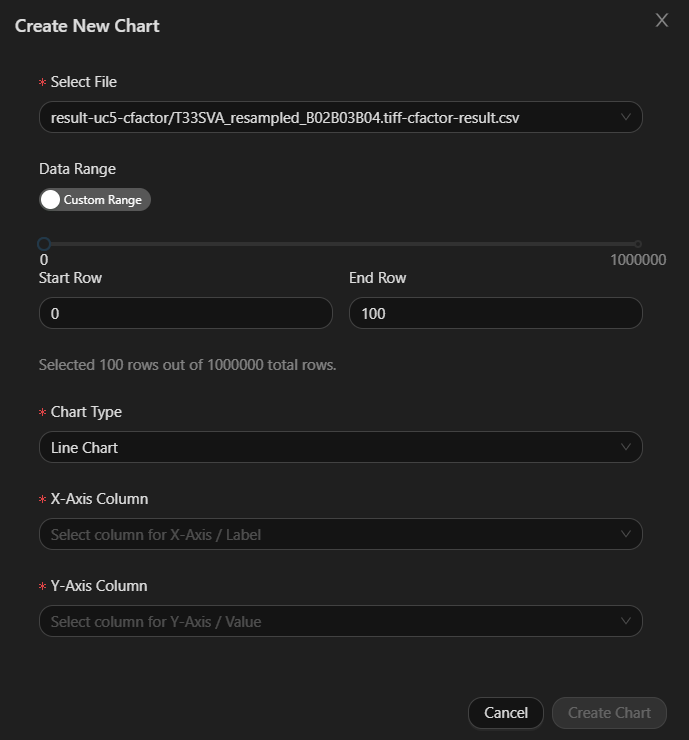
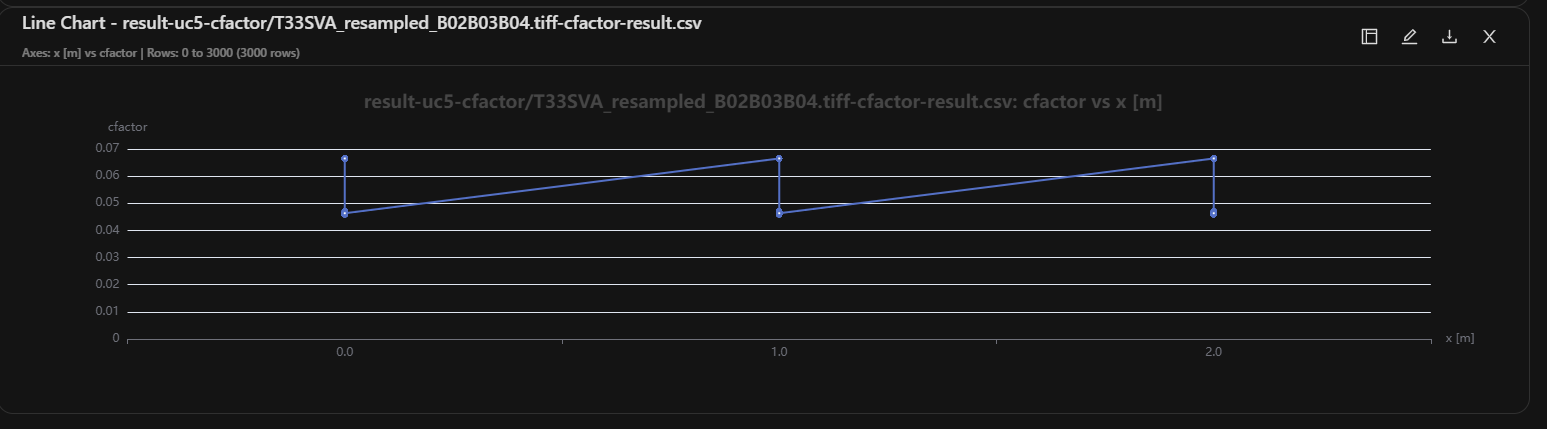
When all the configurations are provided, the user will press on Create Chart and the chart will be created. The user can create as many chart as needed with either 1 or 2 charts per row.
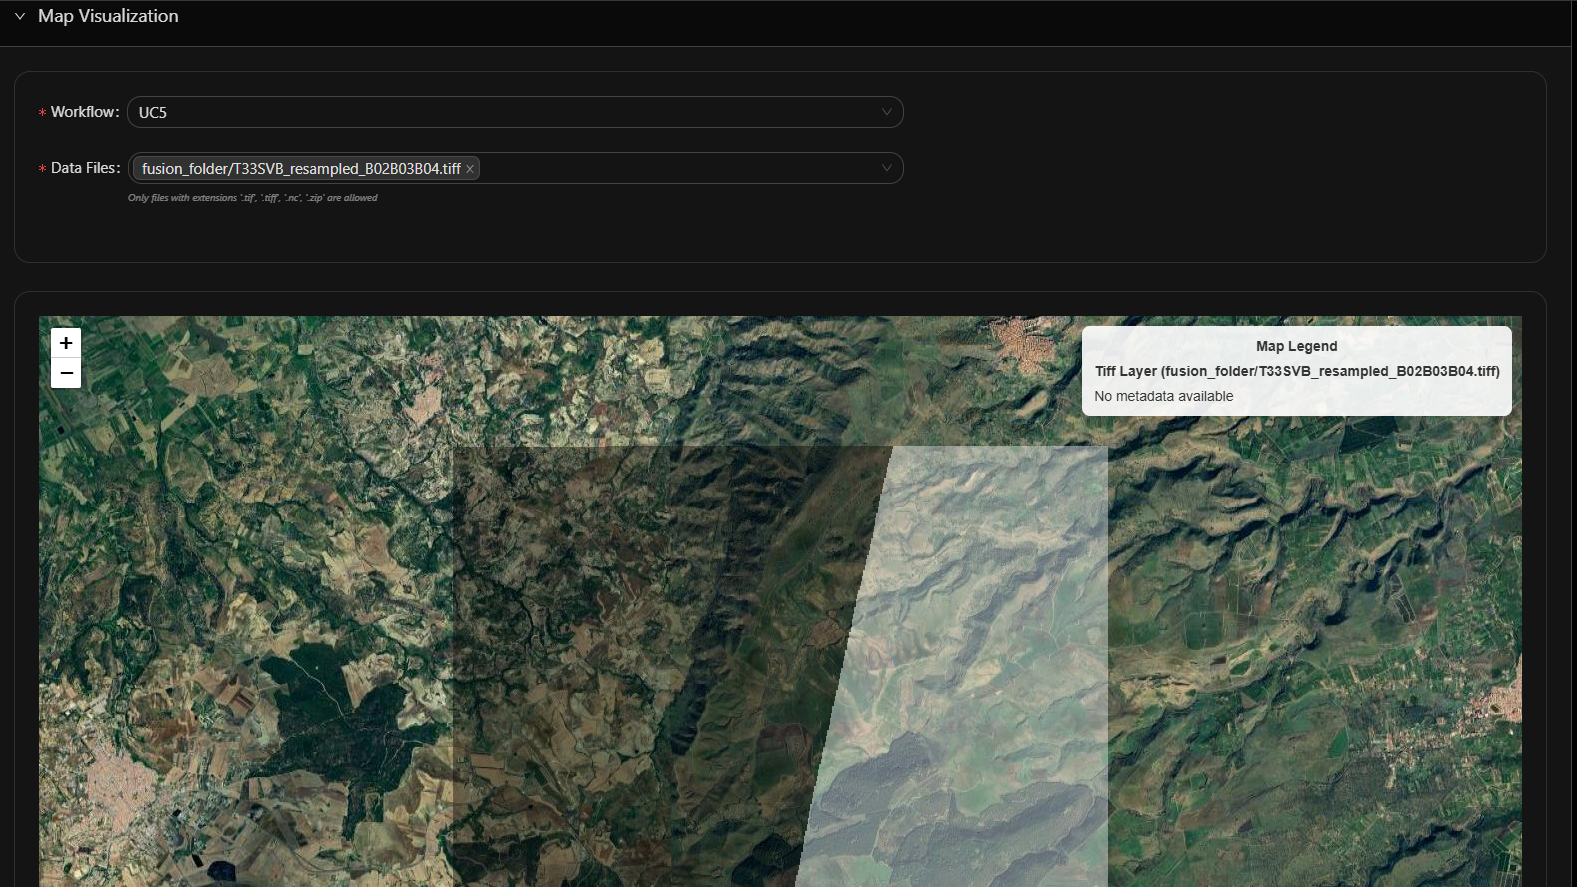
Map Visualization
The Map Visualization tool allows users to visualise geospatial data on a map. Users can overlay different datasets and use various spatial data analysis tools.
The user can choose the Workflow with available data from the Workflow dropdown menu and select the file (or multiple files) they want to visualise. The tool can visualise tiff, NetCDF and shapefiles.
XR/VR
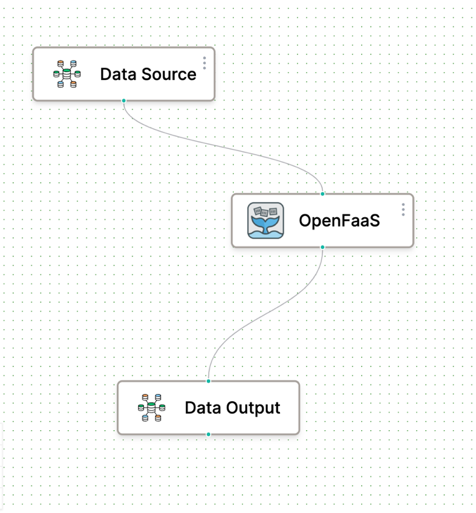
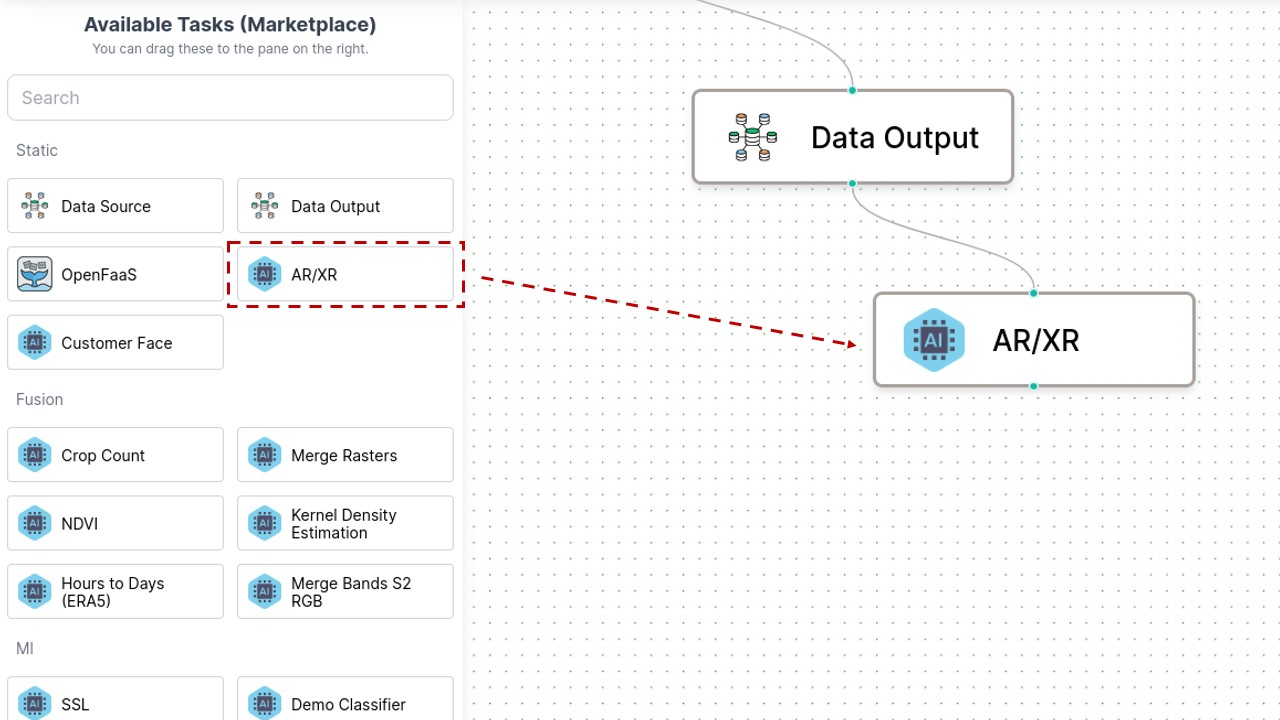
This tool allows the user to explore the output data and the intermediate results of a specific workflow in an Extended Reality (XR) environment, namely Virtual Reality (VR) environment and Augmented Reality (AR) environment. Currently it is available on the dashboard only the possibility to visualize the data in a Virtual Reality environment. To enable the XR visualization on a specific workflow, during its creation within the Workflow Editor application, the AR/XR task needs to be linked to the data output task as shown in the following image:
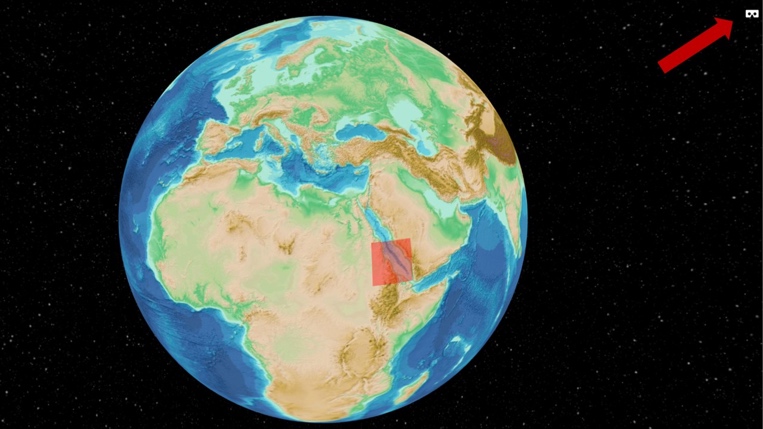
When a specific workflow is selected using select workflow section in the dashboard, if the XR visualization was enabled during the creation phase of the workflow, the VR visualization of its resulting data is available opening the XR/VR tab in the dashboard Home section. In the VR interface home page, all the areas covered by the data resulting from the selected workflow are displayed as selectable bounding boxes on a globe. If a device supporting VR sessions is detected, a button appears on the top-right corner of the application and can be used to start a VR session.
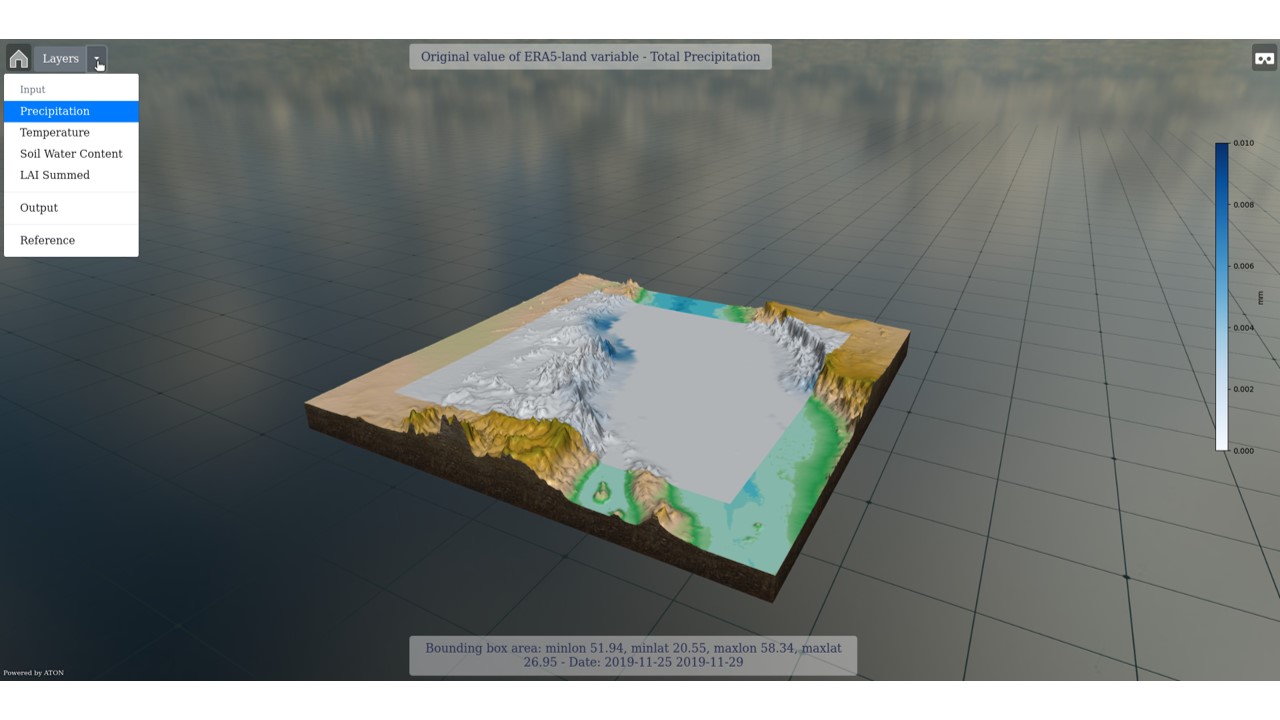
Selecting a specific bounding box, it is possible to visualize the data related to the selected area jointly with a basic set of metadata.
During a VR session a wrist mounted User Interface is available to navigate between the different data layers and display the metadata information.
File Explorer
The File Explorer allows the user to browse through uploaded and generated files. The File Explorer contains a hierarchical directory structure that the user can navigate.
In order to visualize the files in the bucket of the workflow a user shall select the name of the relevant workflow.
Console and History
At the left part of the GUI you can also overview the Console and the history tabs.
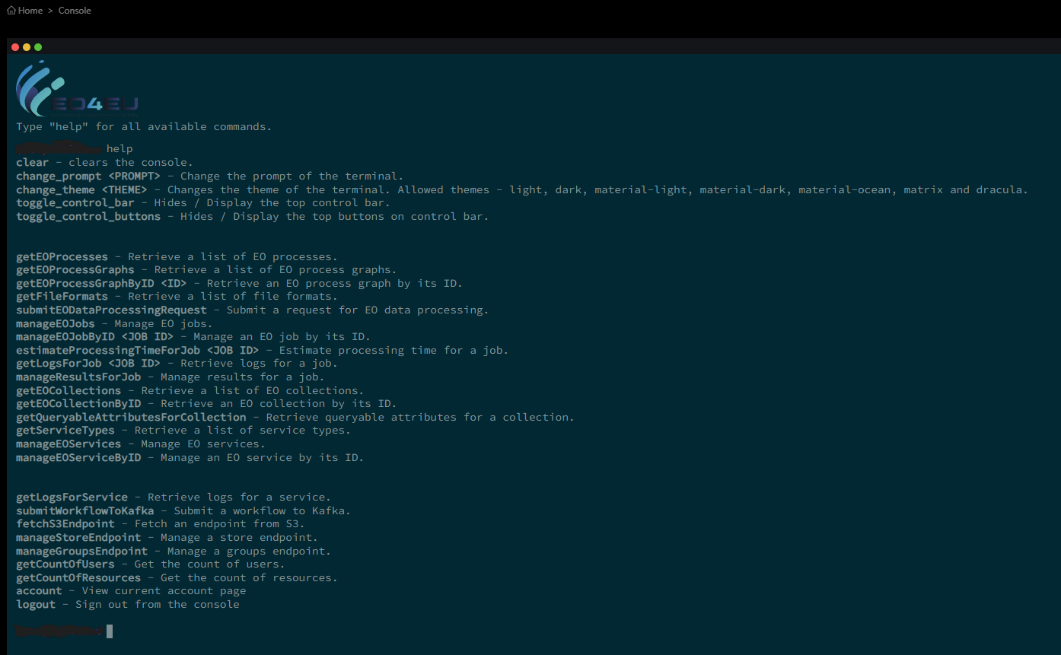
Console
The Console provides a command-line interface for advanced users to interact with the EO4EU platform. Users can execute scripts and commands directly from the console.
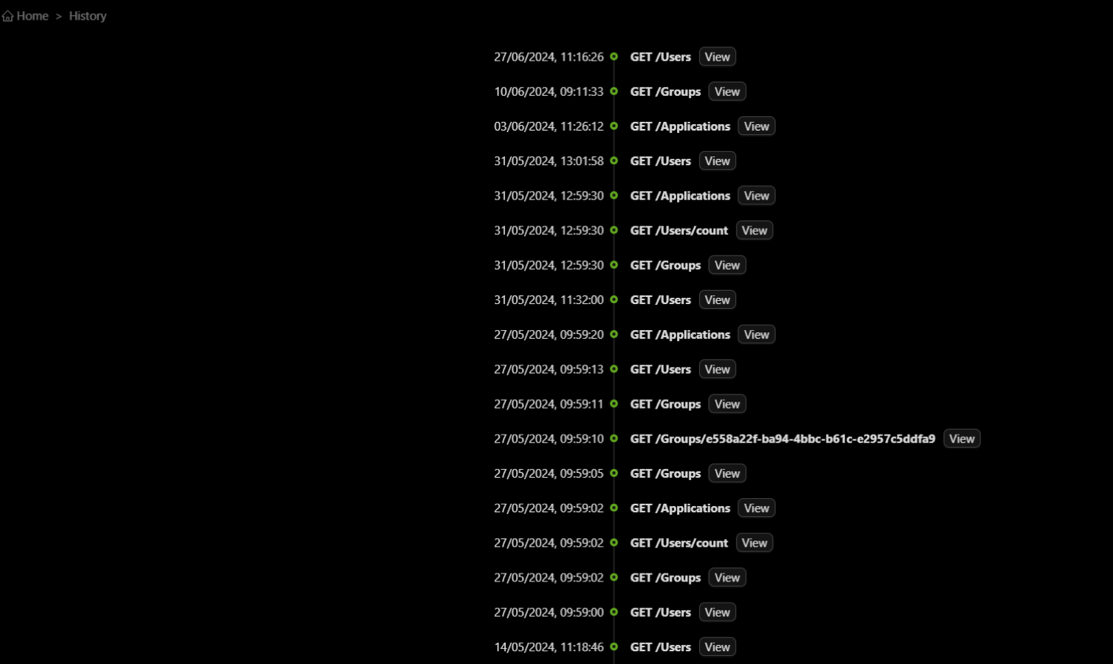
History
The User History section keeps track of all user activities and workflows. Users can view their history to review past actions and results.