Step-by-step user guide
This guide walks users through the main steps required to use InHydro for irrigation planning and water balance estimation.
Step 1 – Select field location

Users can locate their field in one of three ways:
Search by location name (e.g. city or region)
Search by geographic coordinates (latitude and longitude)
Manually select the location on the map by zooming in and clicking on the field
Once the field is selected, click on “Analyze your plot”.
Step 2 – Define field parameters

The following parameters must be provided:
Field name (used for later reference)
Crop family and crop type
Soil texture
Irrigation efficiency
Planting date
Field surface area (in hectares)
Irrigation efficiency reference values:
Drip irrigation: 95%
Sprinkler irrigation: 80%
Lined canal: 50%
Earthen canal: 20%
Step 3 – Select your data source
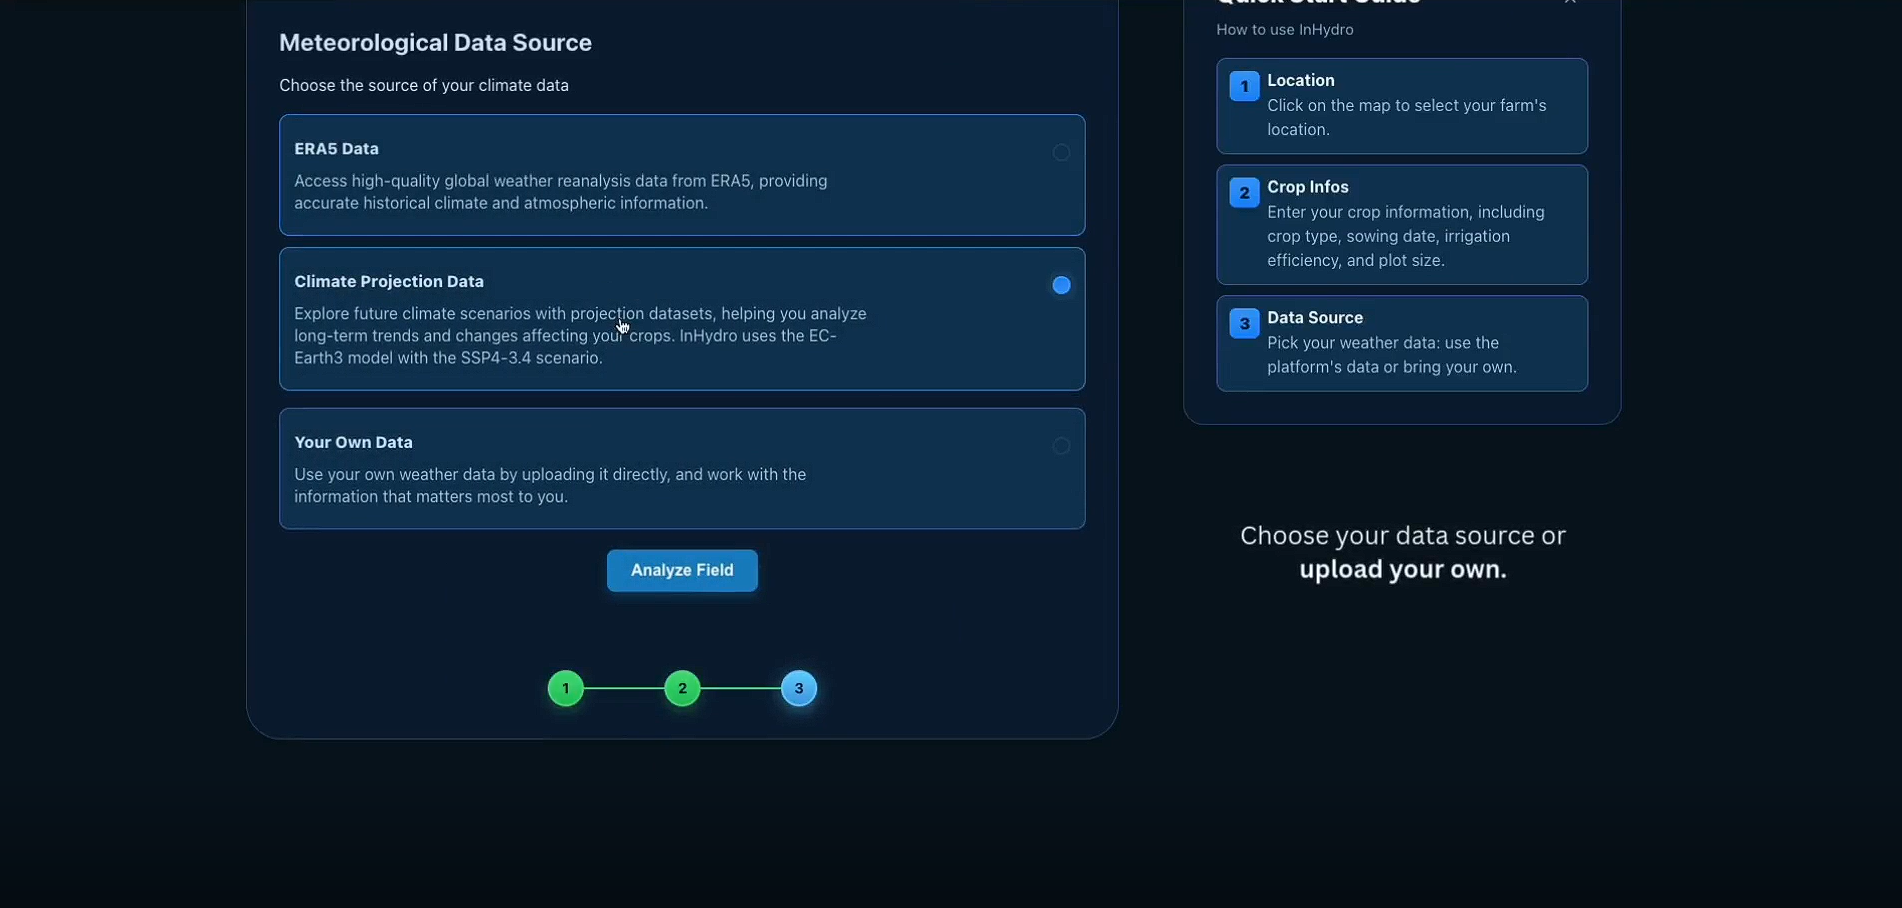
Users can choose one of the following climate data sources:
ERA5 historical data A regular lat-lon 0.25° gridded dataset provided by ECMWF.
Climate projections Based on the EC-Earth3 model using the SSP4-3.4 scenario, representing medium to high challenges to climate mitigation and adaptation.
Custom weather data User-provided datasets from local weather stations in CSV or Excel format.
Step 4 – View results and download analysis
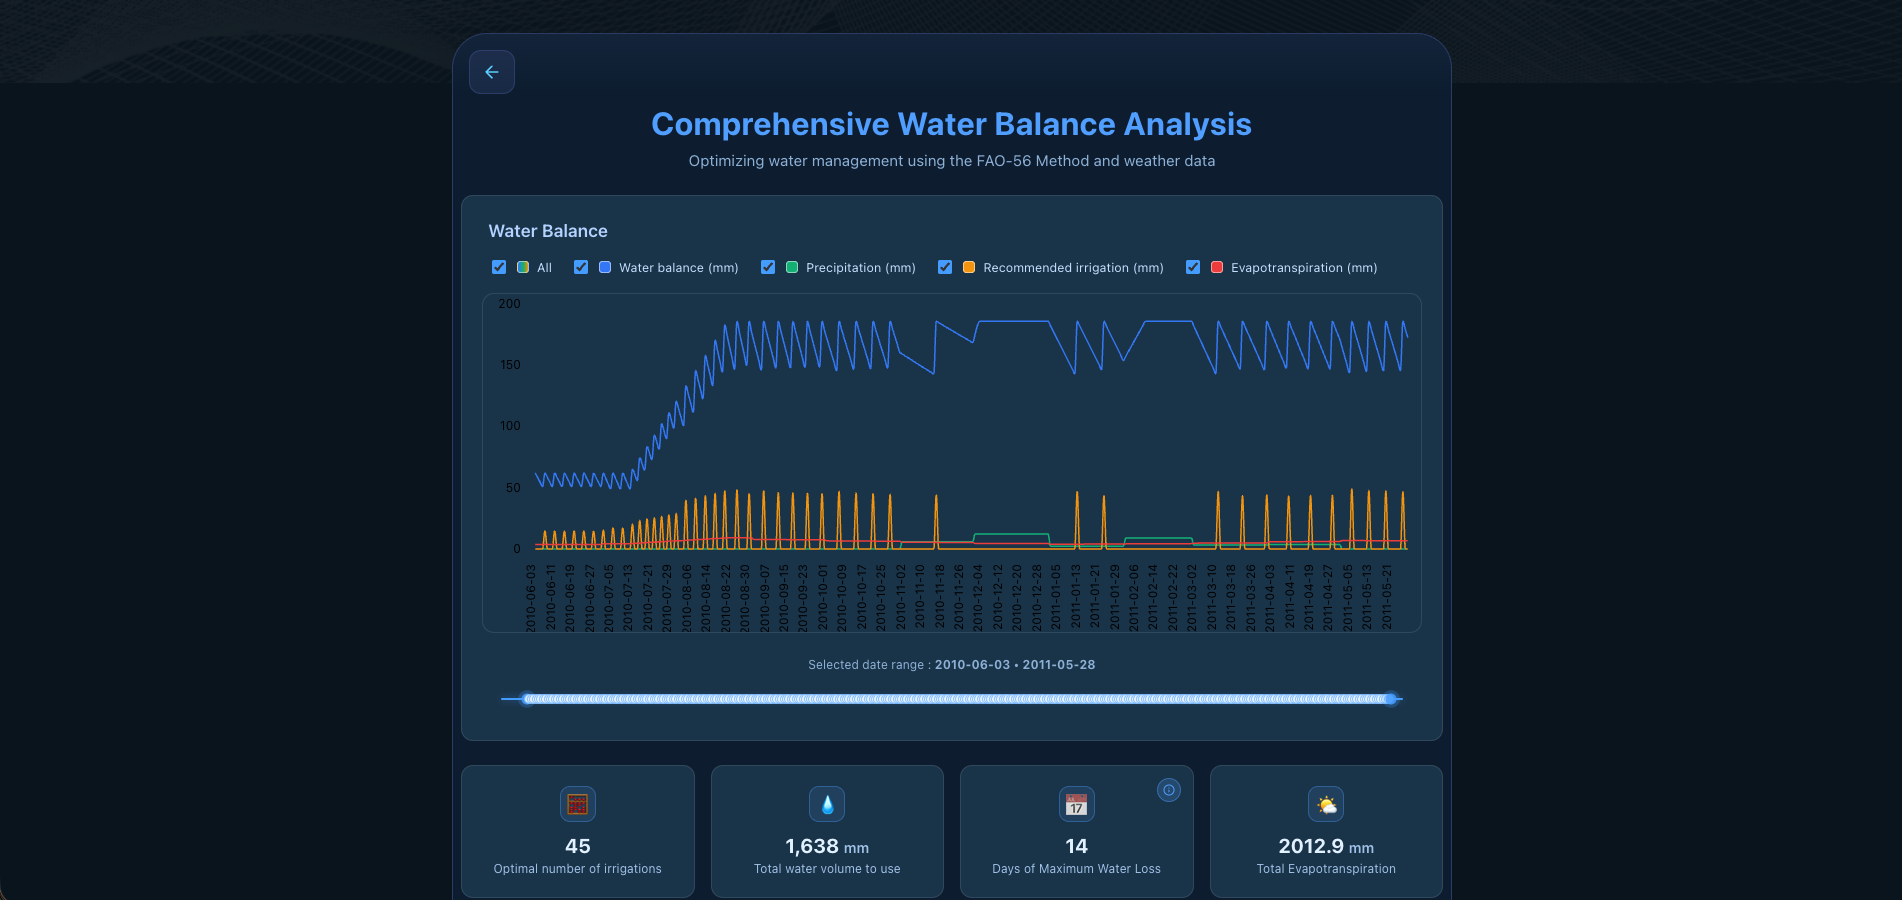
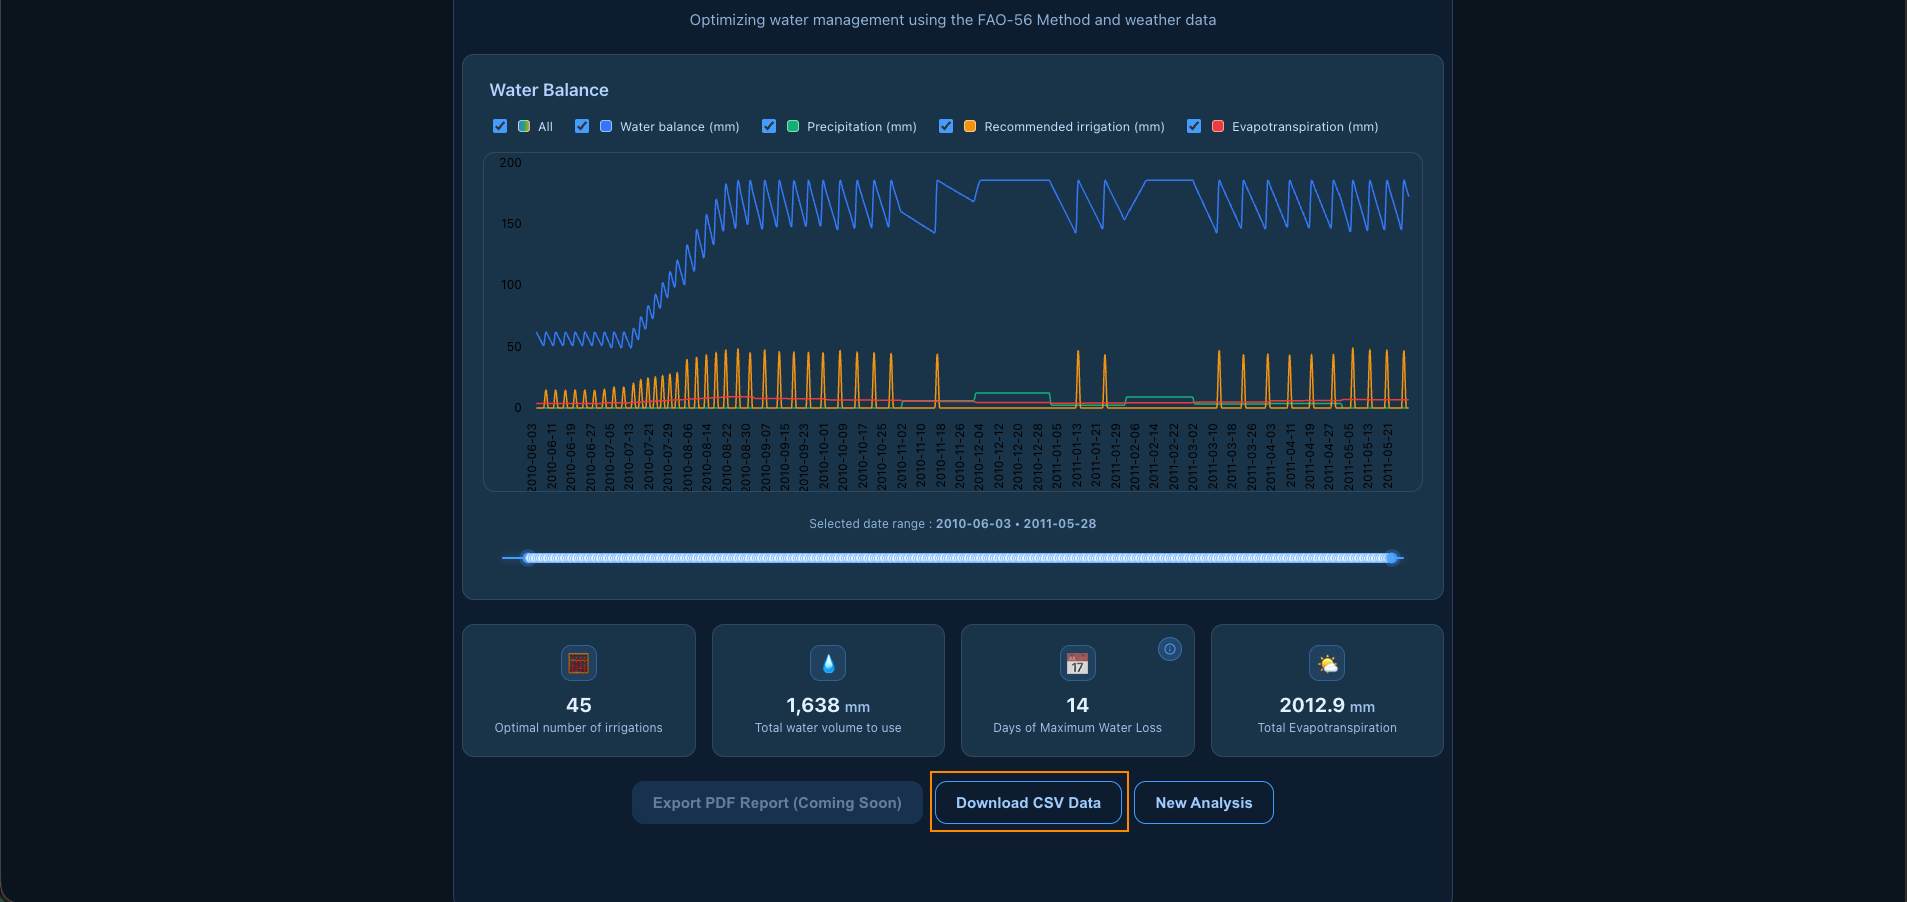
Once the simulation is complete, InHydro displays interactive graphs visualizing key water dynamics over time.
The main output is the water balance curve, showing the evolution of net water depth throughout the crop cycle. This allows users to identify periods of water surplus or deficit.
Displayed variables include:
Precipitation (daily rainfall)
Evapotranspiration (crop water demand)
Irrigation (recommended irrigation volumes)