Data visualisation and analytics
Insula Perception stands out for its visualisation and analytics capabilities, transforming complex data into clear and actionable insights. It offers a suite of features, including:
Shared visualization: Collaborate effectively with your team or other organisations by leveraging pre-built visualizations.
Customizable views: Tailor your views to suit your needs. Highlight the metrics that matter most to gain a focused view of your data.
This guide provides you with the knowledge to utilize Insula Perception’s most common features. However, the platform’s true power lies in its adaptability.
Ready to take your data analysis to the next level?
Our support team is here to help you unlock the full potential of Insula Perception for your unique use case. Don’t hesitate to reach out to us at https://platform.destine.eu/support.
Catalog results
As a user, you can visualise results from the Catalog’s searches, depending on the nature of the data. When the data is suitable for visualisation, a button Add to map appears within the related card:
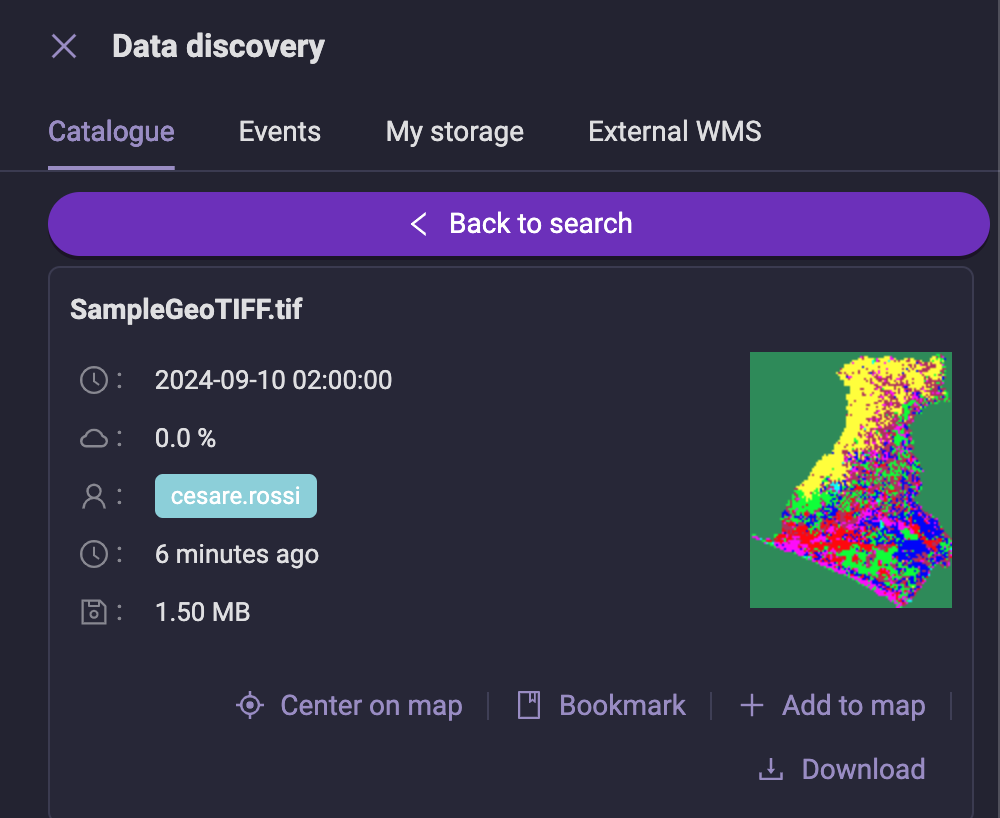
A visualisation is also called a Layer, as it is shown as a layer on top of the map.
To learn more about the tools at your disposal, refer to Tools.
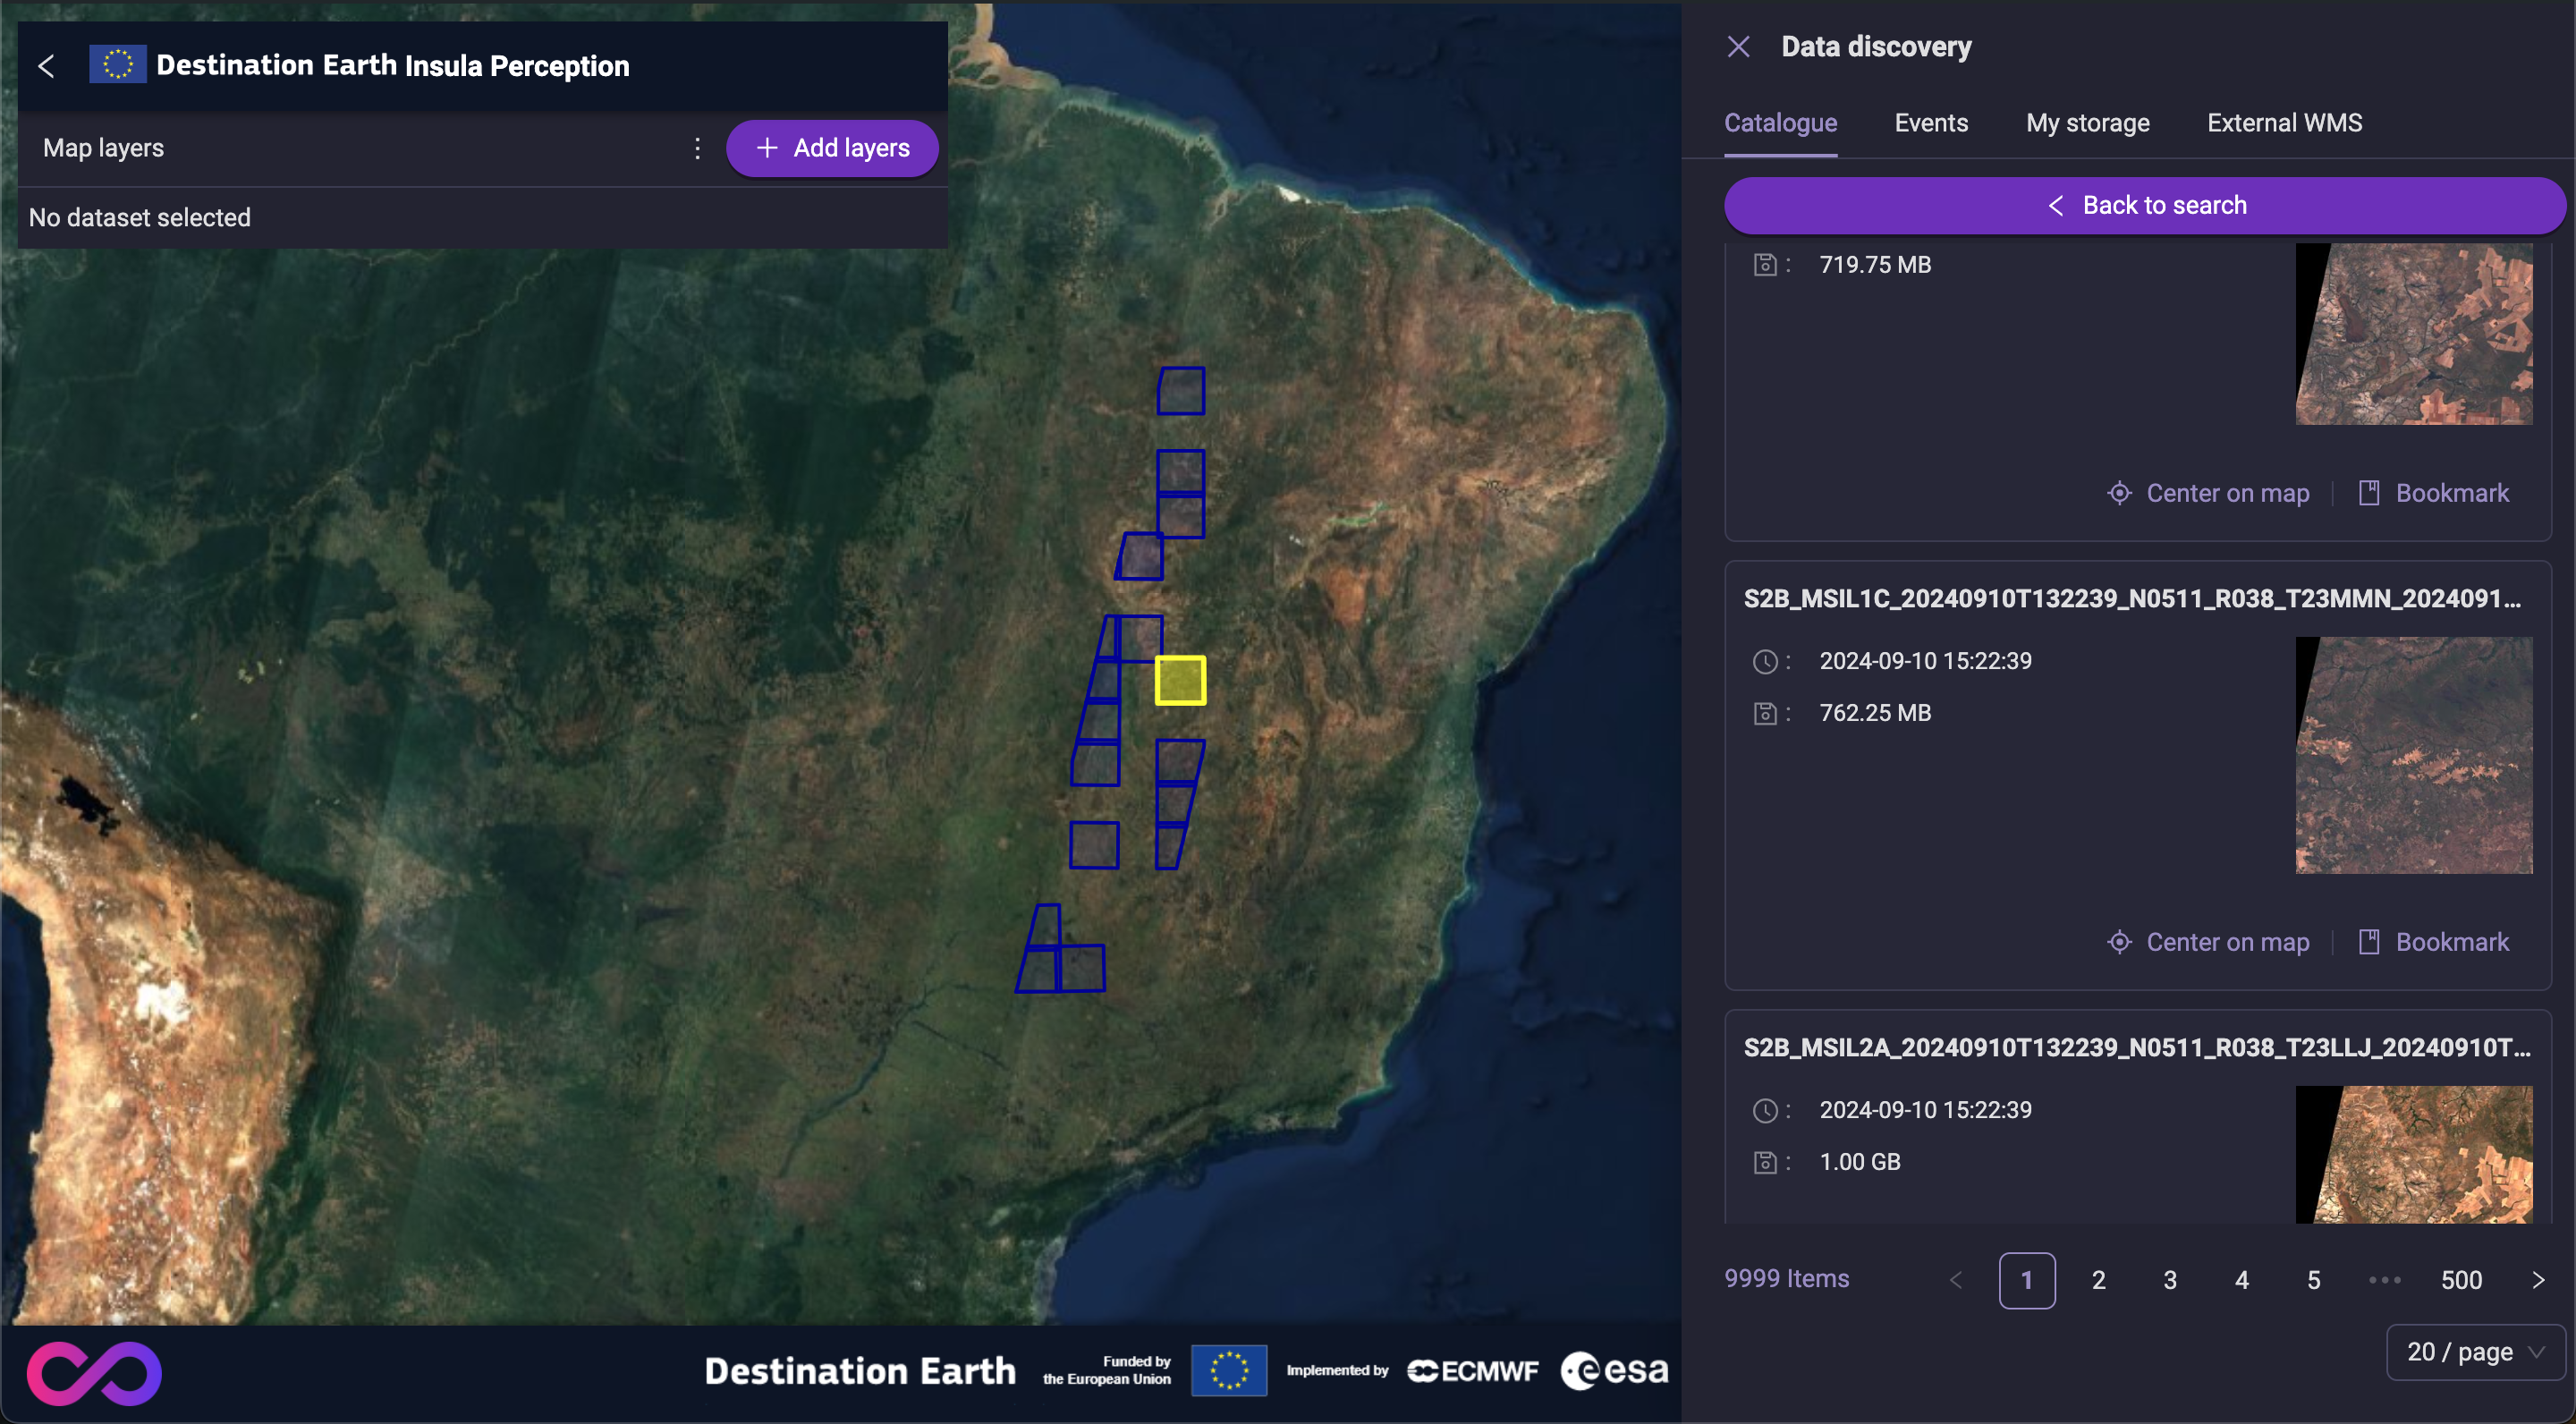
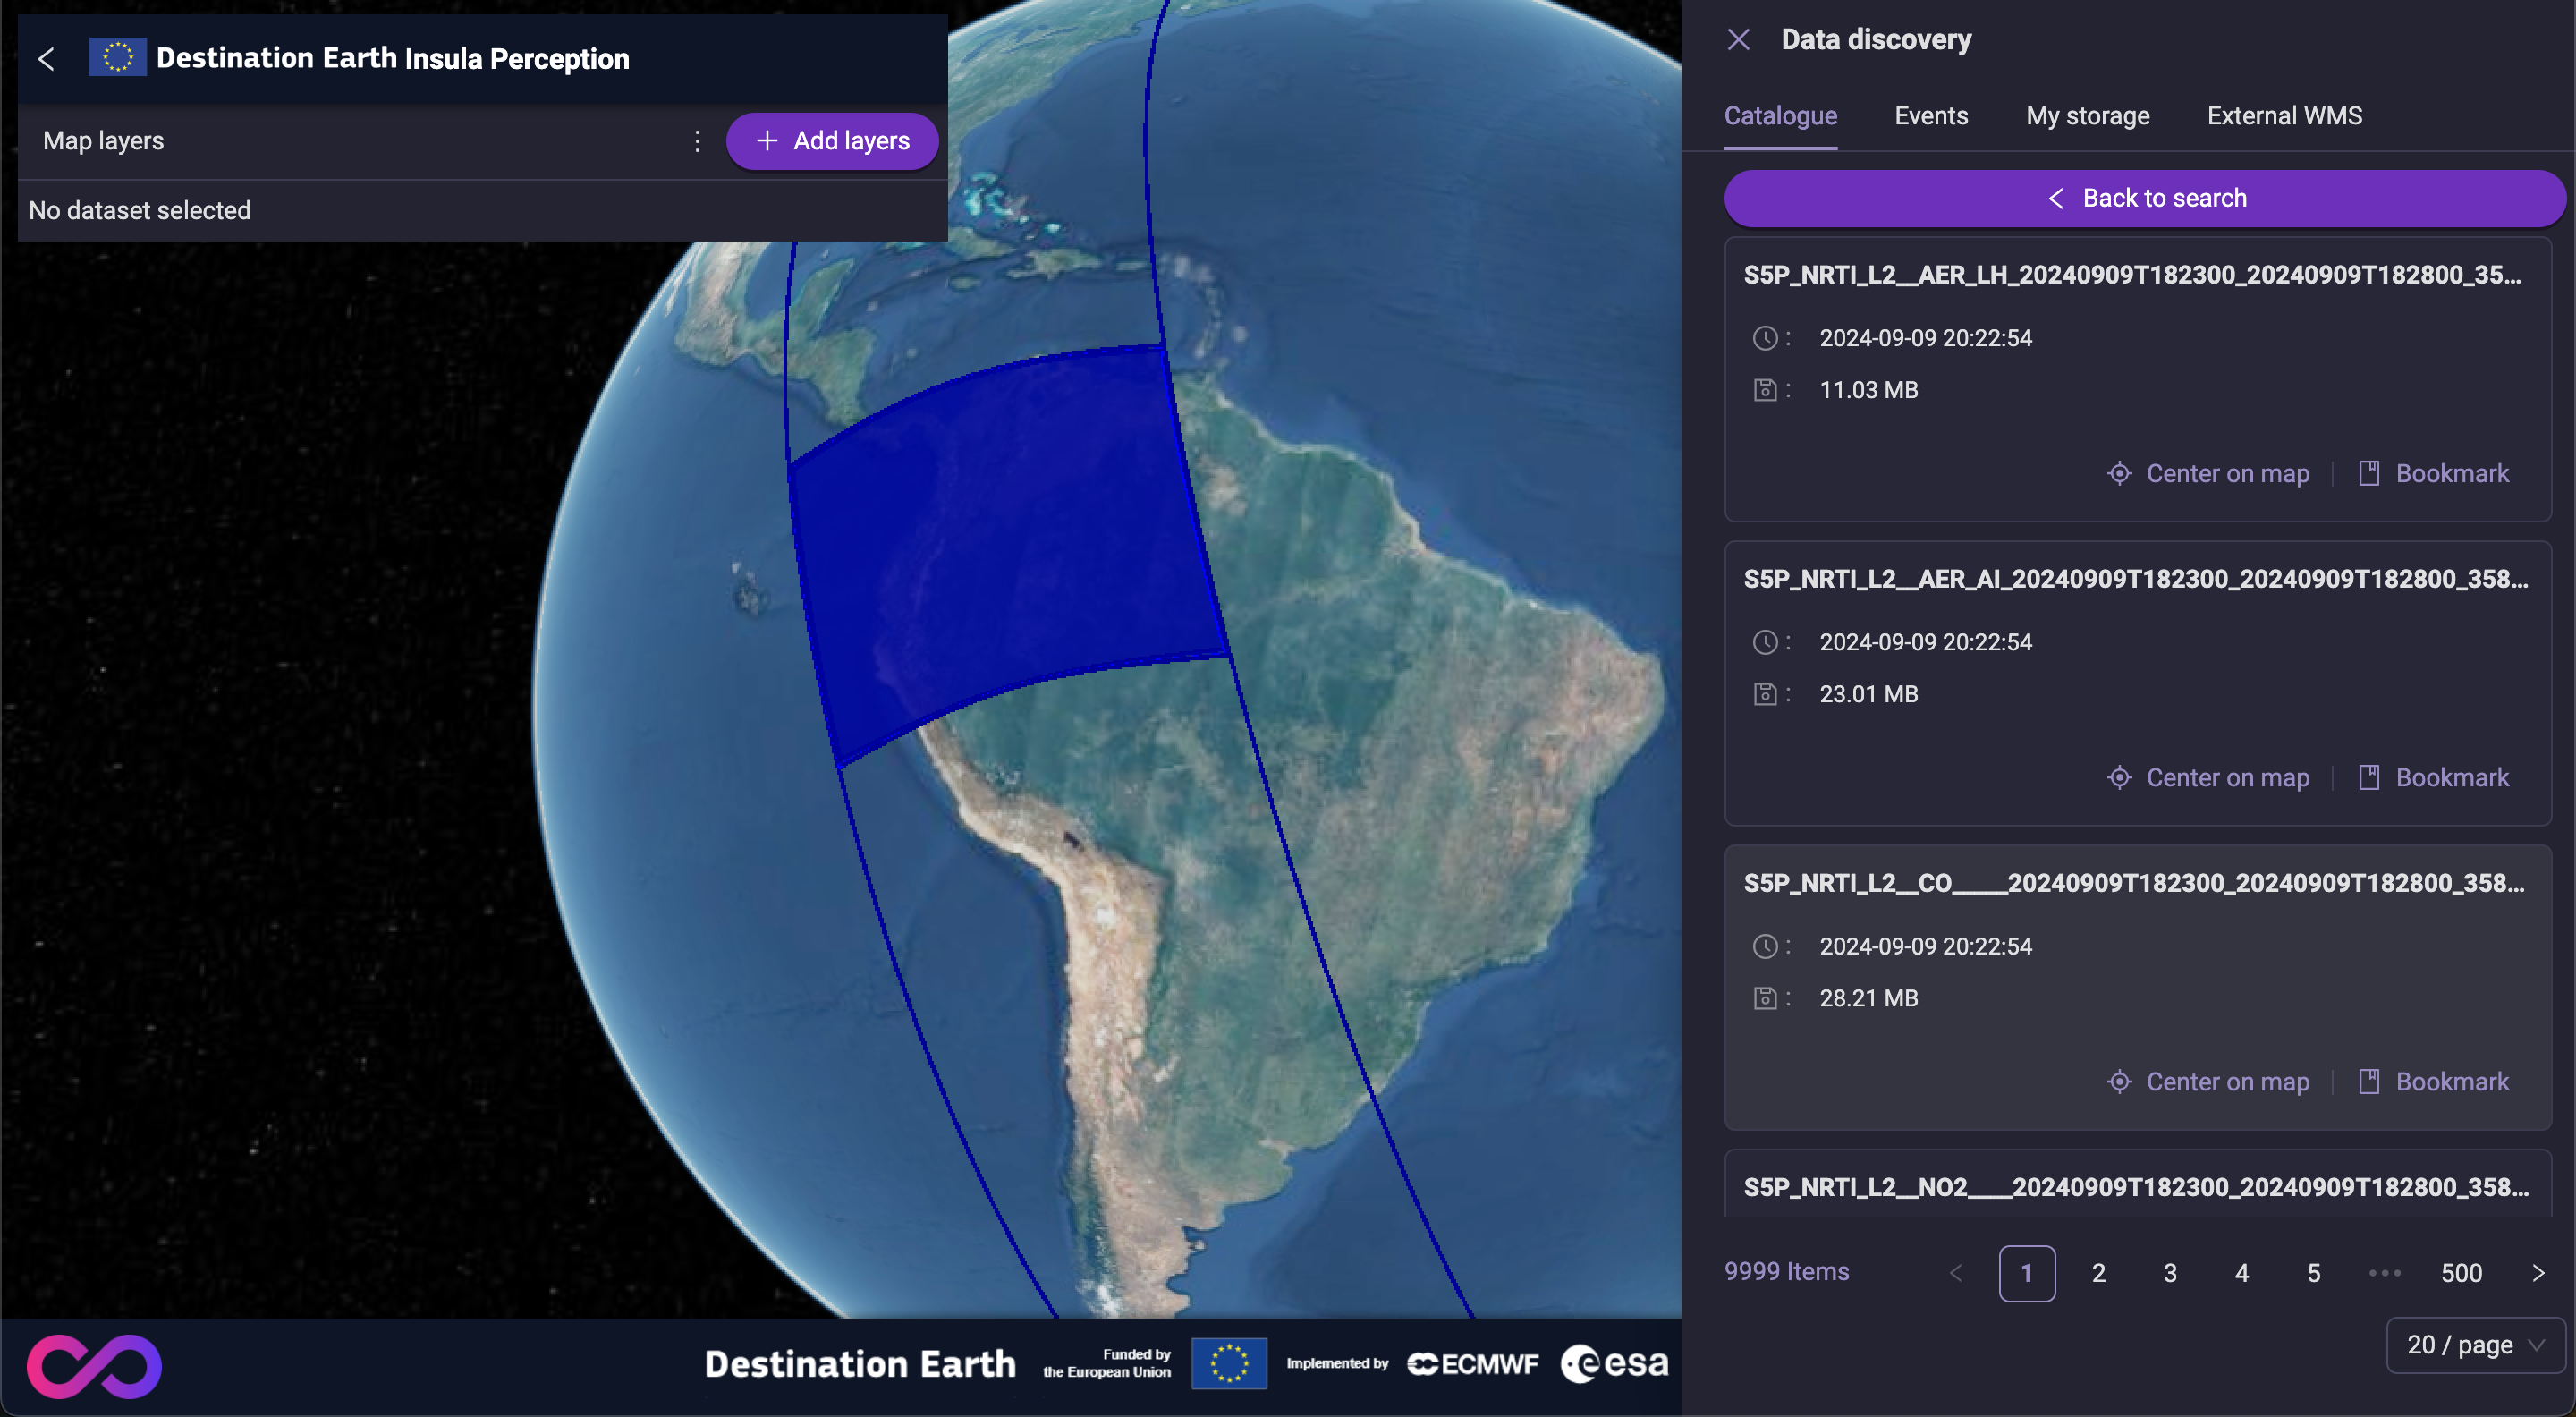
Even when visualizations aren’t available, data can still be geolocated on the map. This functionality, as demonstrated with Copernicus data below, allows for easier exploration and selection of datasets for further processing.
Events
Visualising Event Processing data is coming soon. Stay tuned, more information will come on this topic!
My storage Content
The data stored in My storage can be visualized on the map and analyzed, when appropriate, using the same tools available for Catalog results.
External WMS
External WMS layers can also be displayed on the map. While some interactive tools, like the Swipe, are supported, the full range of features may not be available for all WMS services.
Tools
Visualisation
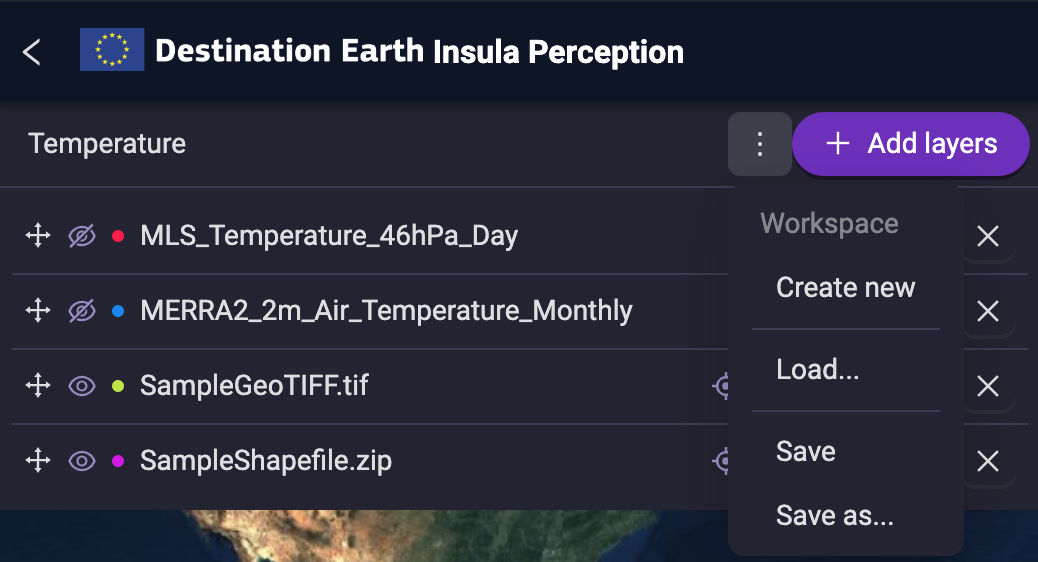
Workspace
The Add to map button provides a convenient way to incorporate enabled layers into your current workspace. By clicking this button, you effectively add the selected layer to your ongoing analysis, allowing you to explore and examine its data in conjunction with other map elements. While the addition of the layer to your workspace is not automatically saved, you can easily persist your changes by saving your current project. This feature is especially valuable for those who wish to continue their analysis at a later time, ensuring that their progress is preserved and easily accessible.
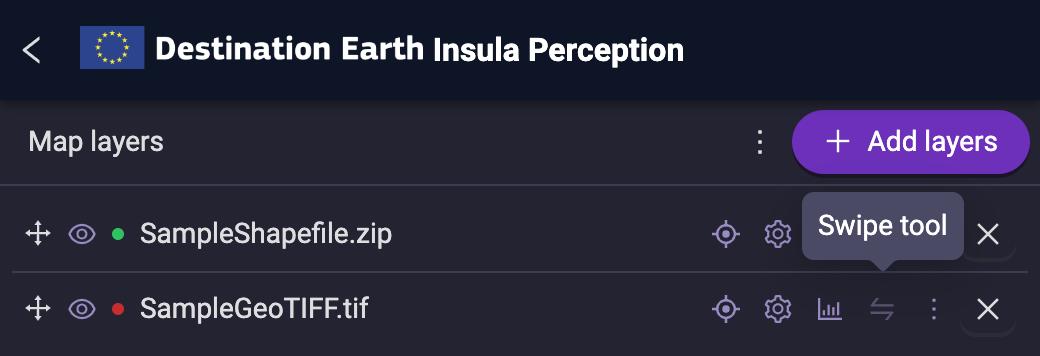
Swipe
The swipe tool enables a side-by-side comparison of multiple visualizations, or layers, on the map. By adjusting the Opacity of one or more layers, you can effectively compare them to a selected layer.
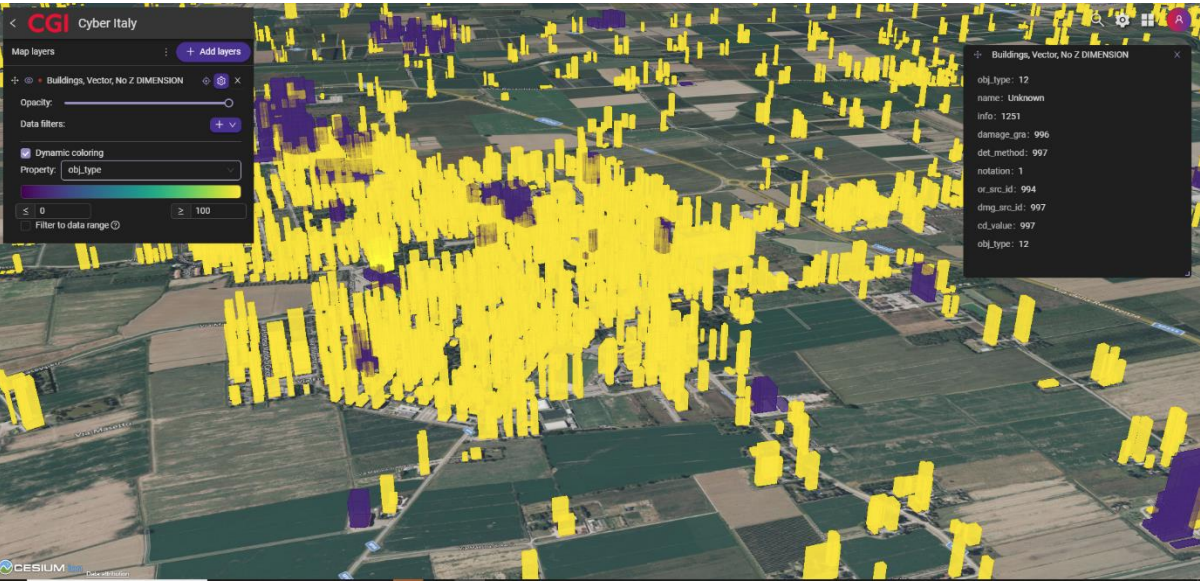
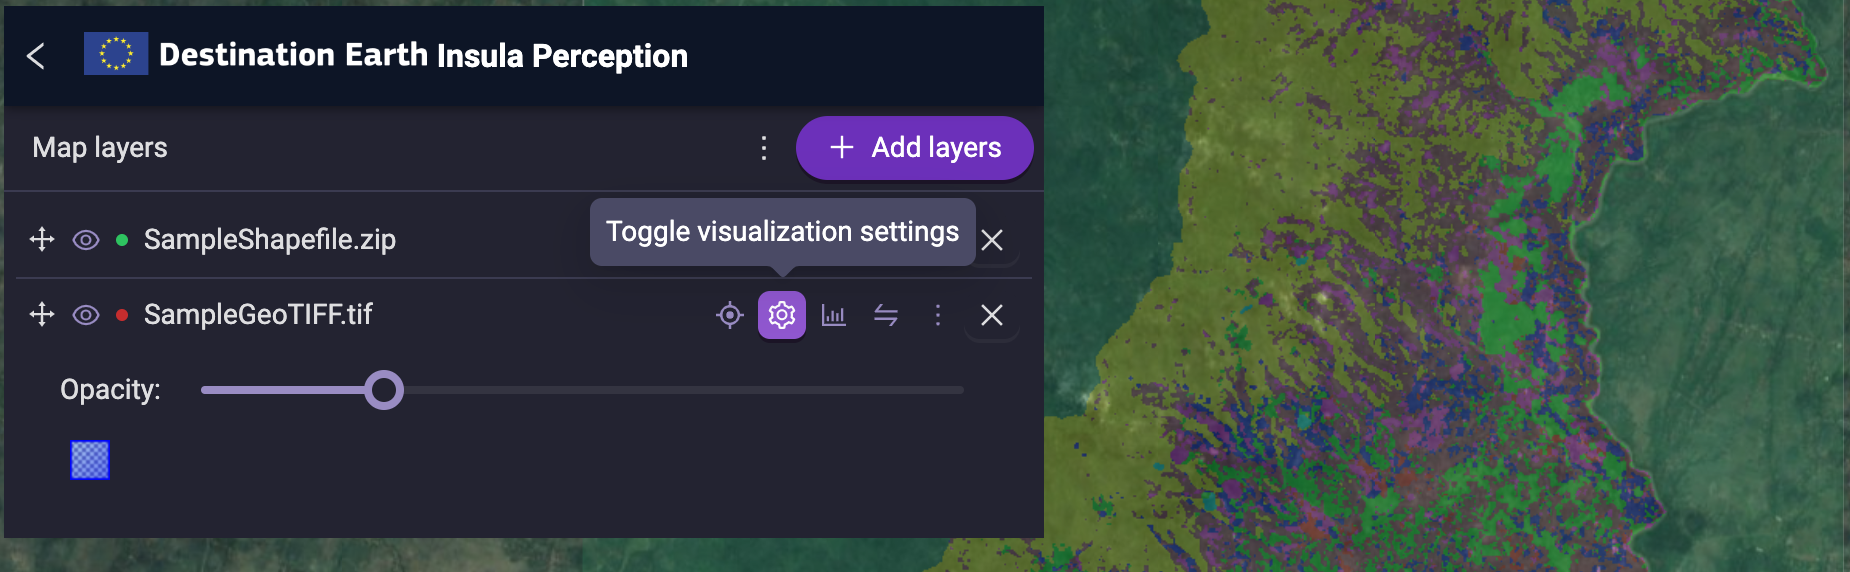
Opacity
The opacity tool enables users to adjust the transparency of each layer added to the map, providing greater control over the visibility and blending of different map elements.
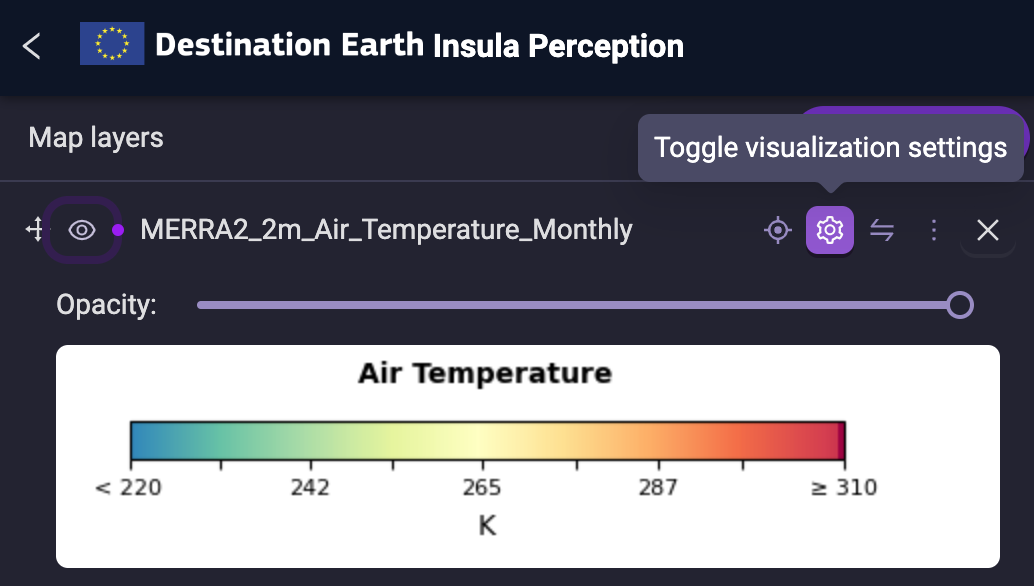
Legend
The legend, when available for the layers, provides context for interpreting the data. It offers additional information, such as color scales, which aid in understanding the meaning and relative values of different features on the map.
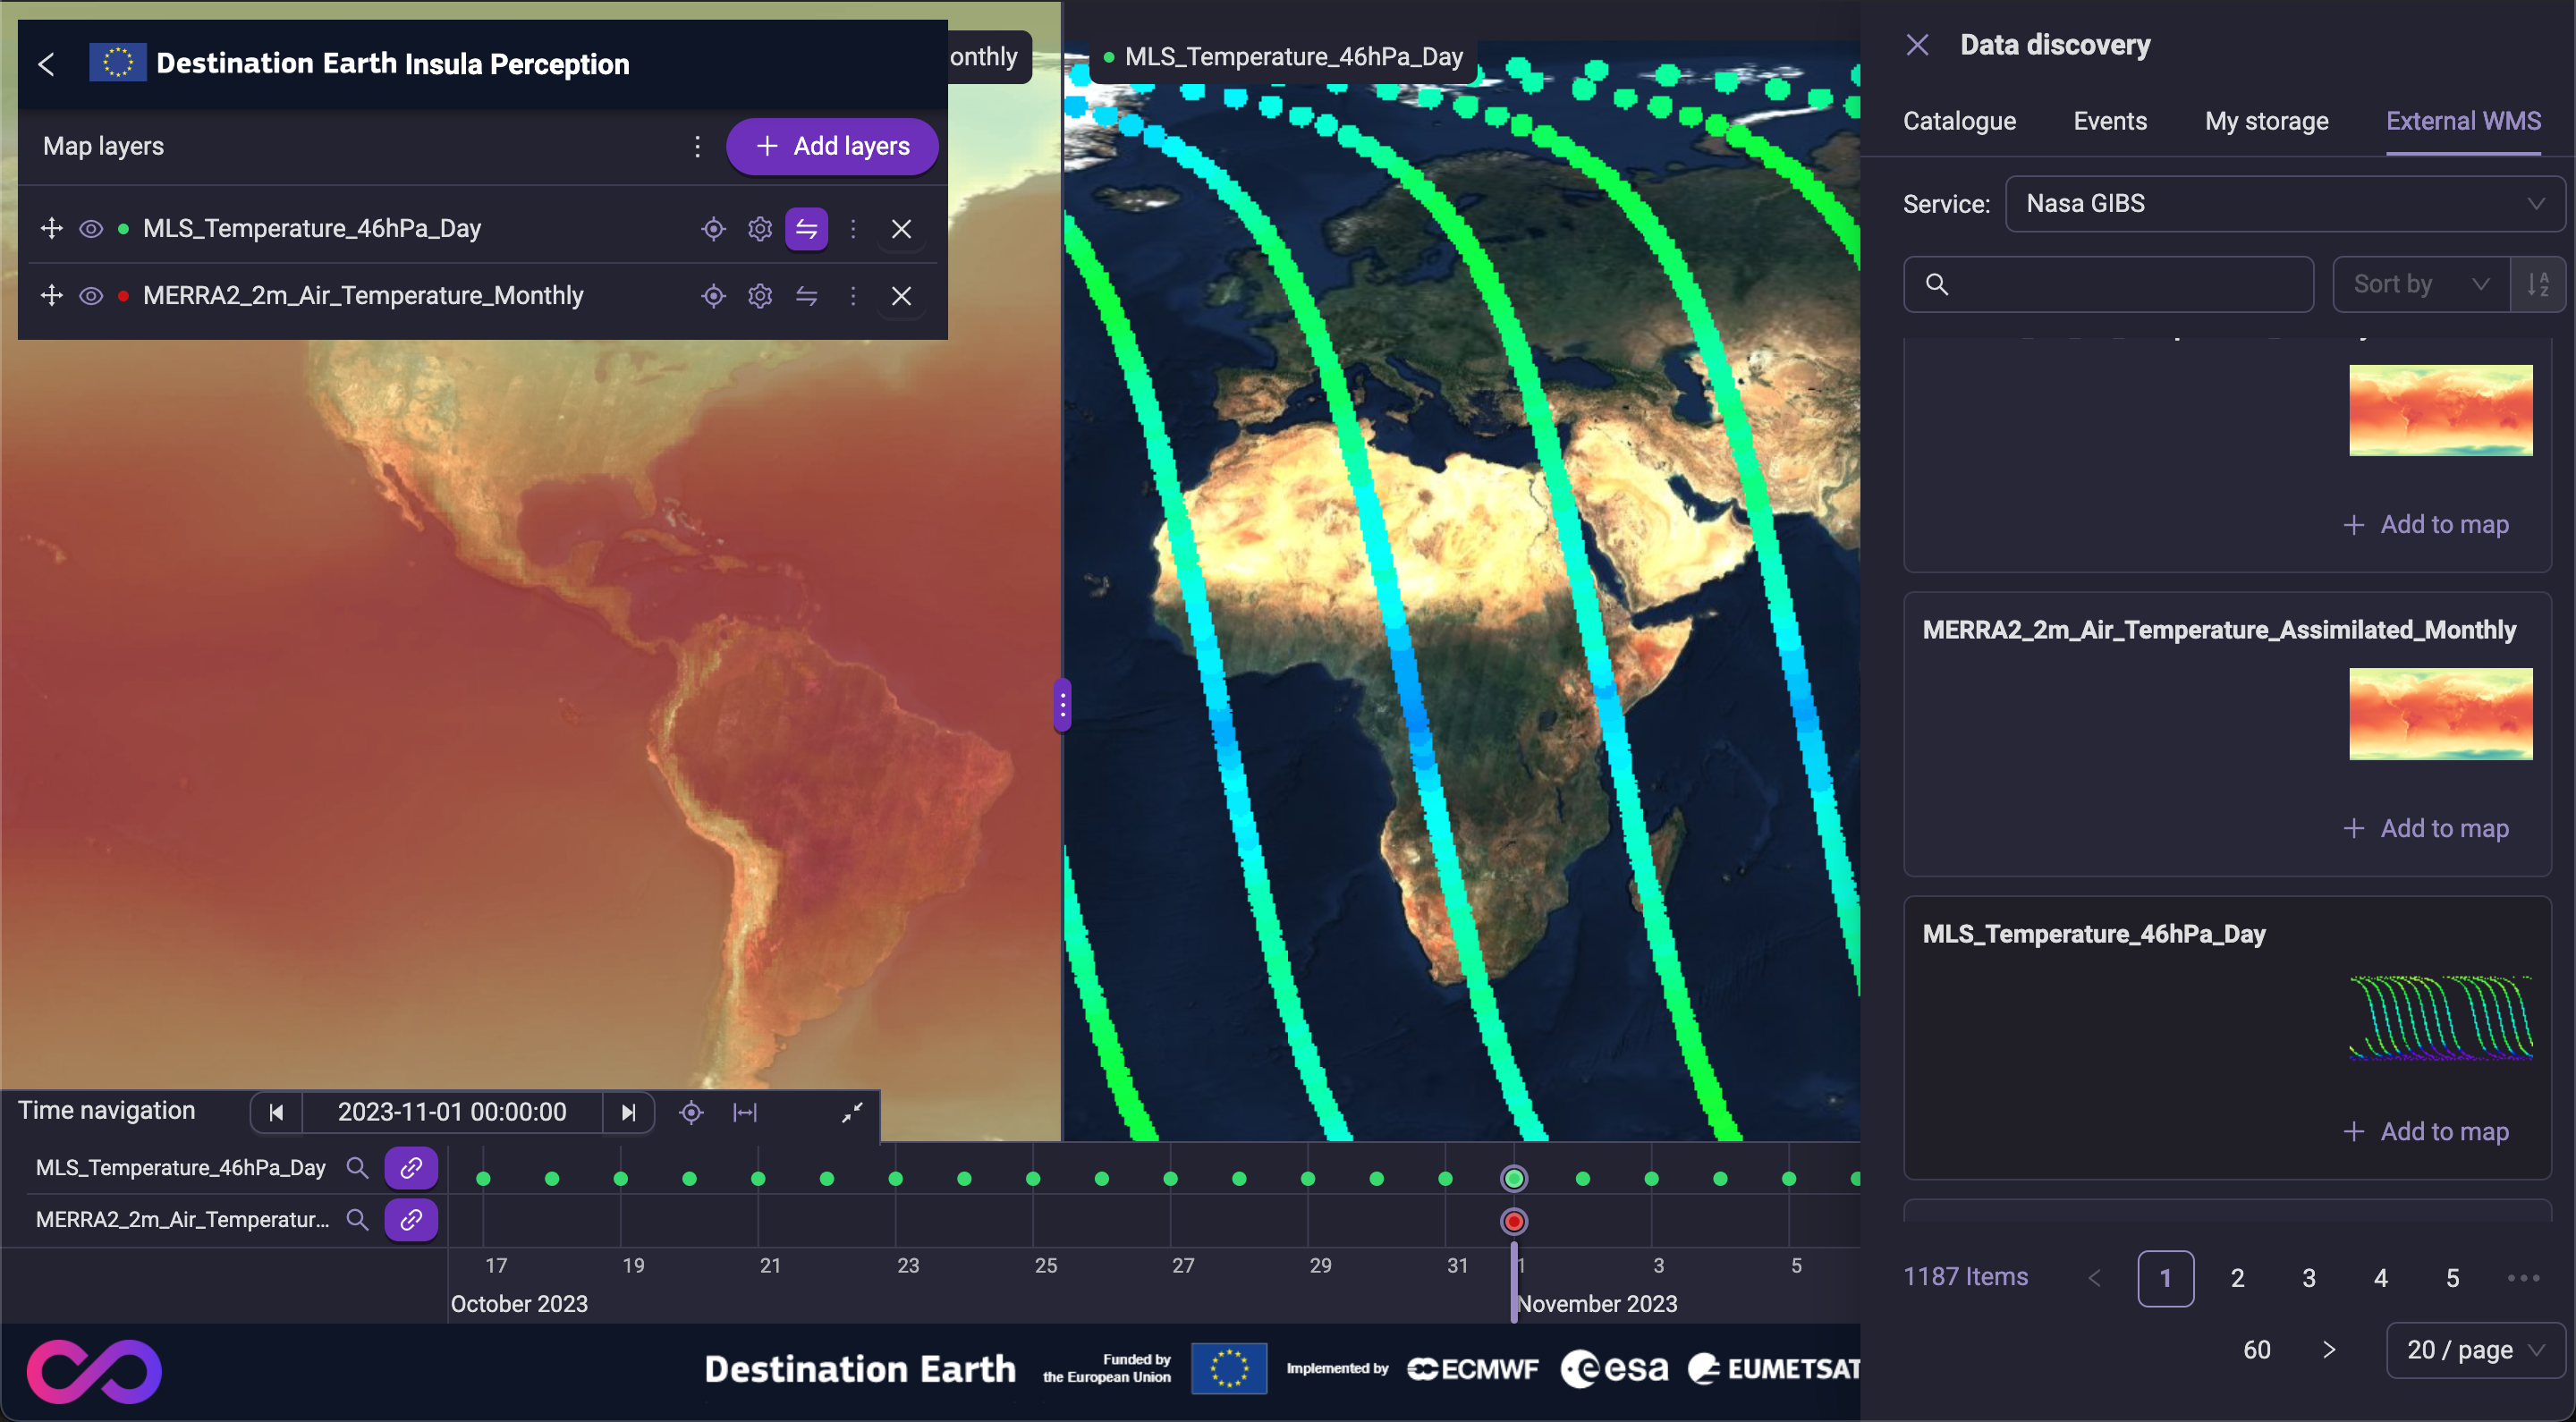
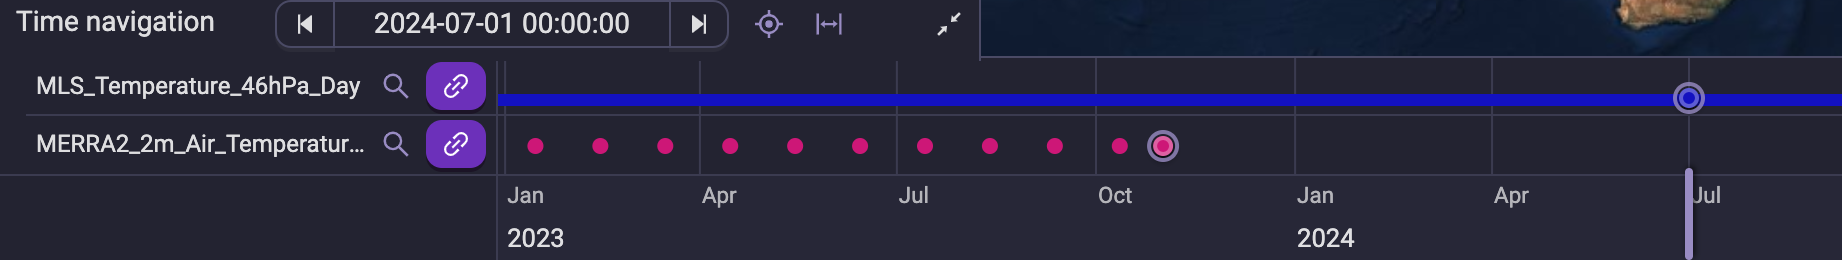
Time navigation
The time navigation tool, located at the bottom of the map for enabled layers like NASA GIBS’s MLS_Temperature_46hPa_Day, allows you to explore data over time. This interactive feature is designed for layers that offer a time series, enabling users to visualize and analyze changes in data values over a specified period.
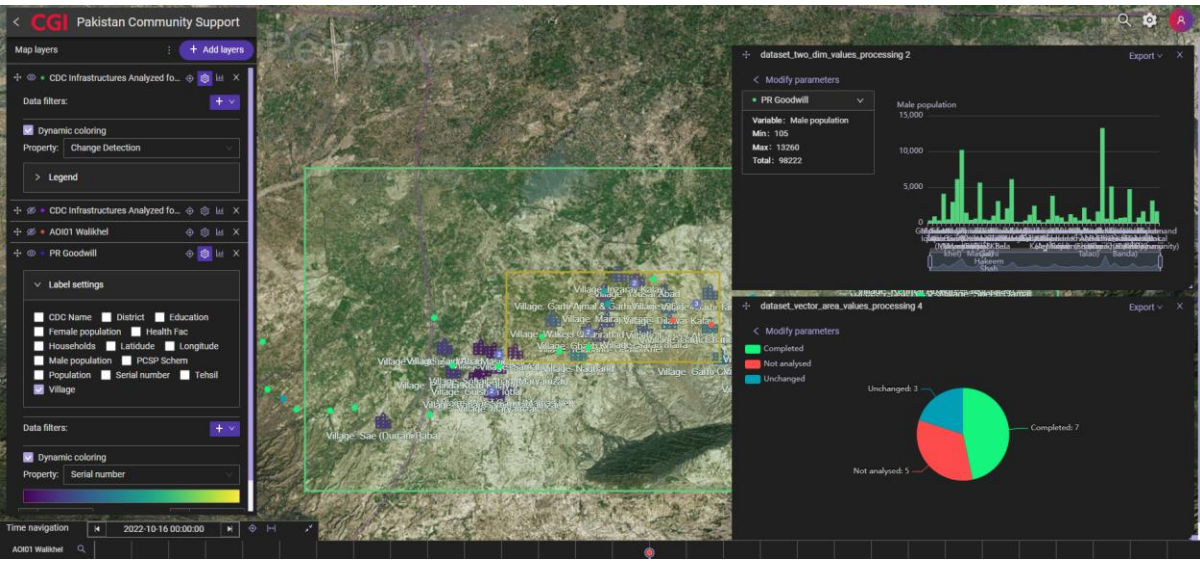
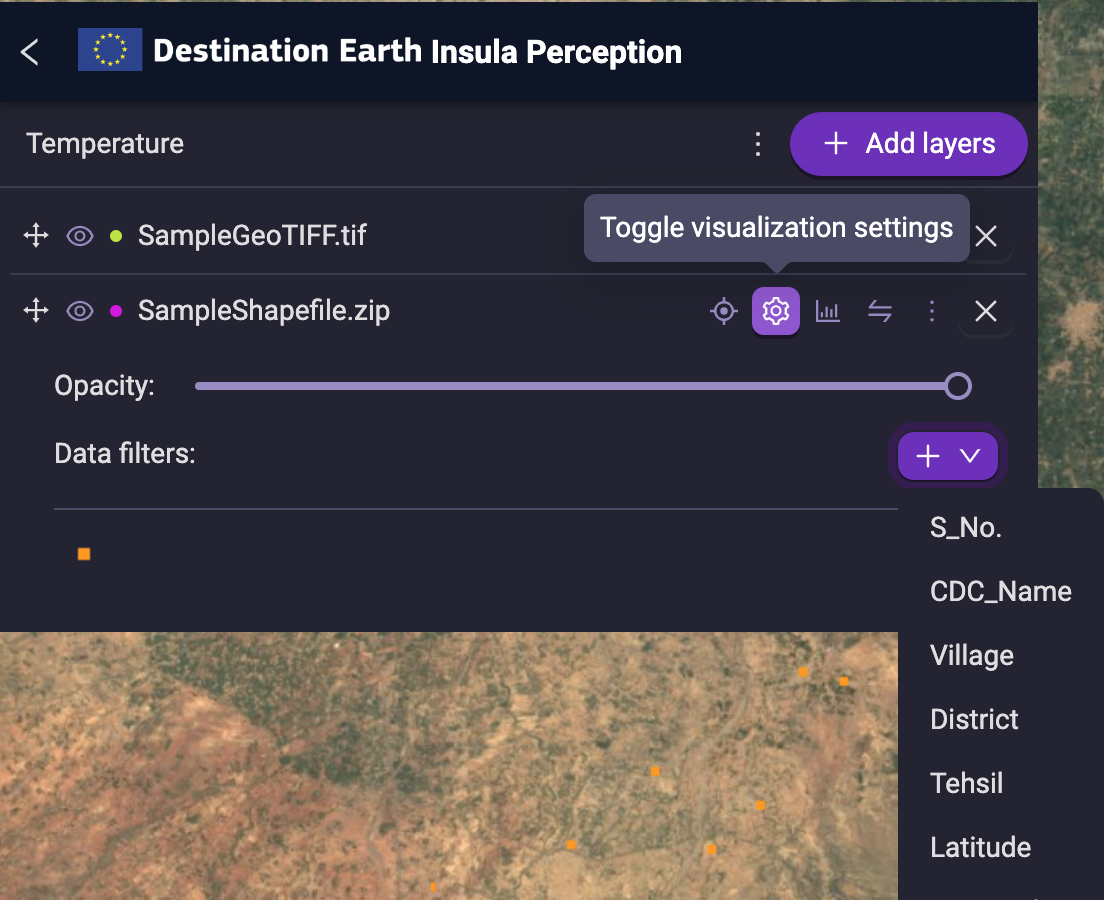
Data filters (vector)
Data filters, available for vector data, provide a tool for refining your analysis and focusing on specific features of interest. By applying filters, you can selectively display data on the map, isolating relevant information and enhancing your understanding of complex datasets.
Analytics
The data analytics tools, accessible through the graph icon for each enabled layer, offer a suite of options tailored to both raster and vector datasets. Explore them in the following sections to discover the analytical capabilities that align with your specific data and research objectives.
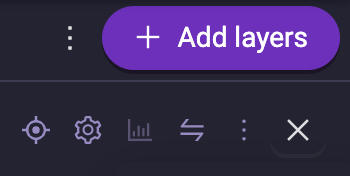
TIP: If you’re having trouble locating data analytics tools, try minimizing the discover panel on the right. The tools might be hidden behind it!
Point series (raster)
This feature is coming soon. Stay tuned, more information will come on this topic!
Transect values (raster)
This feature is coming soon. Stay tuned, more information will come on this topic!
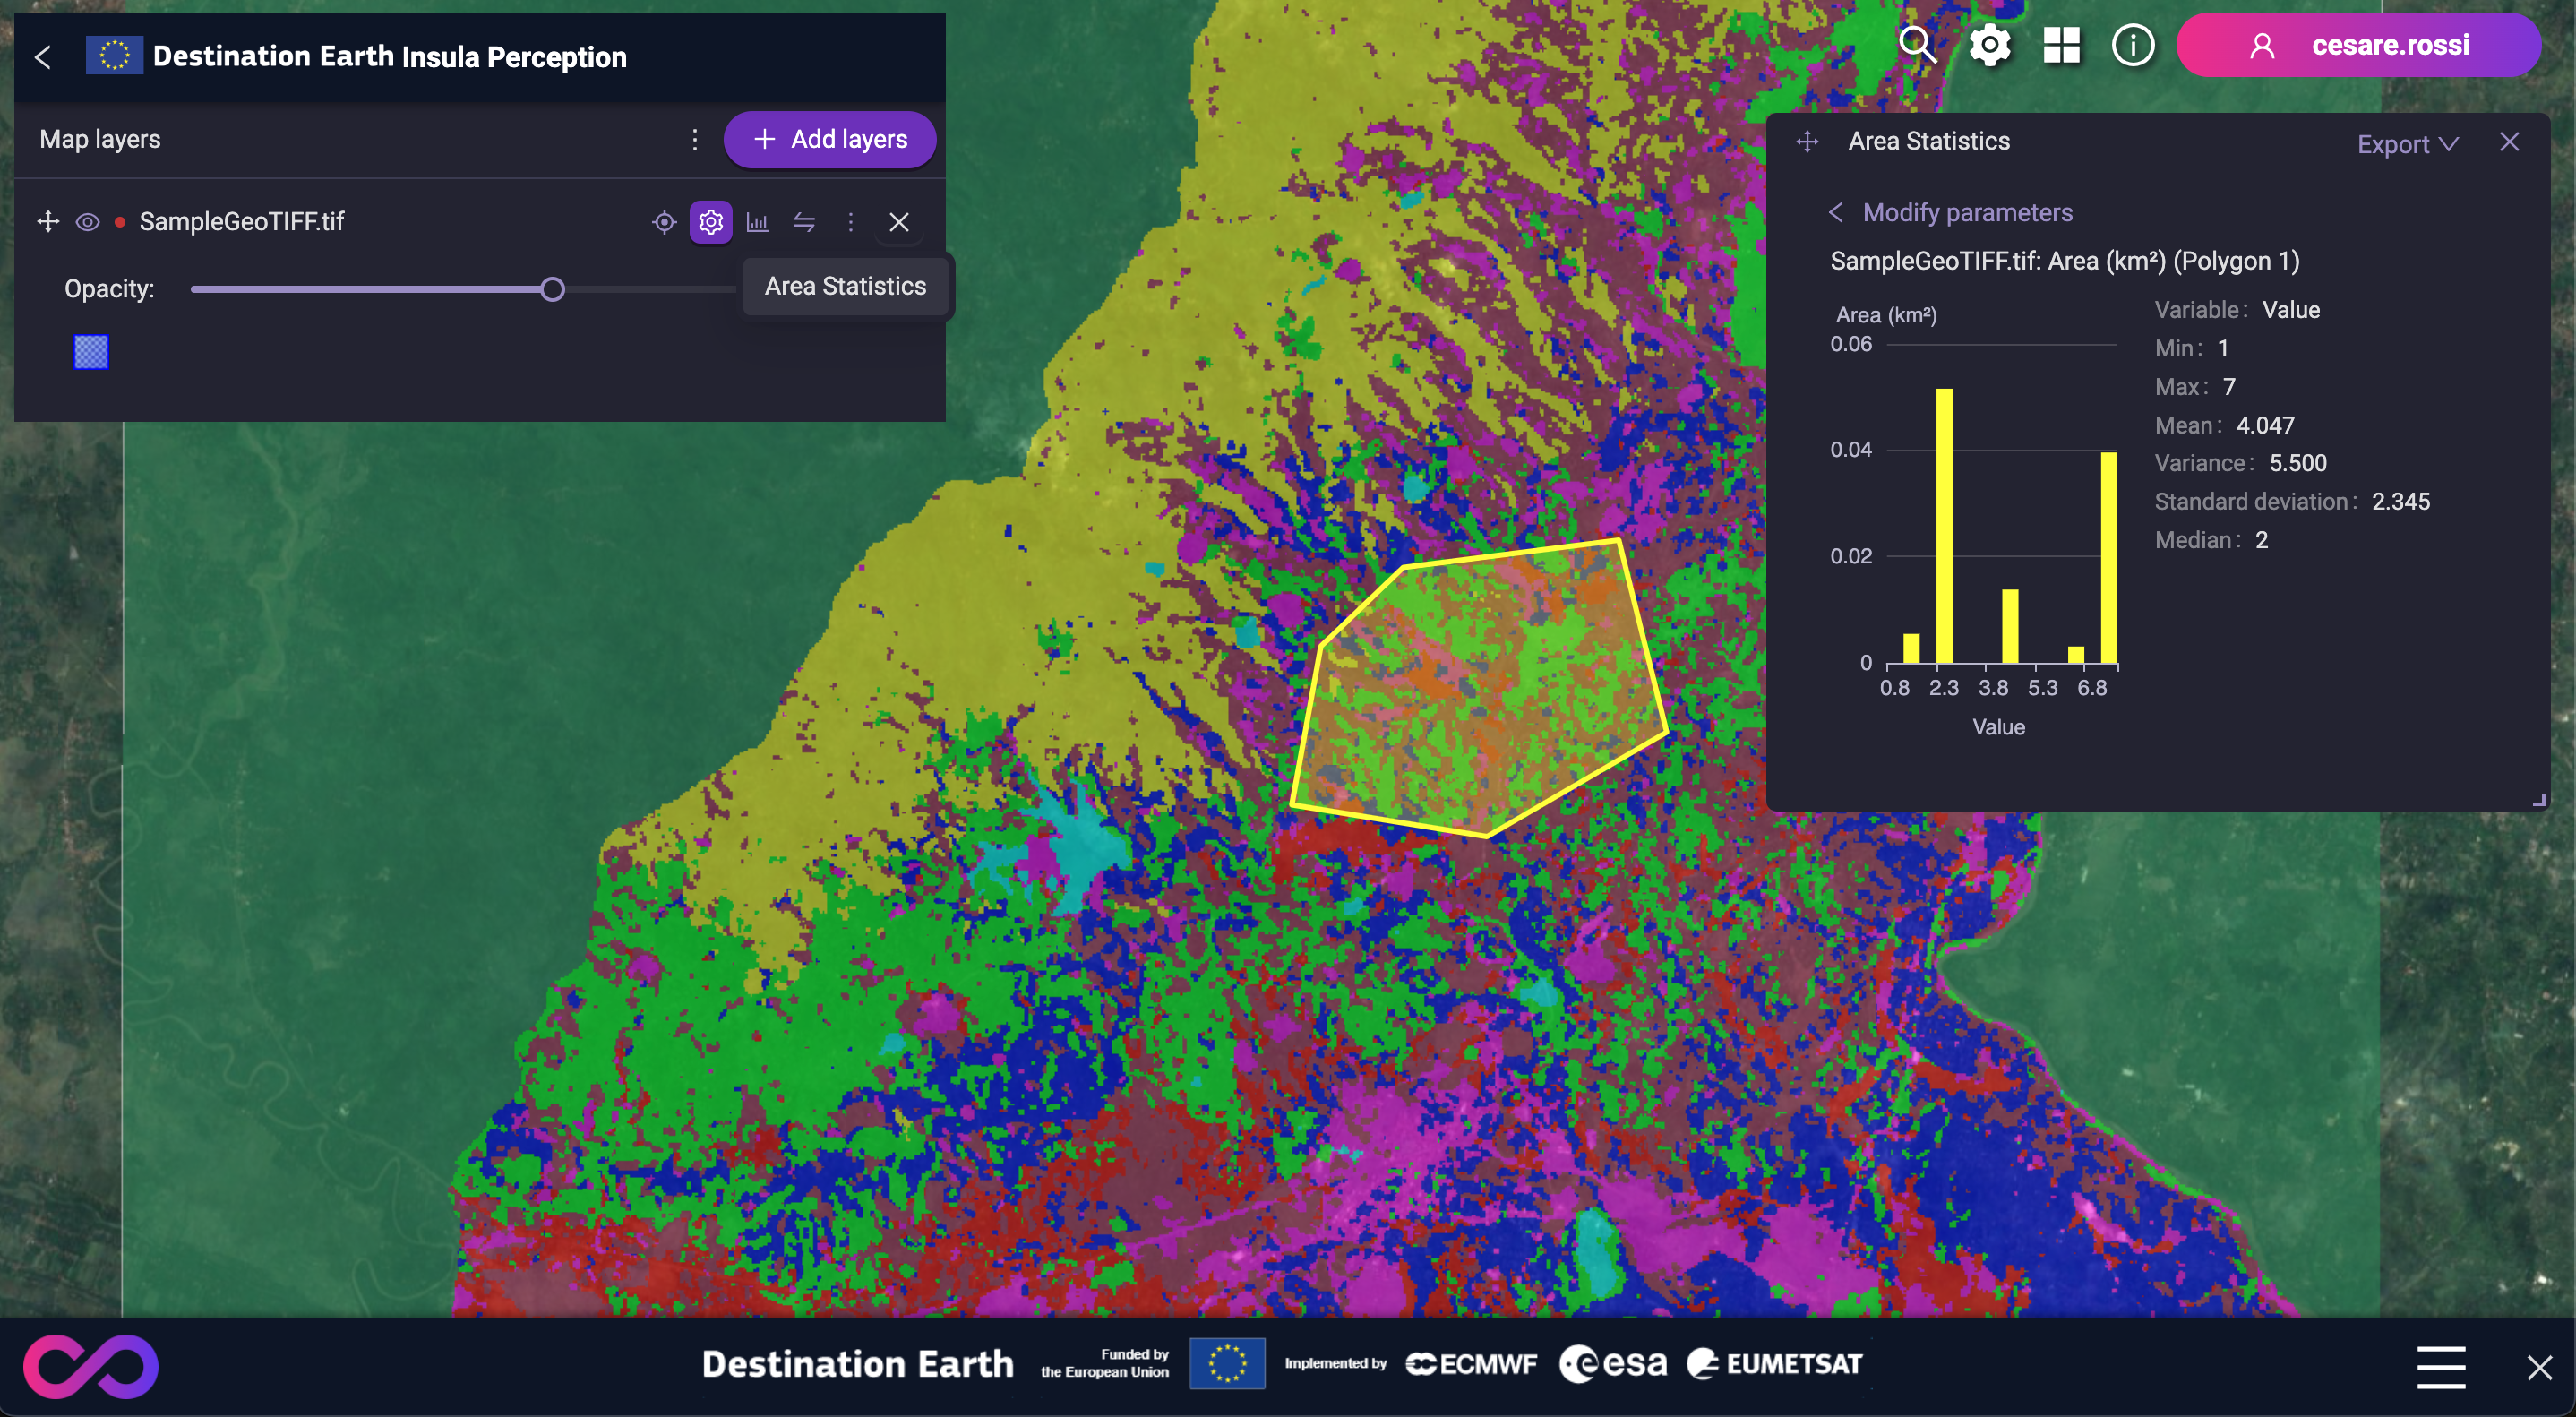
Area statistics (raster)
Area statistics calculates key metrics like minimum, maximum, variance, standard deviation, and median for a variable within a defined area. An accompanying histogram visually represents the data’s distribution.
Area series (raster)
This feature is coming soon. Stay tuned, more information will come on this topic!
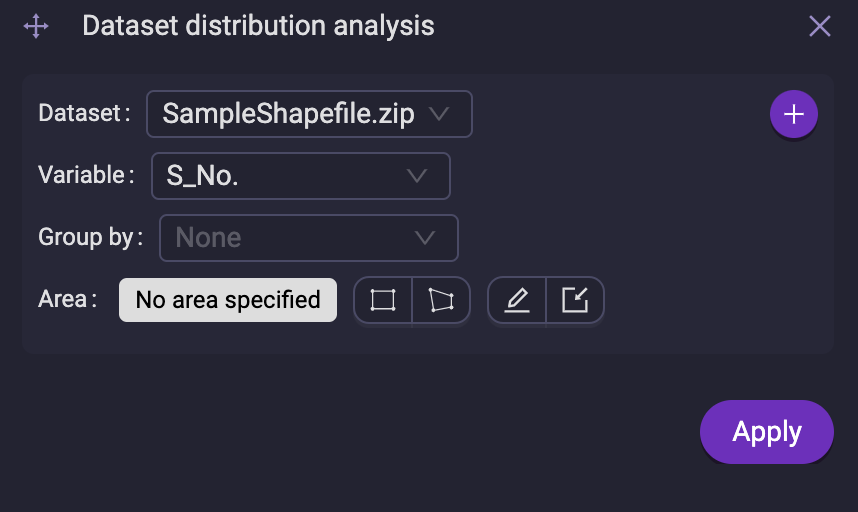
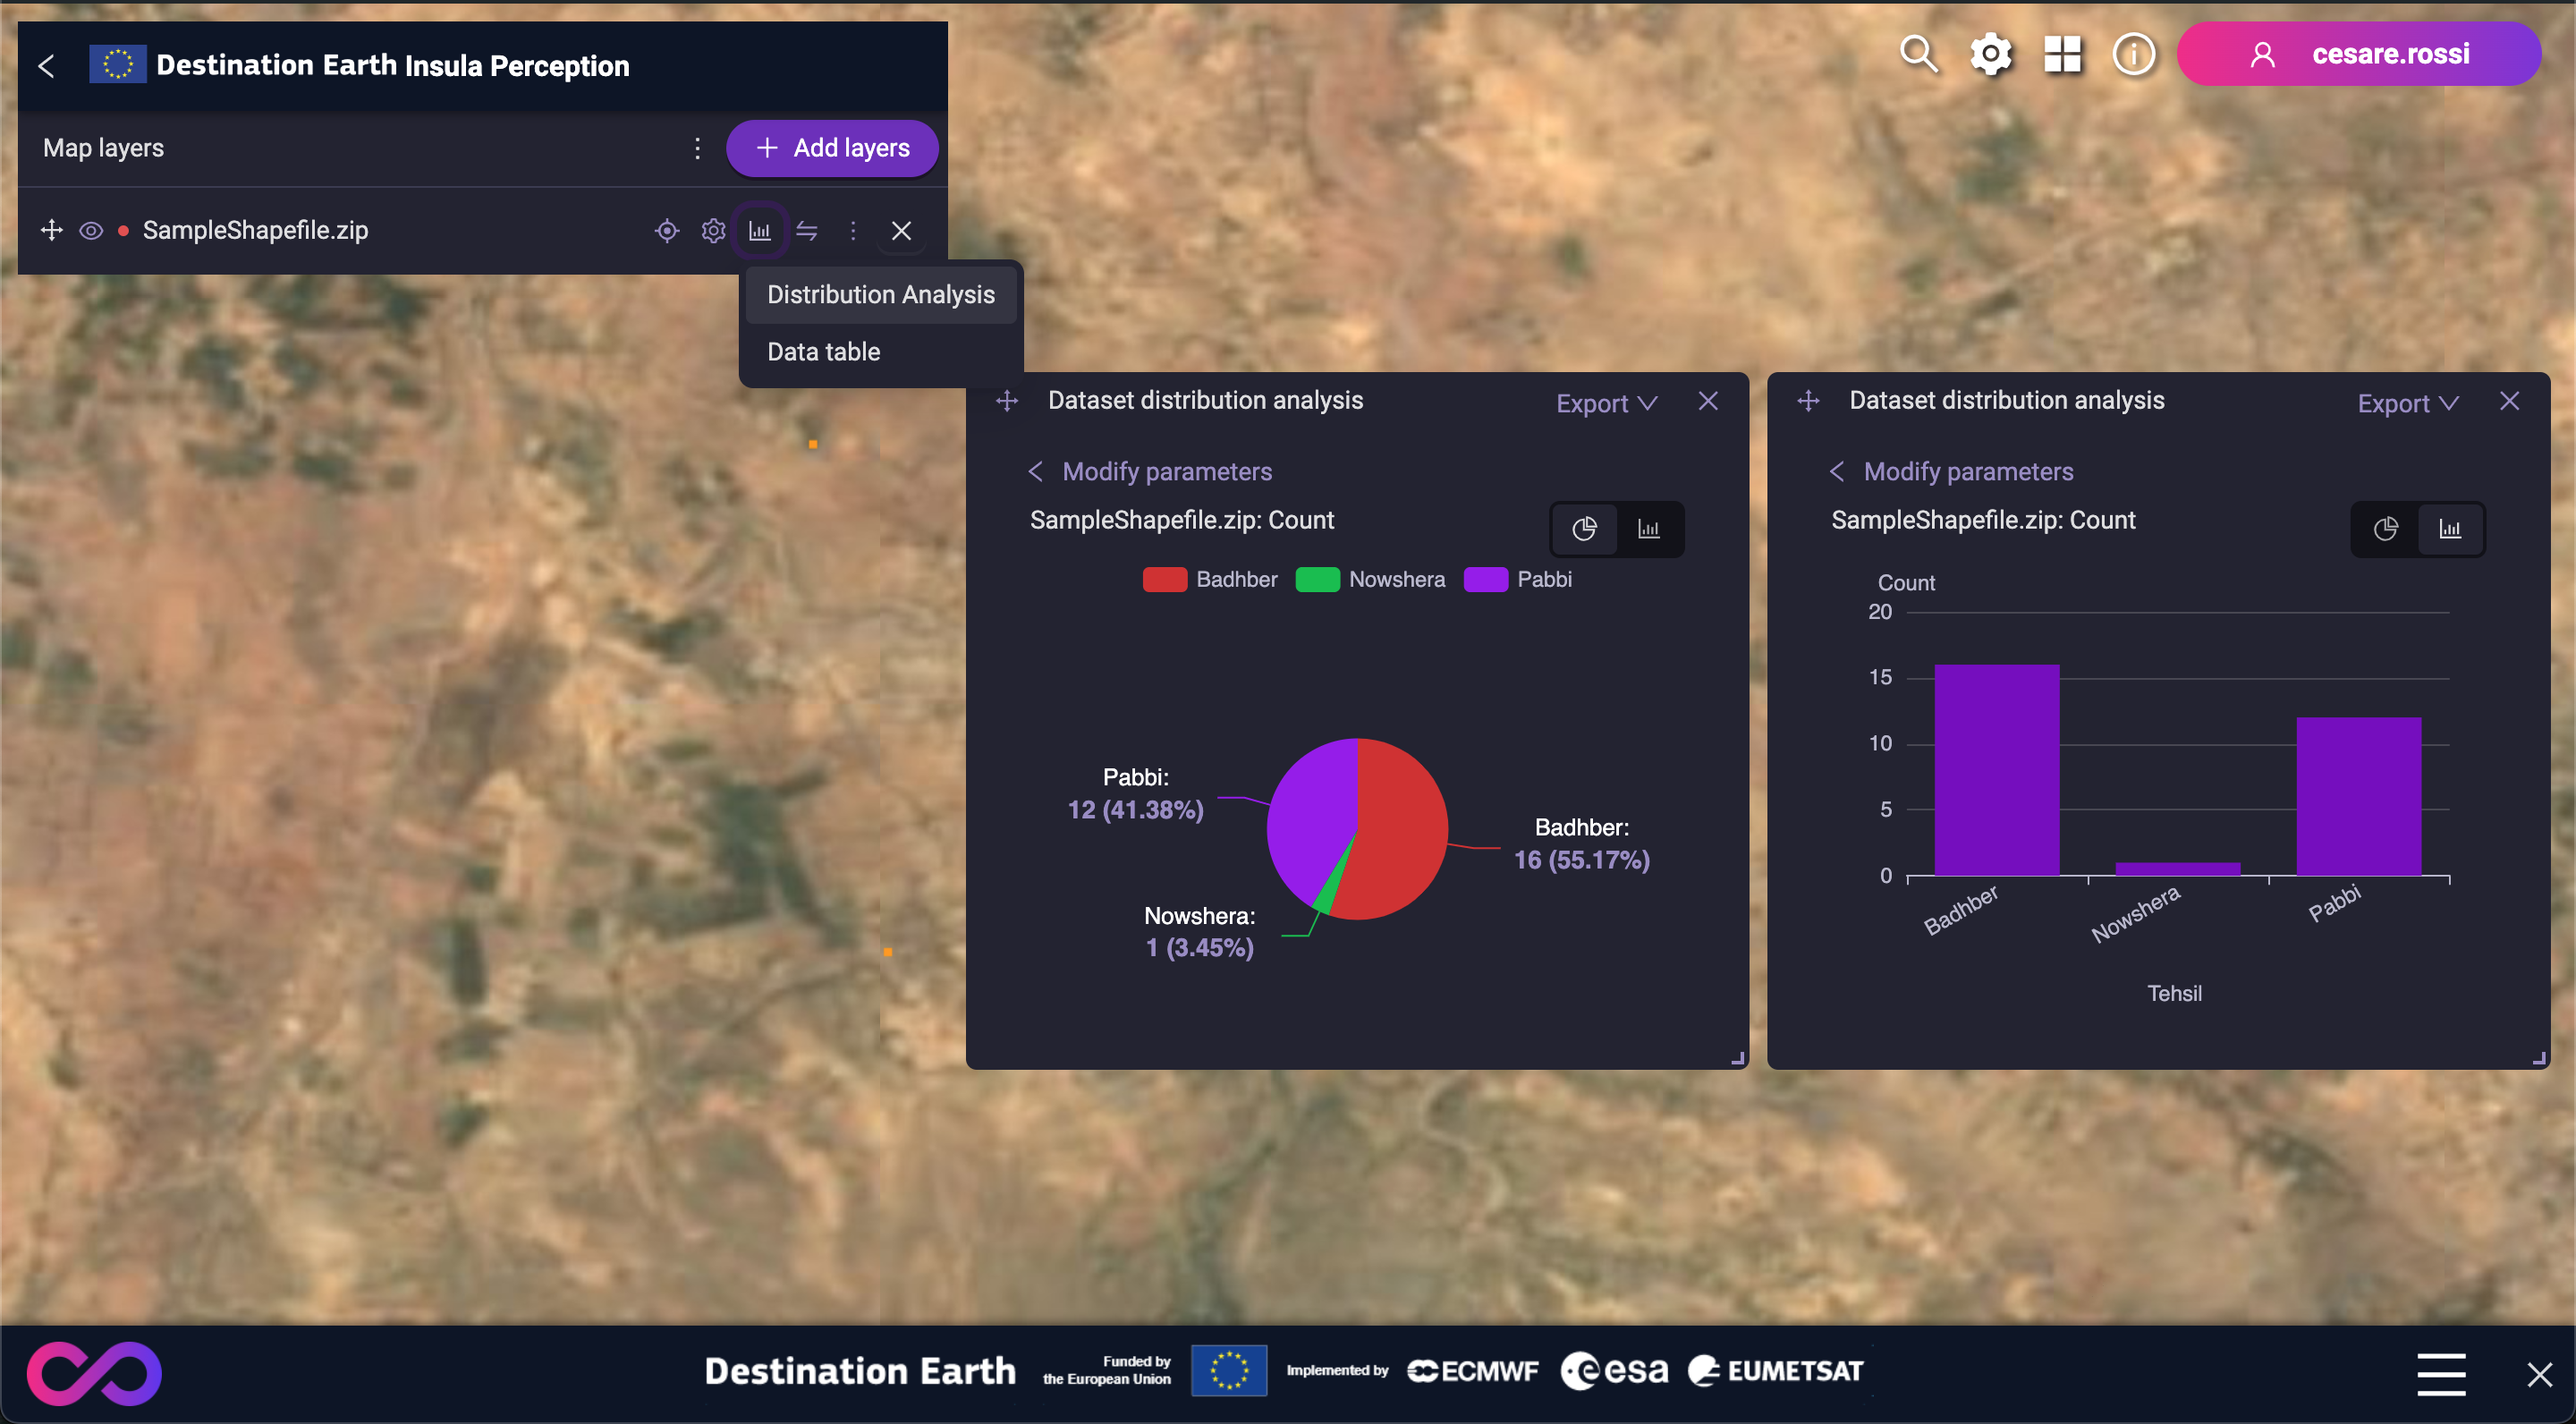
Distribution analysis (vector)
The data distribution analysis tools enable you to examine how data is distributed within a vector product. You can select specific variables to analyze and group the results by another variable.
Time distribution (vector)
This feature is coming soon. Stay tuned, more information will come on this topic!
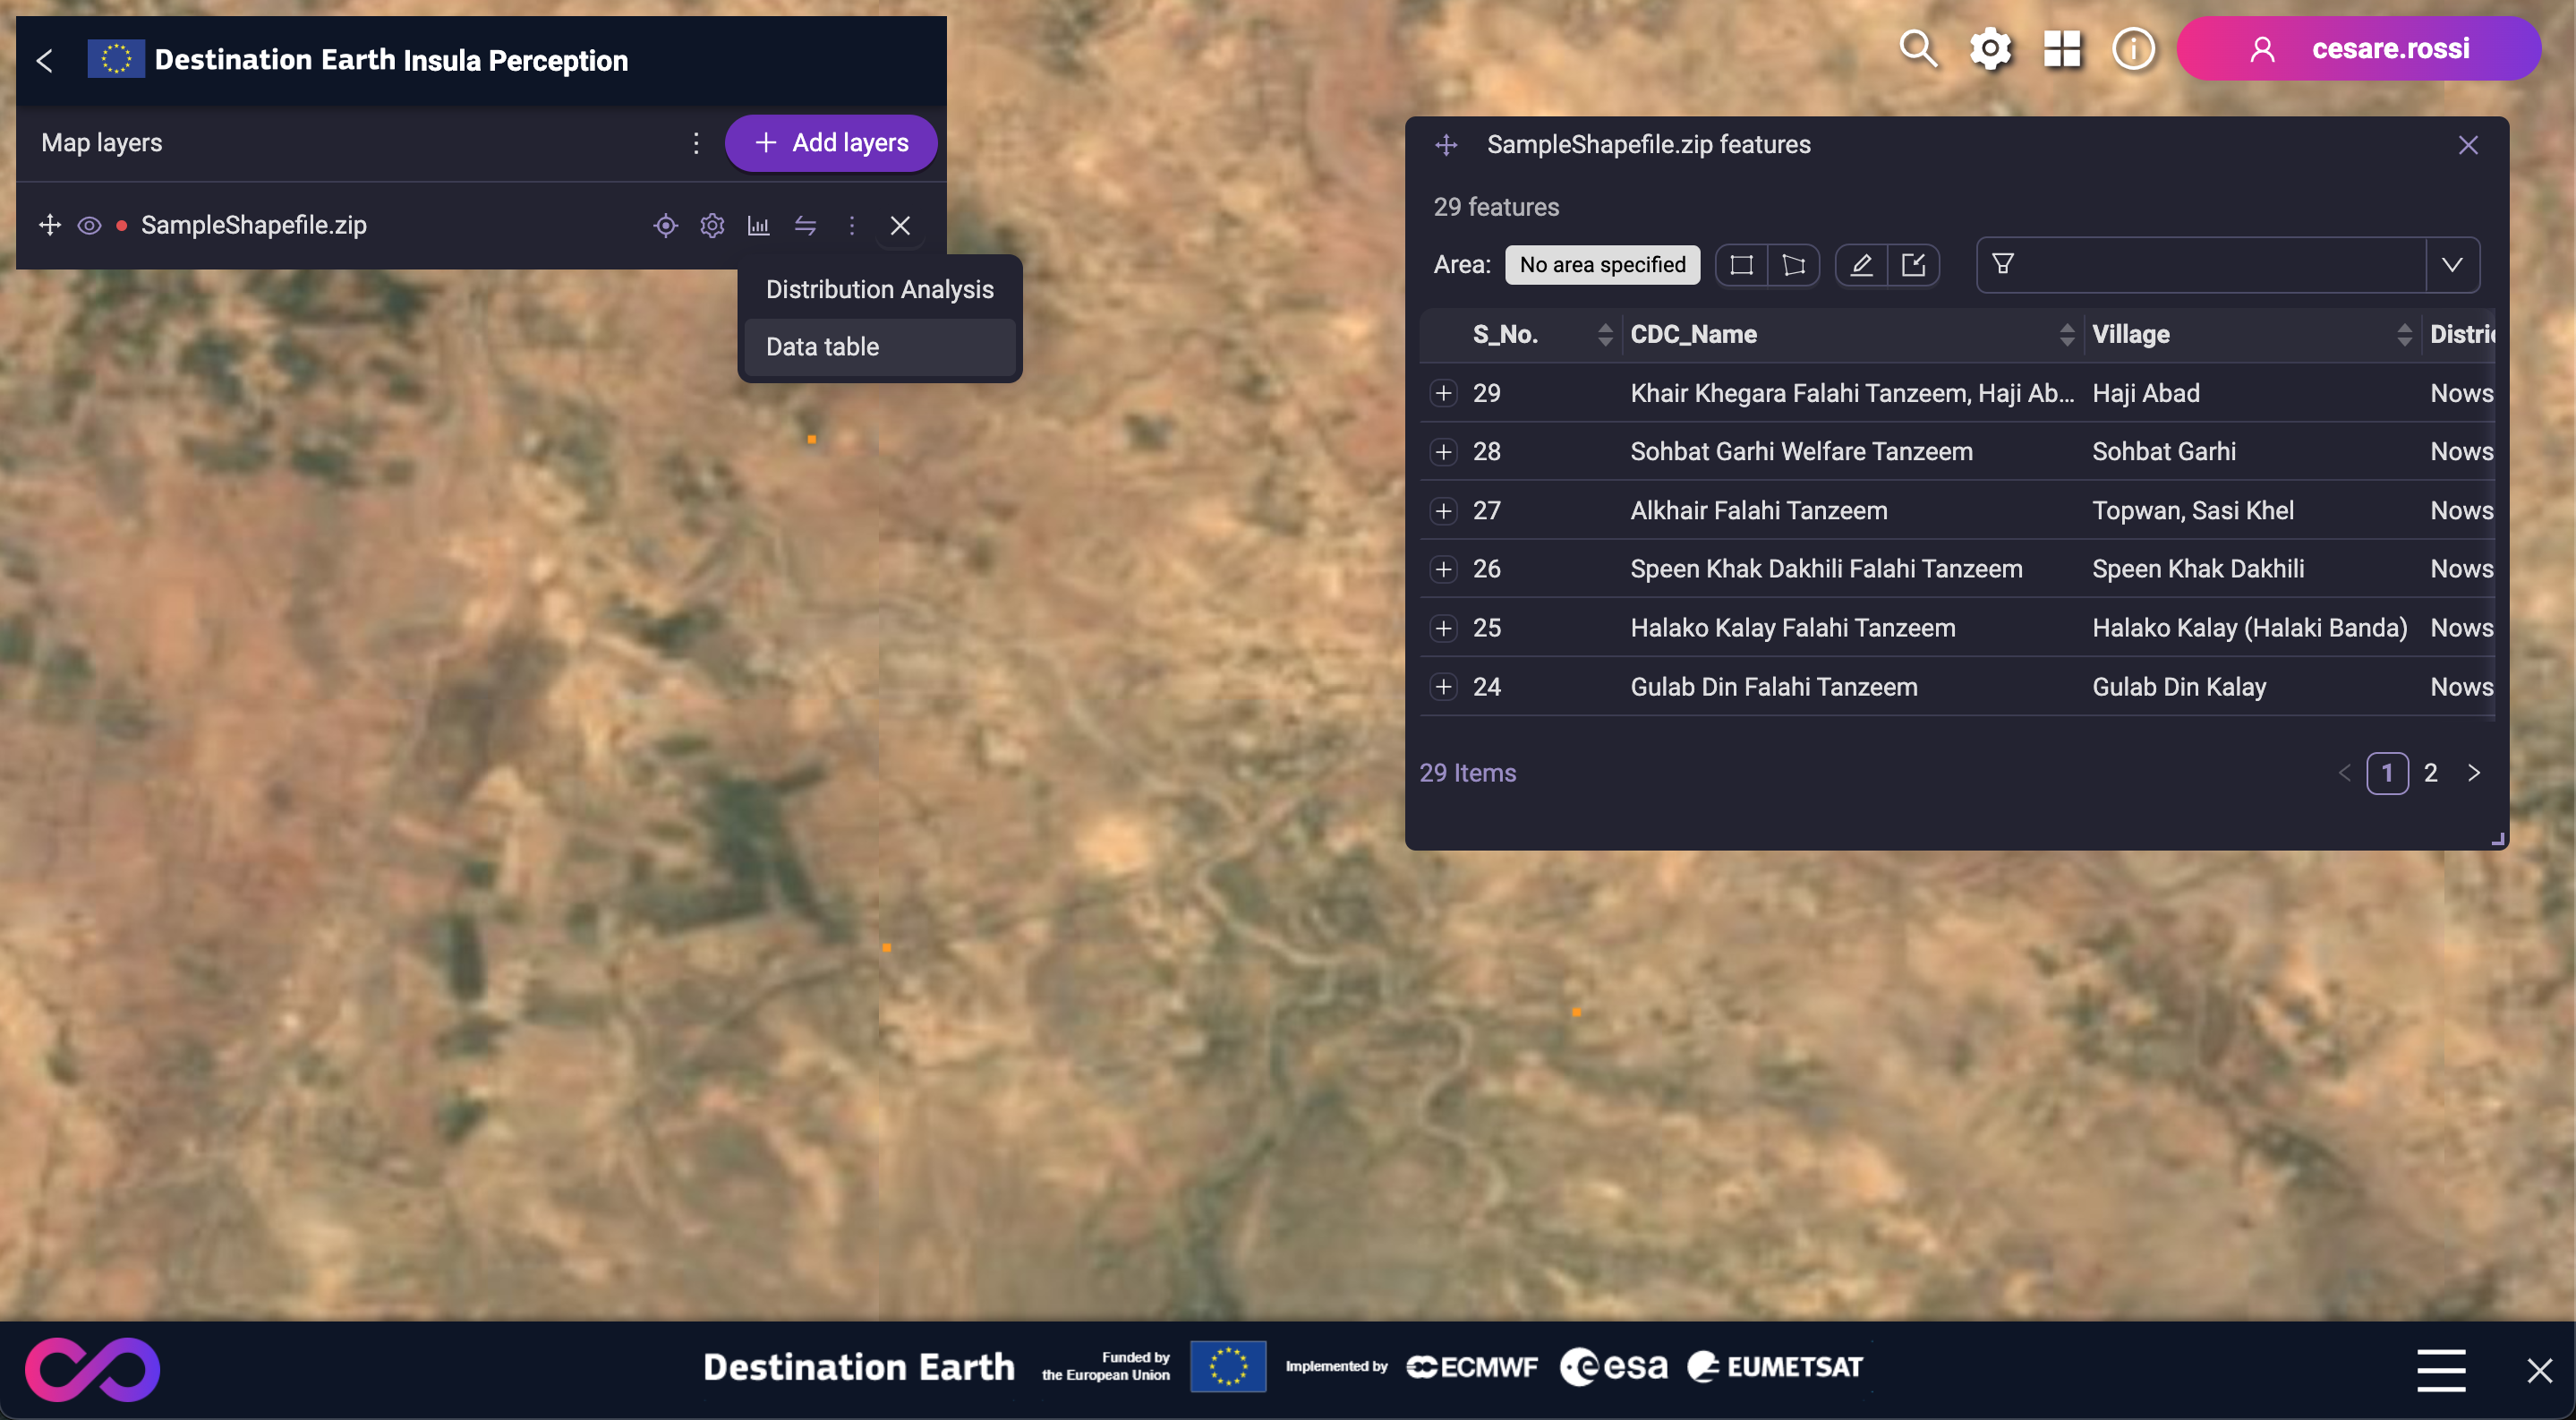
Data table (vector)
Data table provides an organized view of your data in a tabular format, complete with filtering options for easy data exploration.
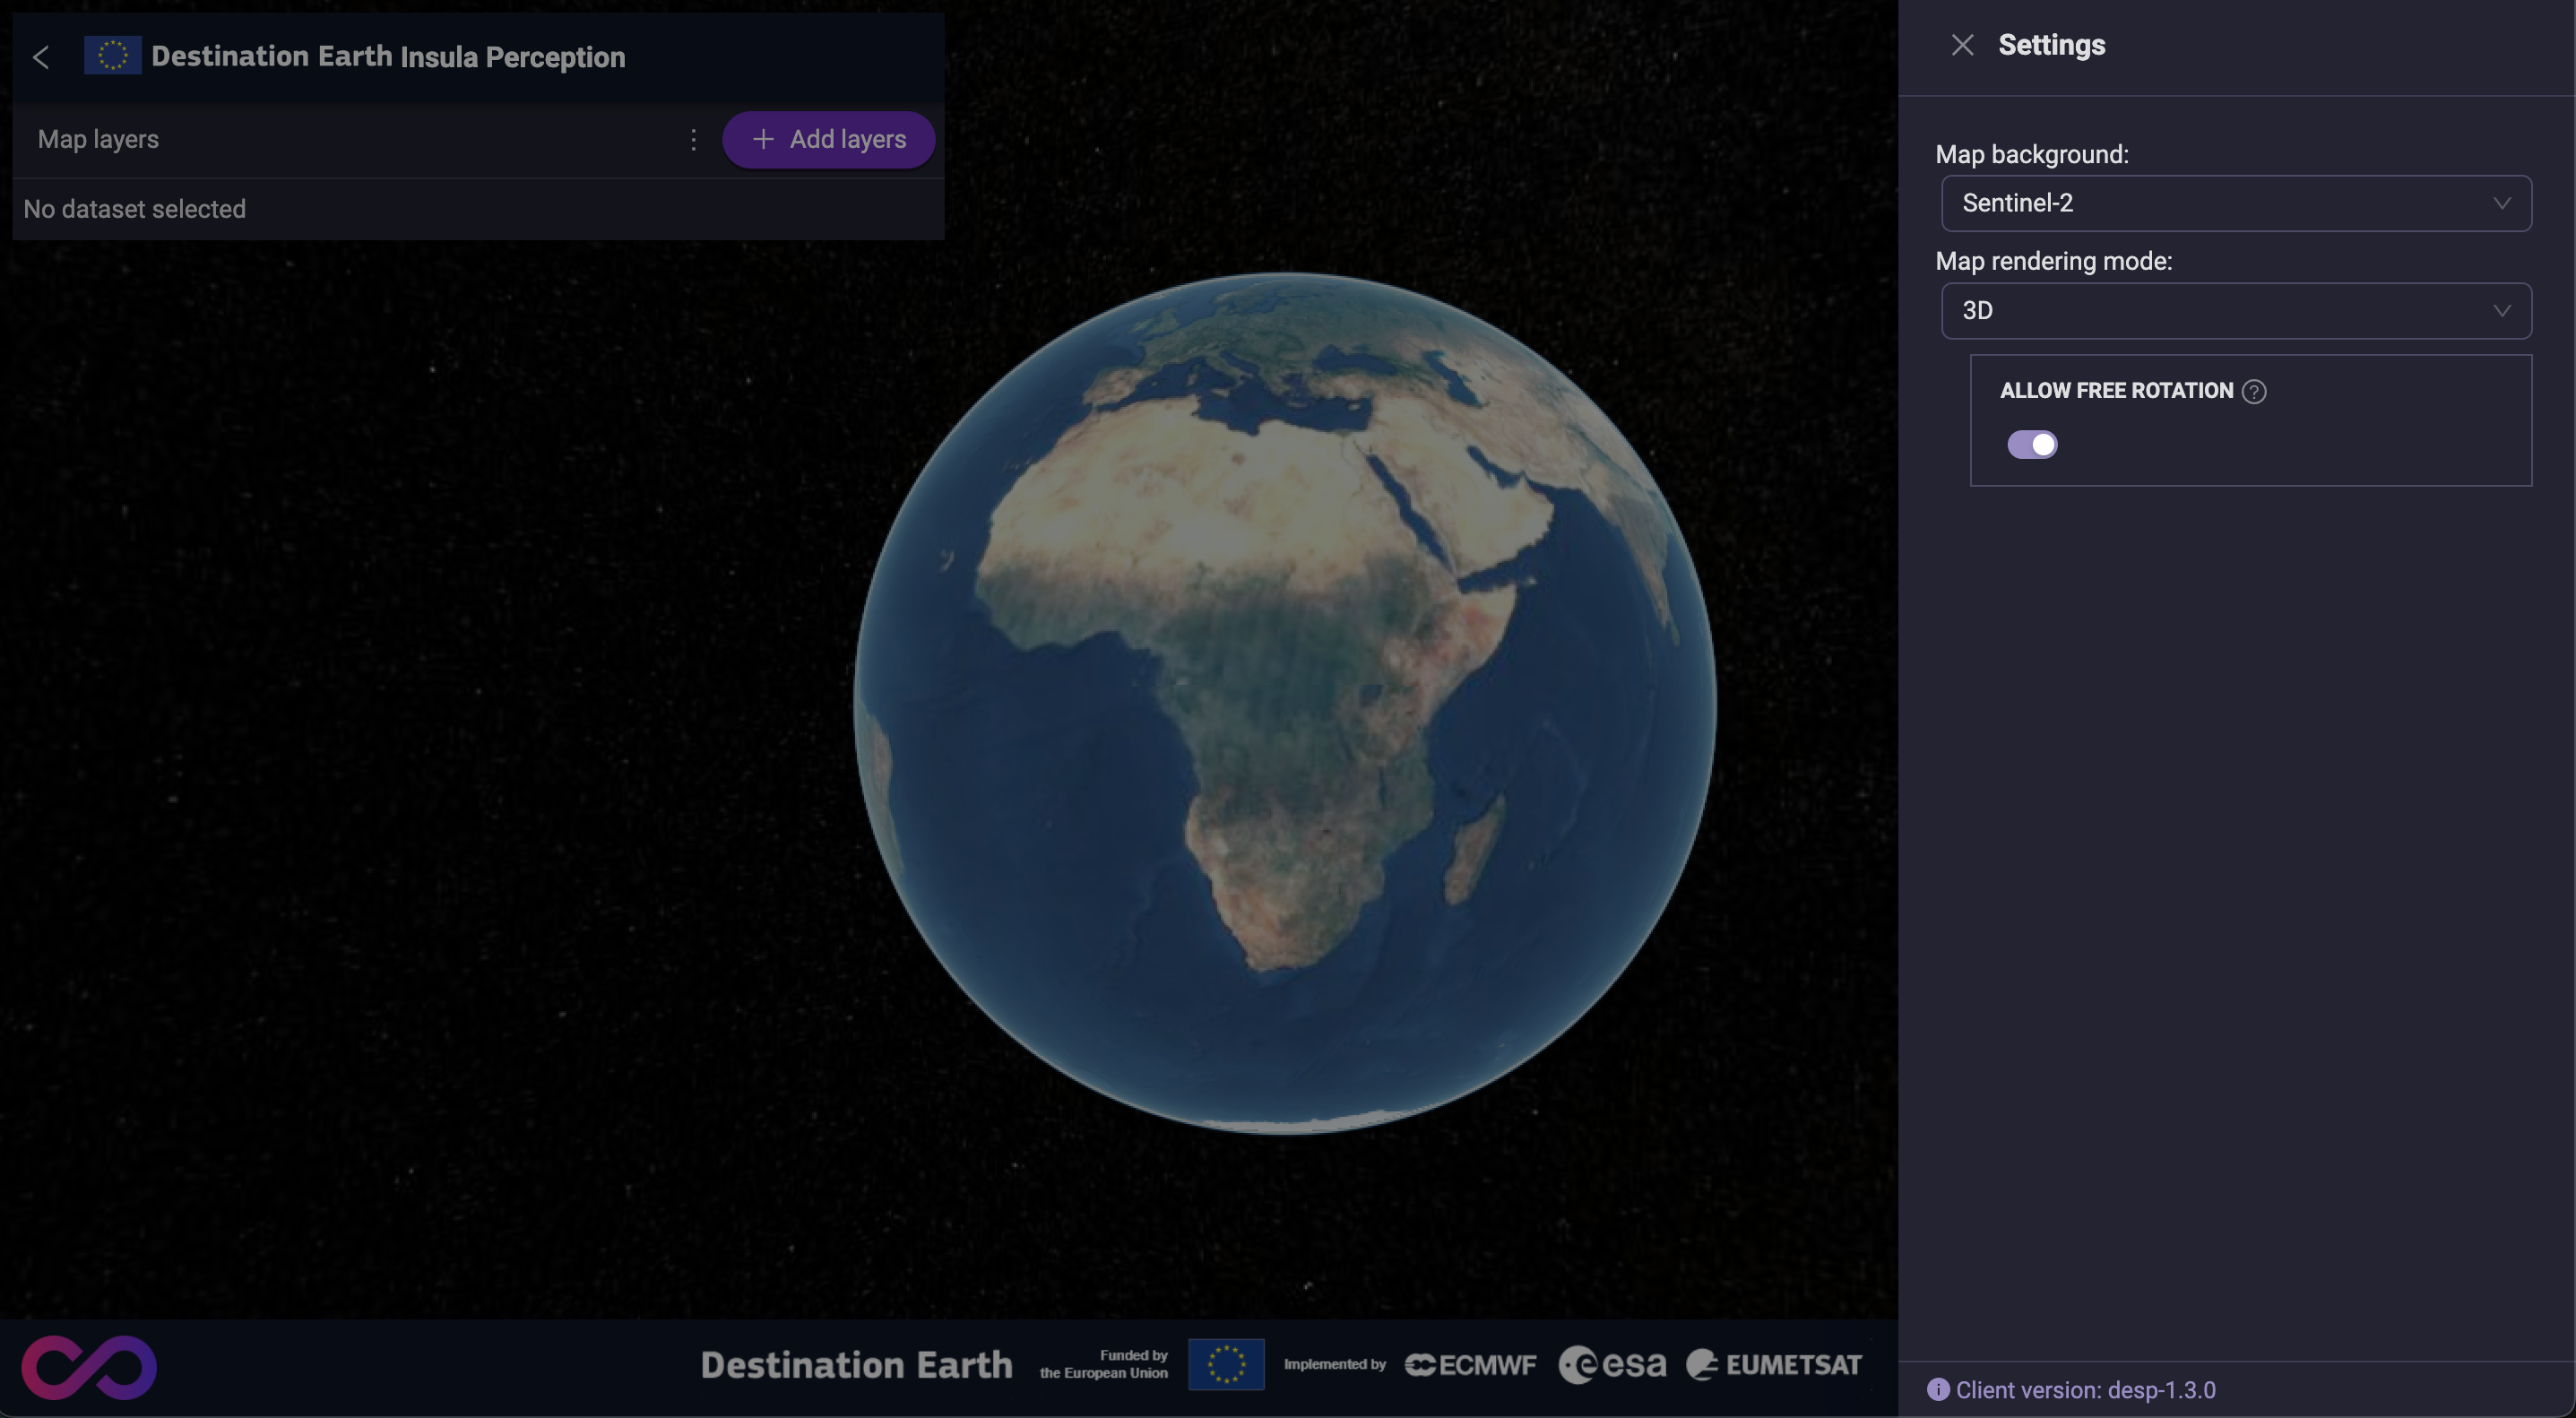
Map settings
Adjust your map settings by clicking the gear icon in the top right corner. This opens a panel on the right side where you can personalize your map experience:
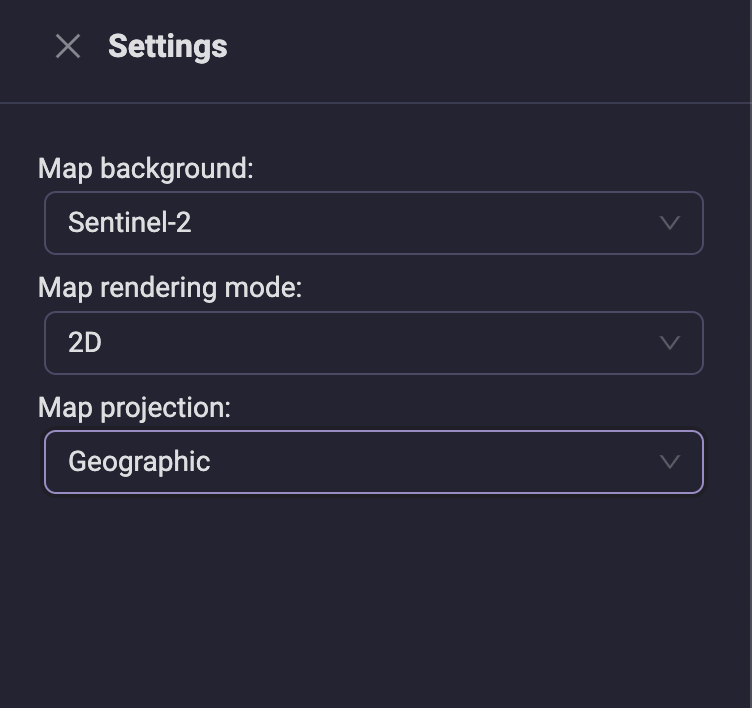
Map background: Choose from different base layers like Sentinel-2 satellite imagery, Bing maps, or OpenStreetMap.
- Map rendering mode: Switch between a flat 2D view or an immersive 3D perspective.
3D Mode: In 3D mode, unlock full rotation freedom around all axes instead of the default vertical axis only.
Map projection: Select between Geographic and Mercator projections for a map representation that best suits your needs.