What is NUPSI?
NUPSI - NUTS Production Storage and Imagery service is a web application designed to provide intuitive access to Copernicus data. By focusing on the “what, where, and when” NUPSI uses user-friendly controls and application-driven visualizations to help you access, interpret, and compare satellite information for your area of interest.
Open the NUPSI video presentation in a new tab to watch it on YouTube.
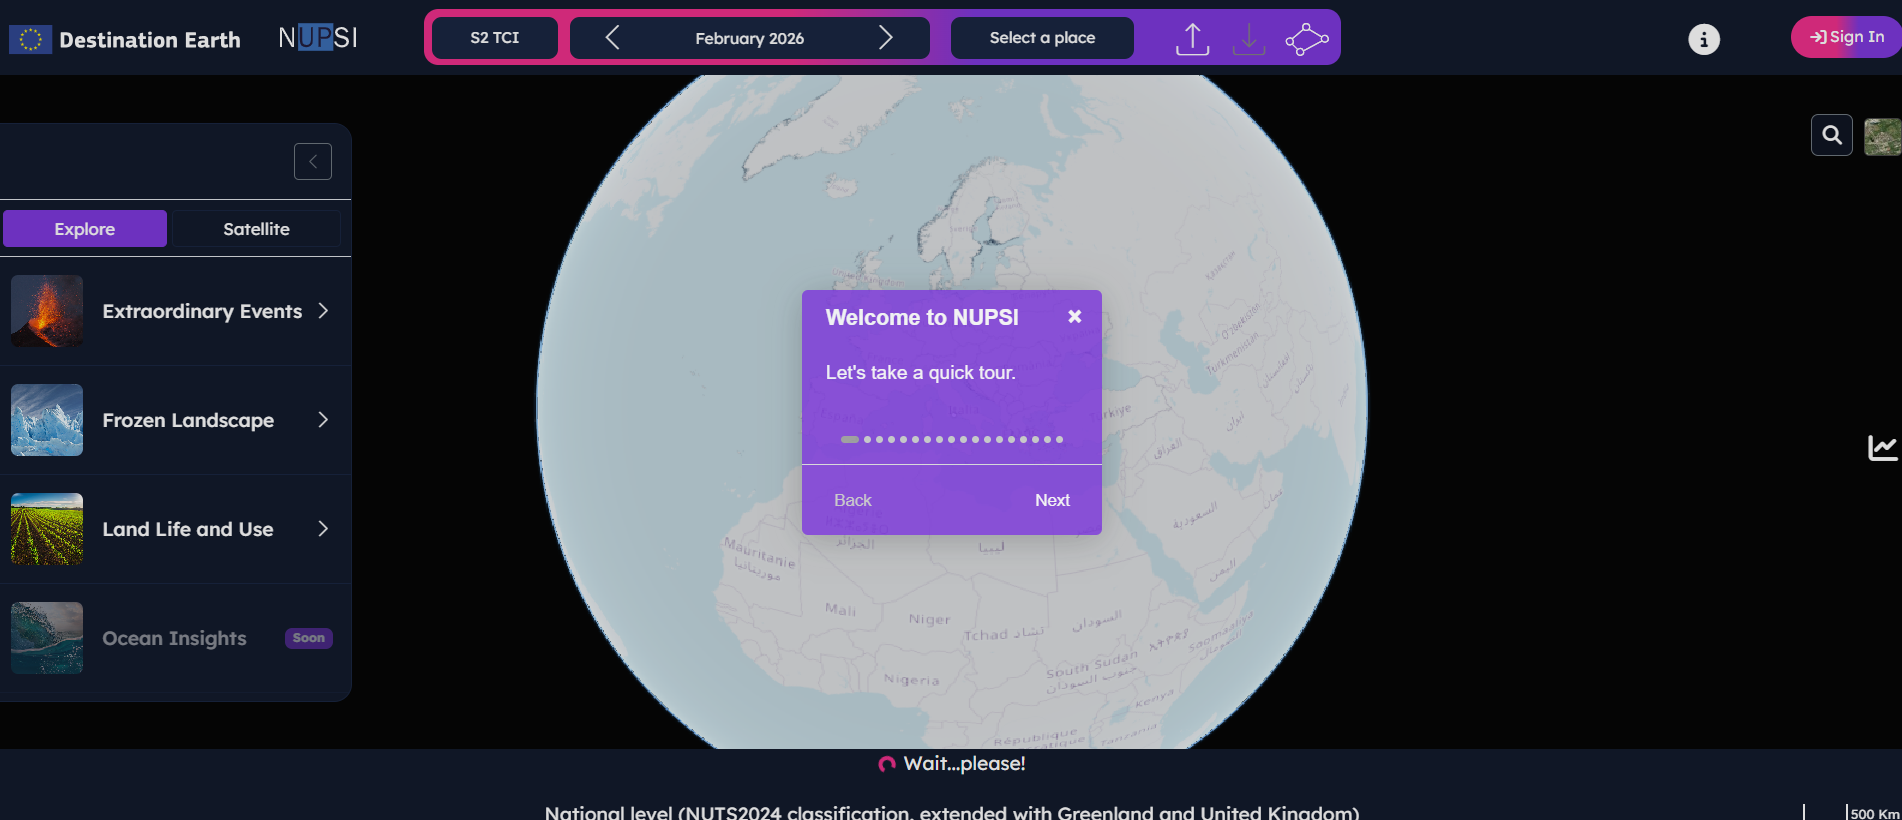
Tour Interface 
If it is your first time on NUPSI, follow along the interactive tour to discover the main tools and features.
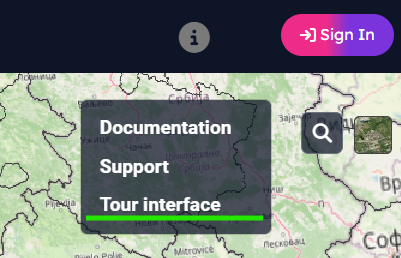
To reactivate the interactive tour, click on the Information icon and select “Tour Interface”
Area of Interest (AOI) Focus
NUPSI displays Copernicus data over predefined administrative boundaries, specifically European NUTS (Nomenclature of Territorial Units for Statistics, from National Level to NUTS3 levels), as well as custom AOIs.
Application-Driven Visualisation
Track changes over time using a seamless timeline interface.
Visualize parameters from multiple perspectives (e.g., vegetation, soil moisture, urban dynamics).
Access pre-processed Sentinel mosaics or request custom data extractions.
Available Pre-Processed Datasets
Sentinel-2 Level-2A: Cloudless monthly mosaics (Bands: B02, B03, B04, B08, B8A, B11, B12)
Sentinel-1 Level-1 IW DV GRDH mosaics
How to select Area of Interest
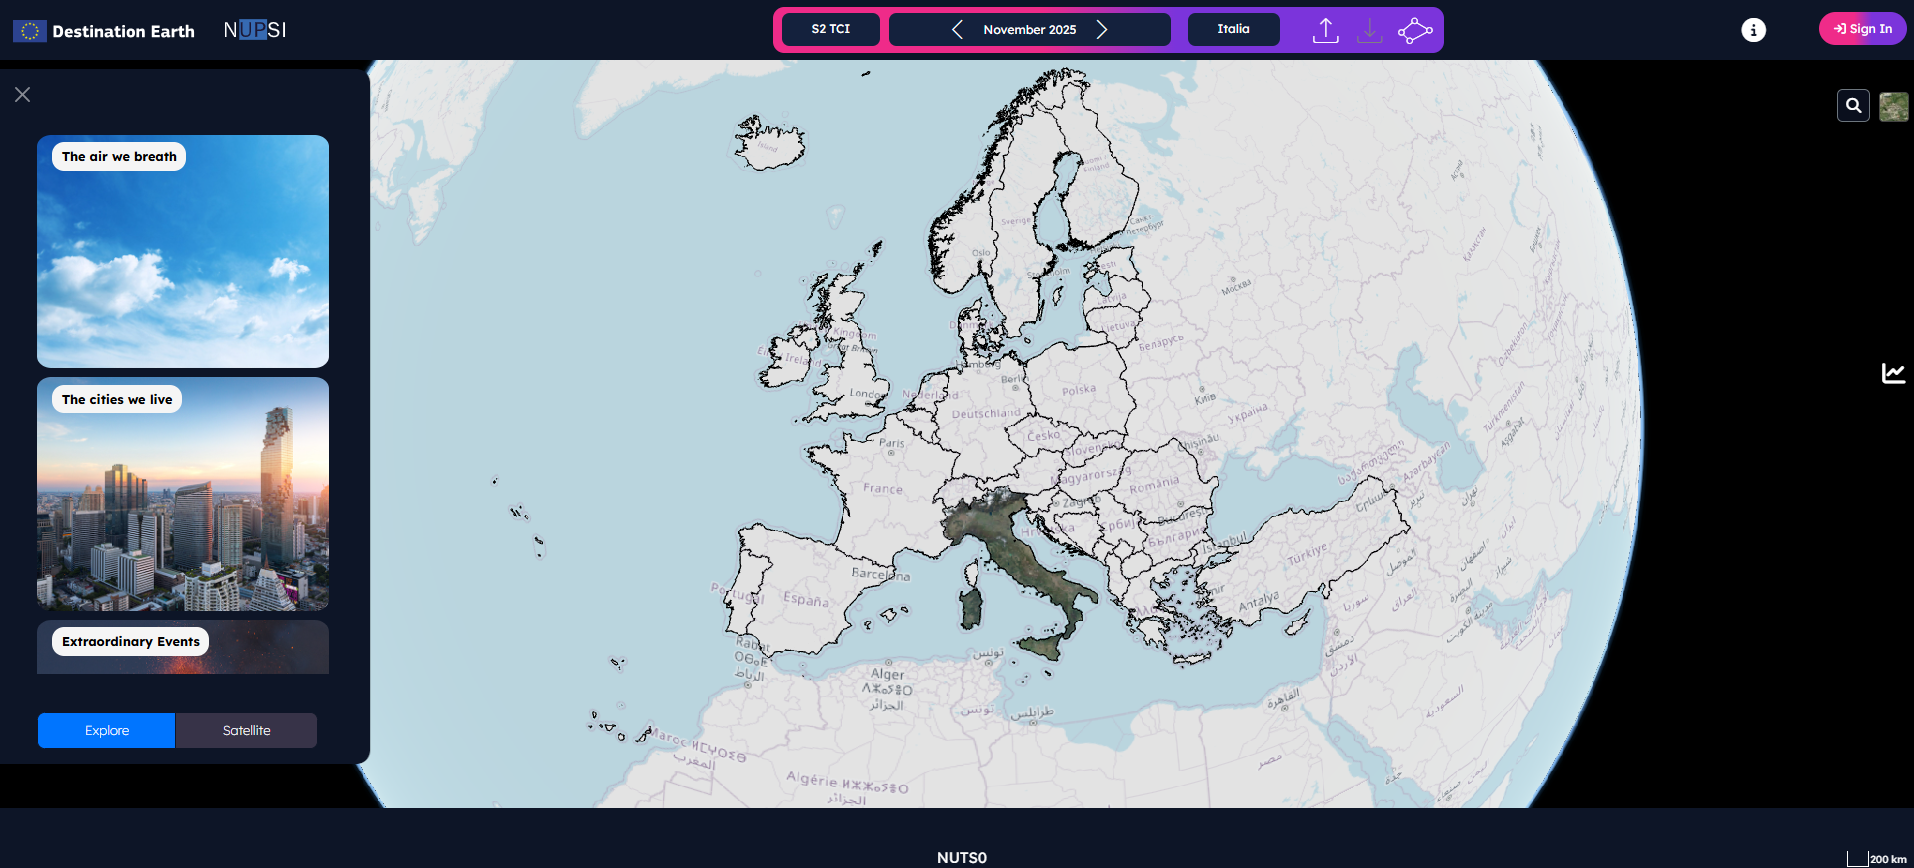
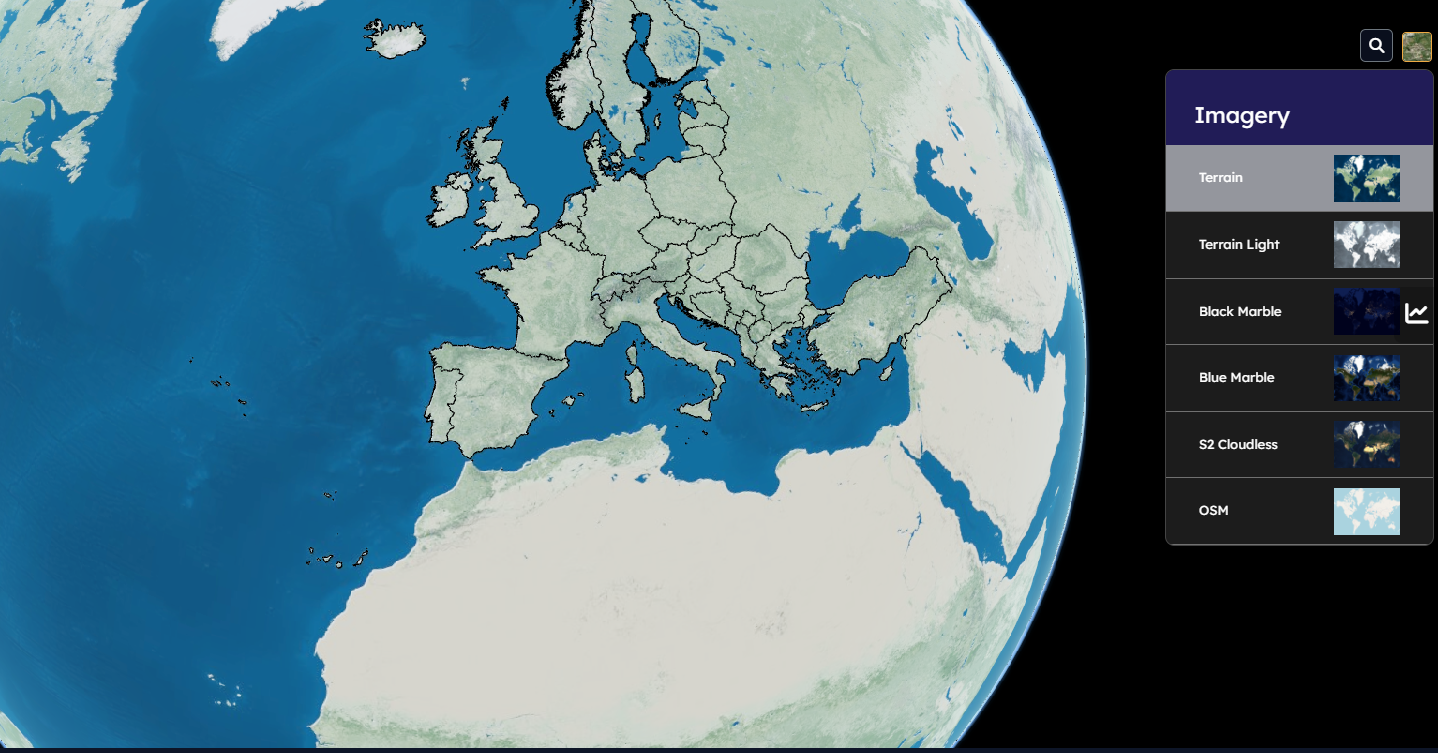
The NUPSI homepage features an interactive globe with preloaded NUTS boundaries for seamless browsing of European data.
See how to navigate NUTS level and how to select areas of interest by opening the Navigation video tutorial in a new tab.
You can select an Area of Interest in several ways:
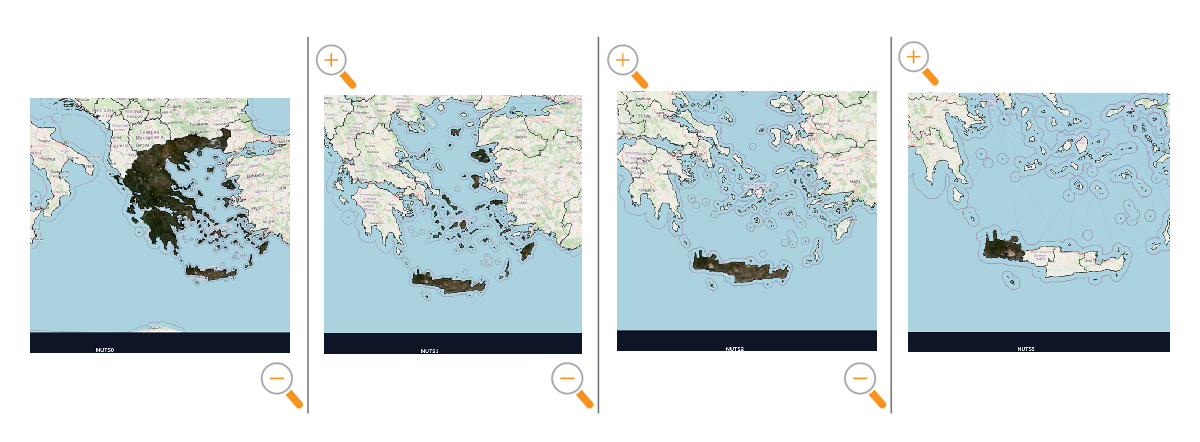
NUTS level navigation: Zoom into the map. The displayed NUTS level will dynamically update from country (National Level) to local areas (NUTS3).
There are two different classifications available for the National Level:
National Level NUTS2021 classification
National Level NUTS2024 classification extended with Greenland and UK
1.1. Download a GeoTIFF of the selected area by clicking the download button

See more details by opening the GeoTIFFs download video tutorial in a new tab.
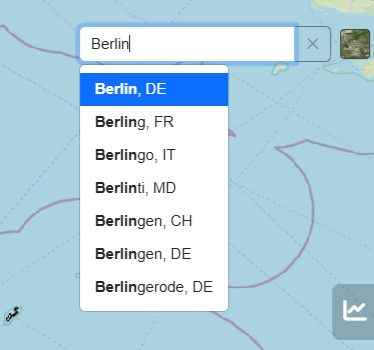
Search Bar: Use the integrated search bar for European communes (GISCO) to find smaller administrative areas inside NUTS coverage.
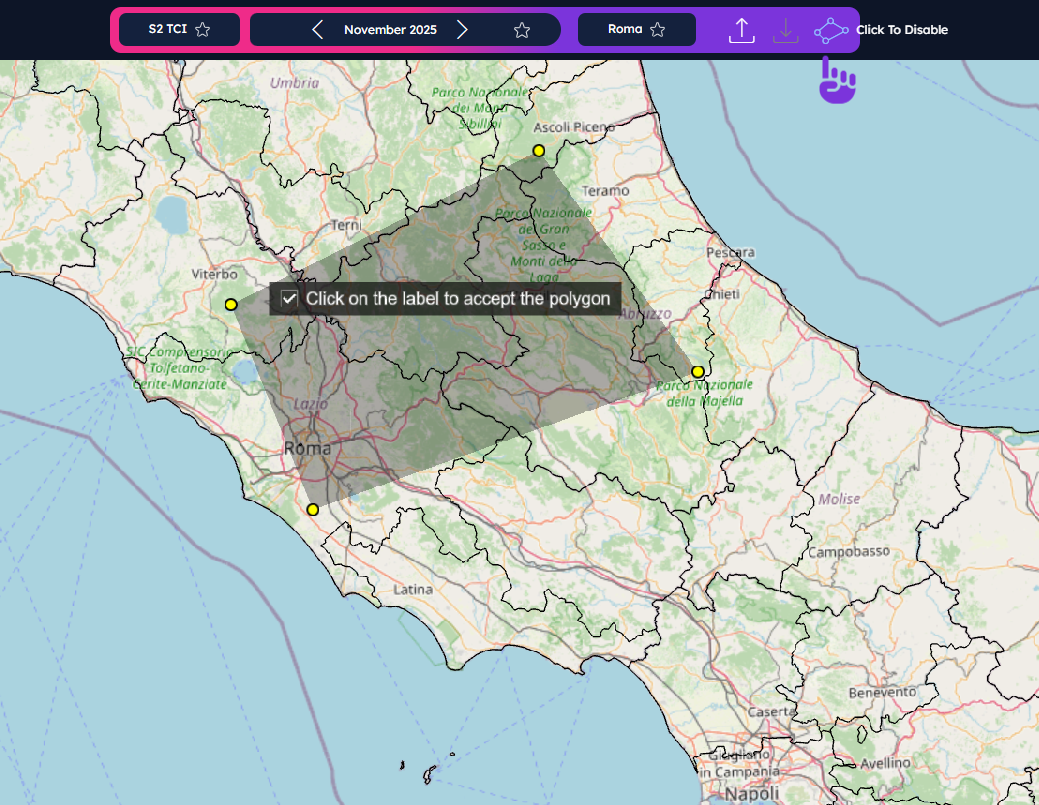
Freehand drawing: Click the drawing tool icon
 and draw a
shape point-by-point (right-click to close it).
and draw a
shape point-by-point (right-click to close it).See more details about the polygon tool by opening the Overview video tutorial in a new tab.
GeoJSON download and upload

4.1. Once you have created your freehand section, you can download it as a GeoJSON file using the download icon
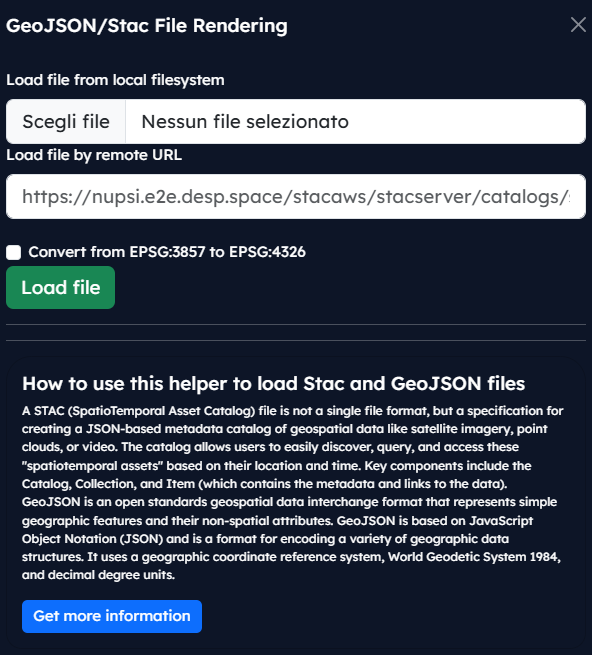
.Note: In order to download a GeoJSON cutline, the user must log in first.4.2. Upload your own GeoJSON file using the upload icon
.The following pop-up will appear on the left side:
Browse and Visualise Systematic Data Offer
Navigate different levels monthly mosaics. You can visualize each layer along a timeline.
See more details about the data selection by opening the Product menu video tutorial in a new tab.
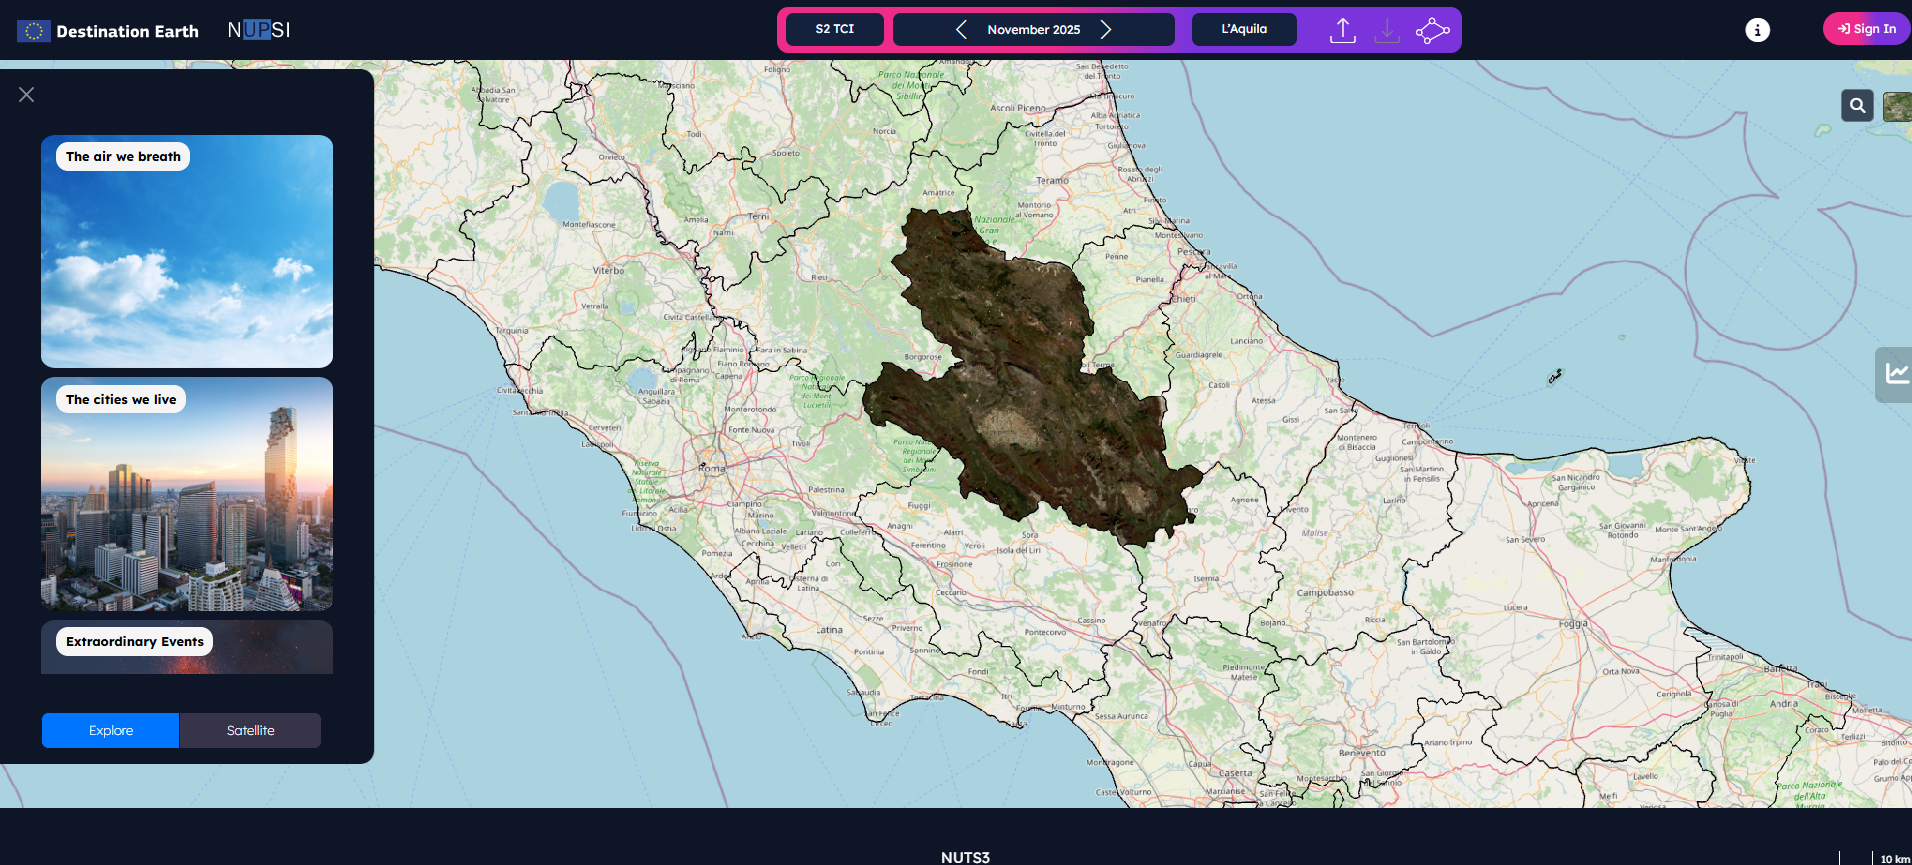
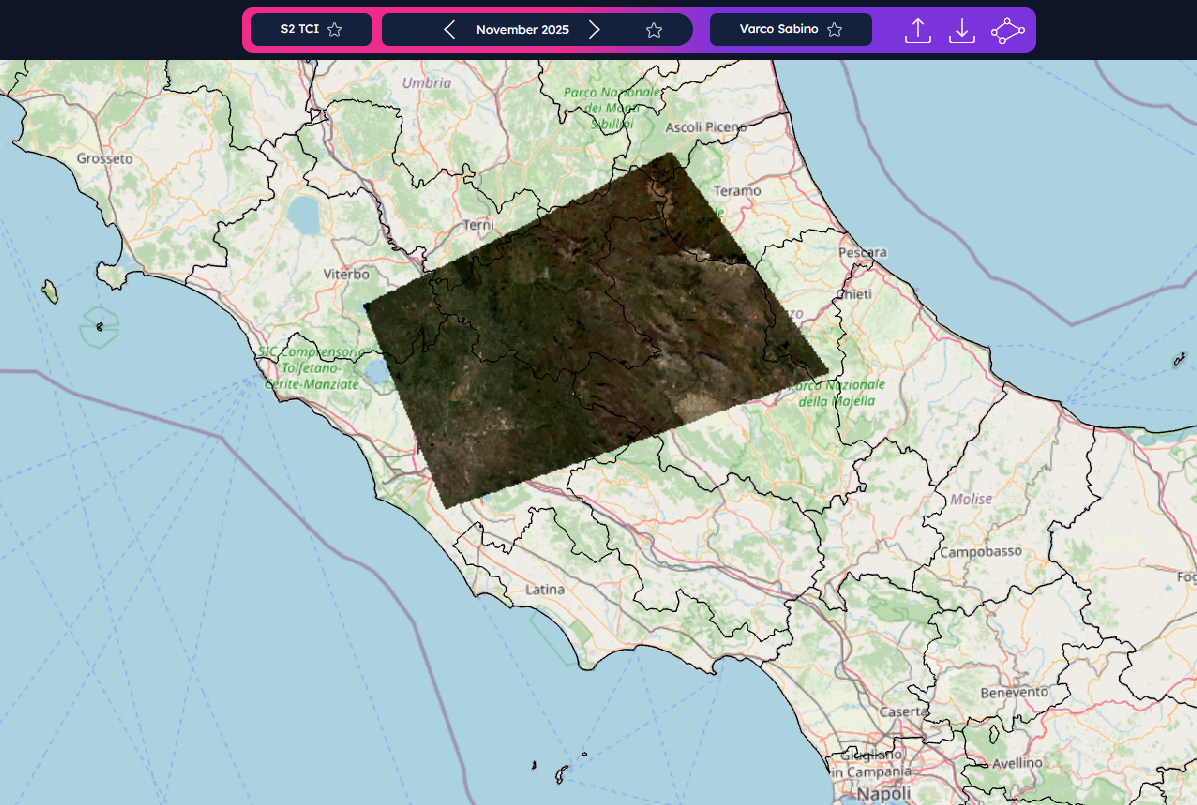
First, select your area. Then, choose a visualization.
NUPSI uses common Sentinel-based visualizations (e.g., S2 TCI, NDVI, NDMI, S1 RGB ratio, SAR Urban) to support various applications. The data is organized in two menus:

Explore Menu
Ideal for non-expert users. Start with an application need (e.g., “Soil Moisture”) and be guided to the relevant data layers (e.g., NDMI).
Each application includes a brief description.
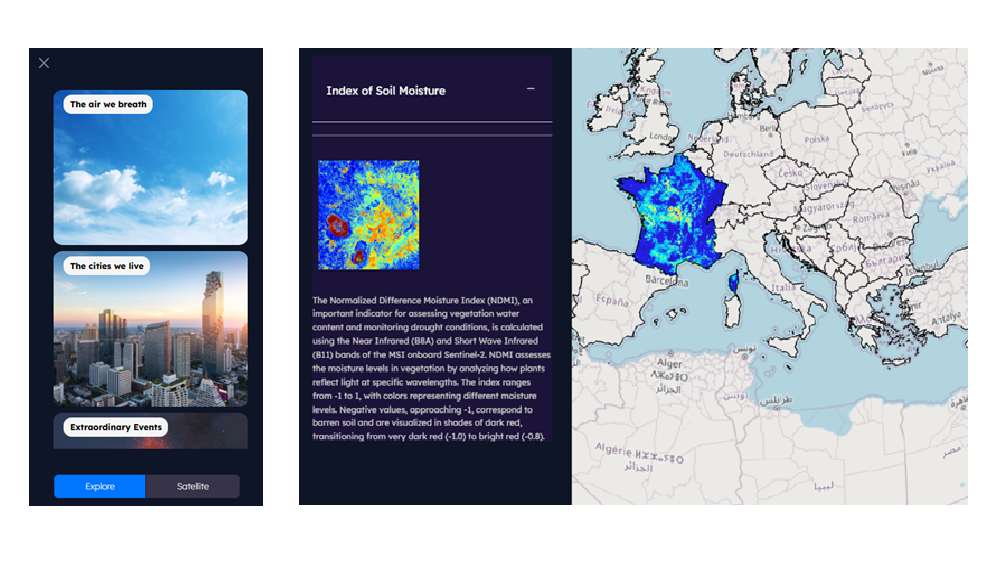
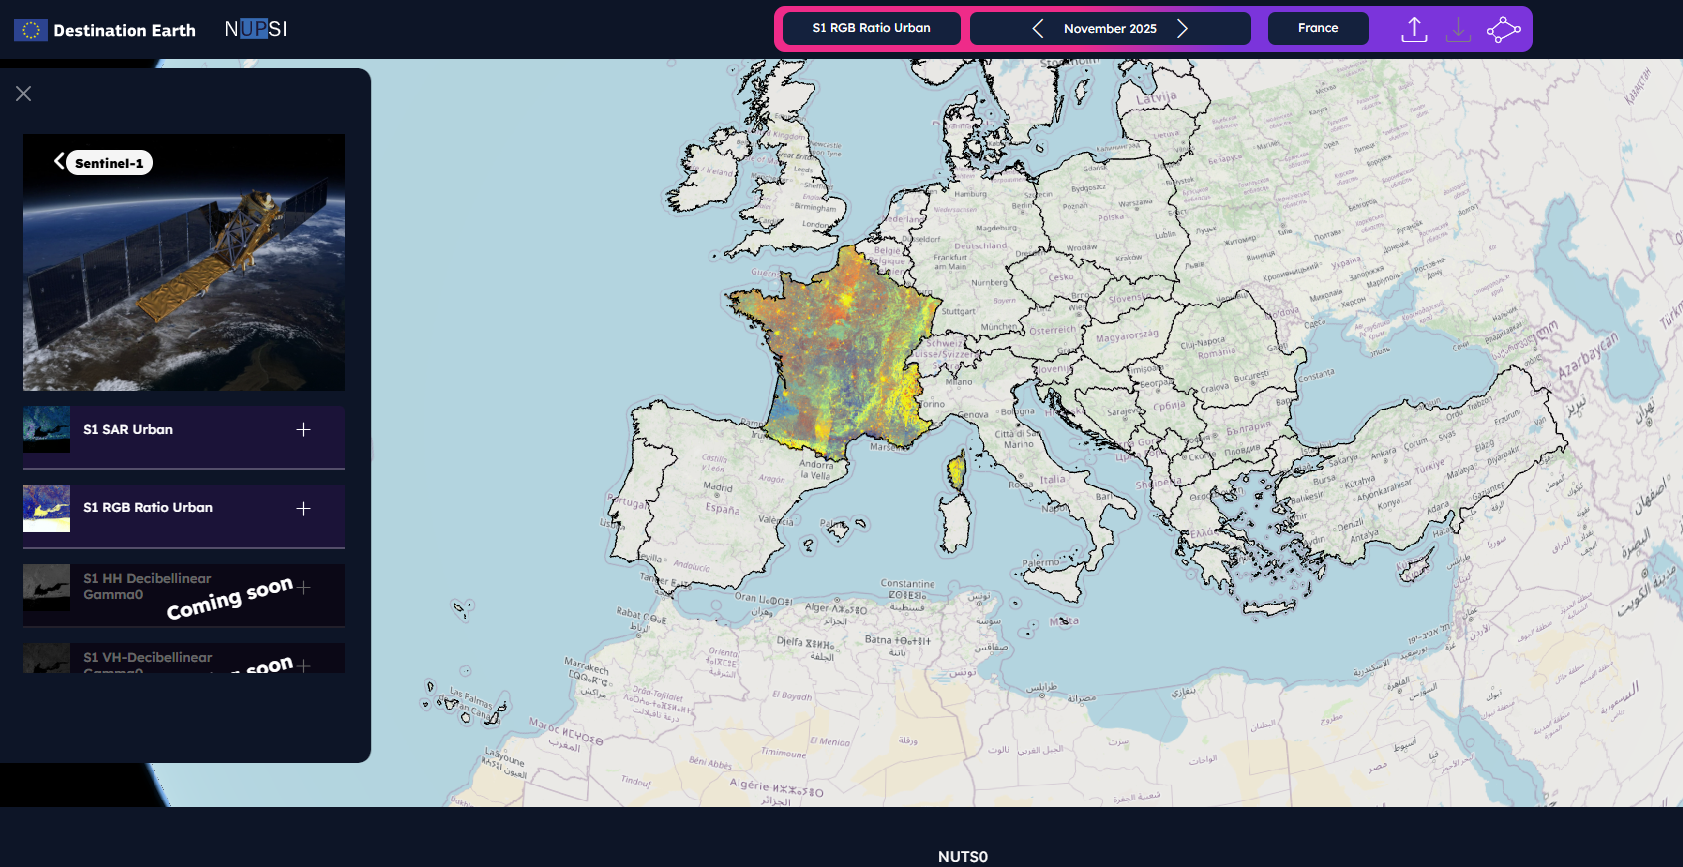
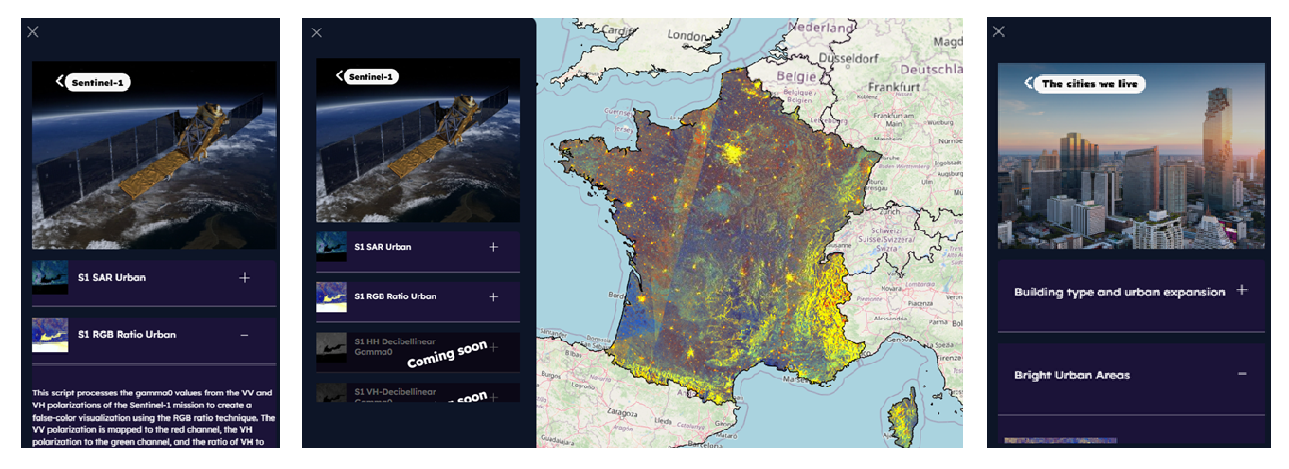
Satellite Menu
For expert users who want direct access to specific missions, bands, or indices. This menu provides the same visualizations but organized by satellite mission (e.g., Sentinel-1, Sentinel-2).
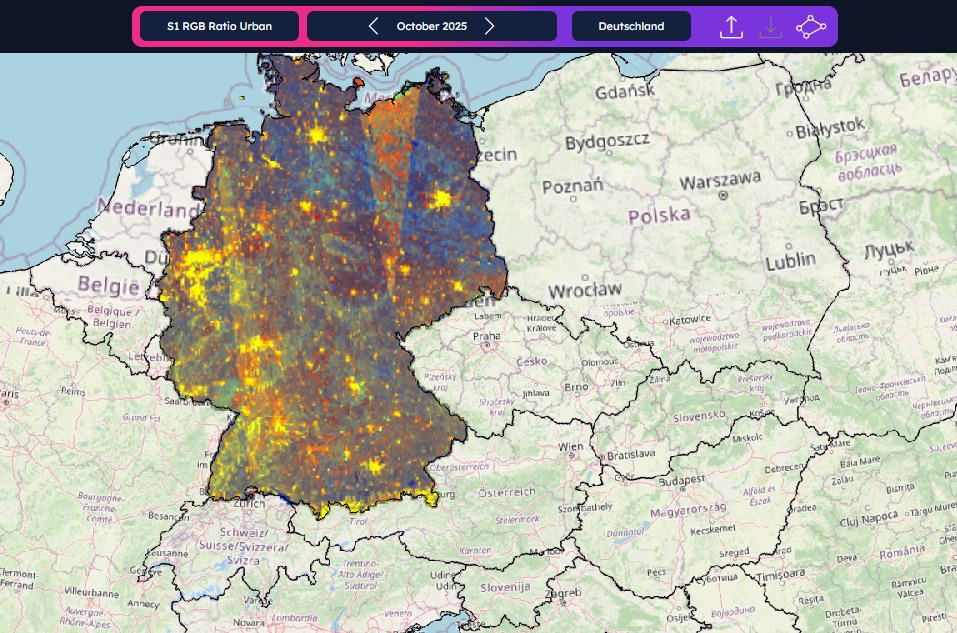
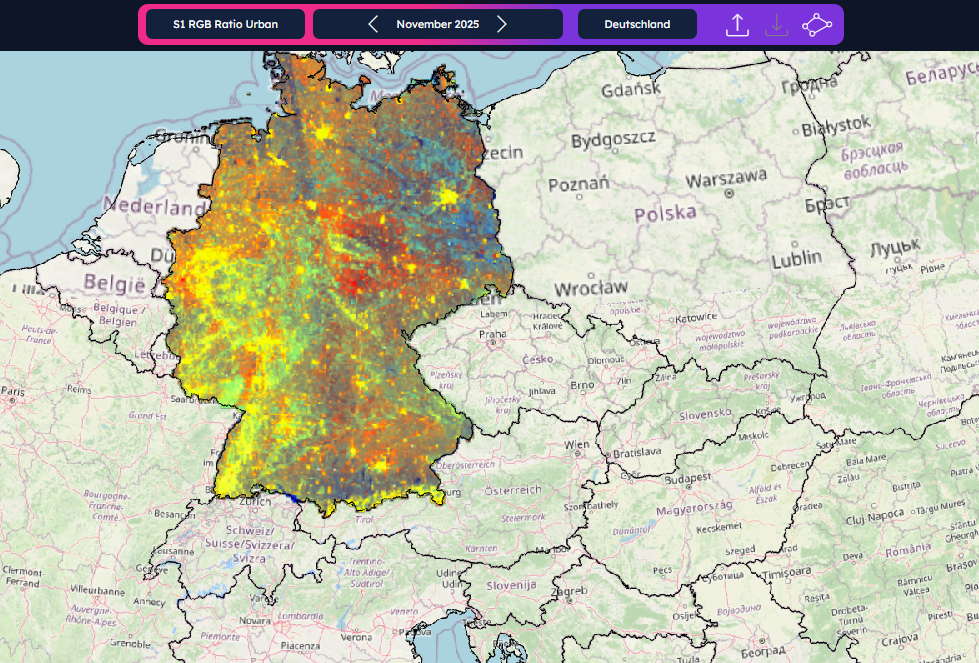
Timeline viewer
Navigate through time using the monthly timeline. Use the arrows to scroll through available data and monitor the evolution of your area.

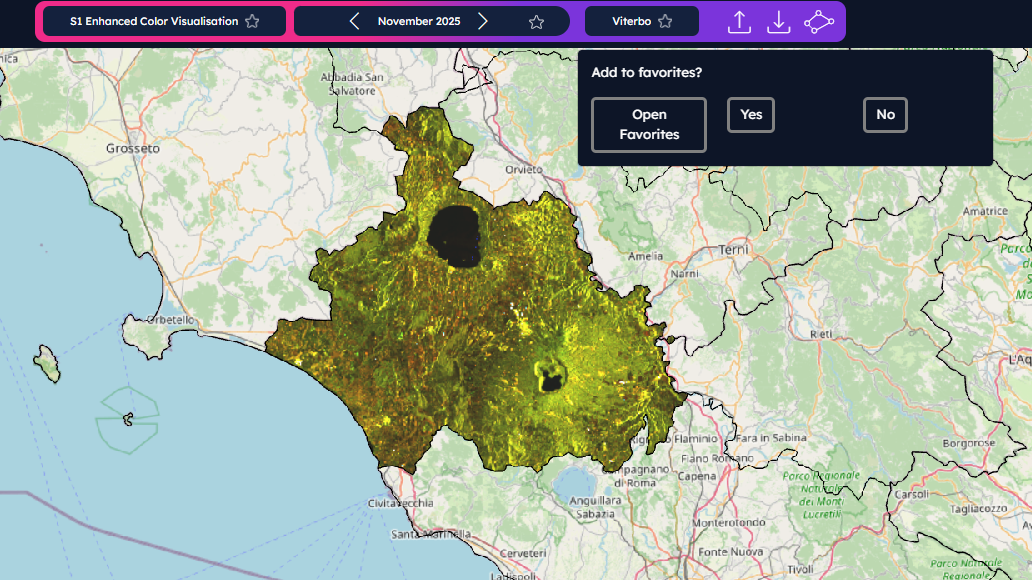
Use the star icon to save favorite AOIs, visualizations, and time windows.
See more details about favorites lists by opening the Overview video tutorial in a new tab.
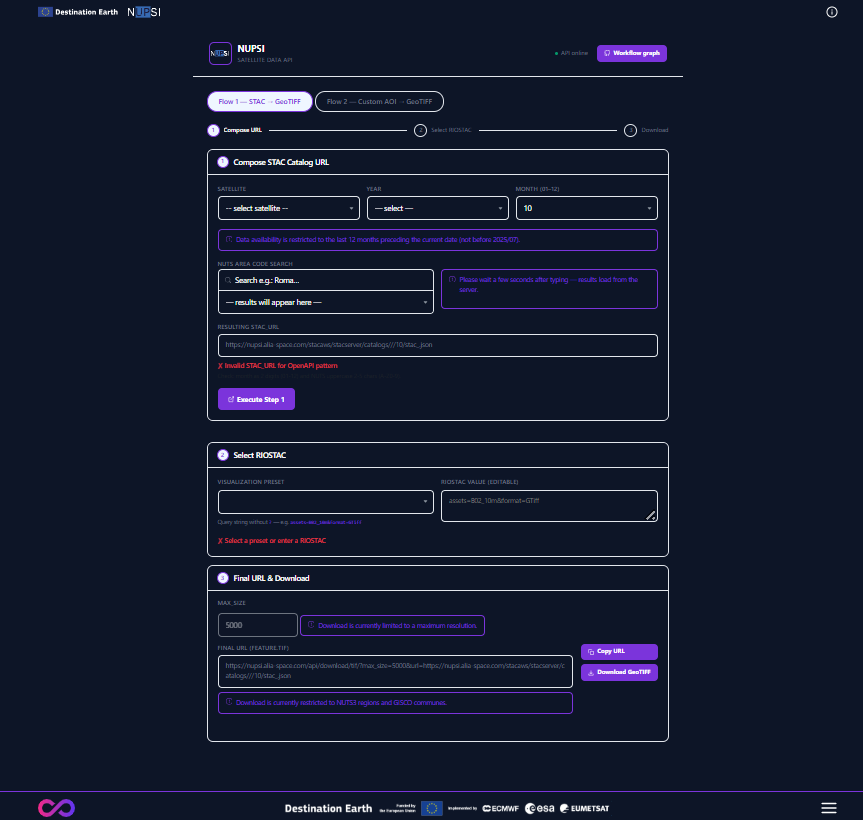
API
NUPSI’s API are available for GeoTIFF generation and have been improved with the 1.1.0. release. Click the API button in the side bar for more information.
Helper
The Helper page allows user to make use of NUPSI’s API through a simple interface. Open the Helper in a new tab to interact with it.