UHEATS Documentation

The UHEATS (Urban Heat) service enables users to analyze urban heat patterns and assess the impact of climate adaptation measures across European cities. Developed by VITO and Tecnalia within the Destination Earth (DestinE) framework, the service provides a user-friendly interface to configure simulations and explore high-resolution outputs supporting urban planning and climate resilience.
What the service does
UHEATS allows users to:
Analyze urban heat stress and variability.
Compare present-day and future climate conditions.
Evaluate adaptation scenarios.
Explore results through an interactive visualization platform.
The service supports decision-making for climate adaptation and urban planning.
What it looks like
Overview
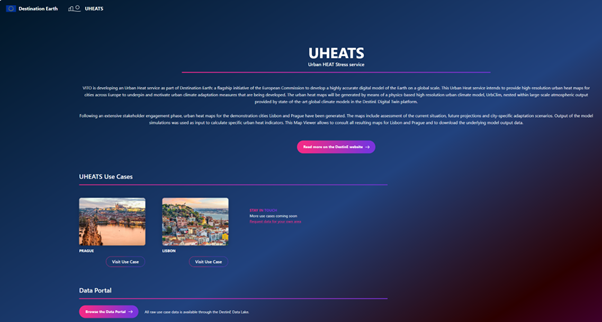
Landing page of UHEATS Viewer module.
Viewer Module
The UHEATS viewer enables interactive exploration of results.
Access
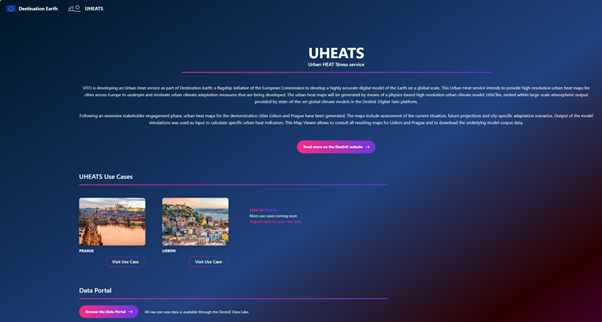
Access available results:
Select a city use case or open the Data Portal to access raw output data through the Destination Earth Data Lake.
Available city use case examples include Lisbon (Portugal), Prague (Czech Republic), Worms (Germany), Thessaloniki (Greece), Milan (Italy), Bristol (UK), Yenisehir (Turkey), Malaga (Spain), Larnaka (Cyprus), and Cascais (Portugal).
Visualization
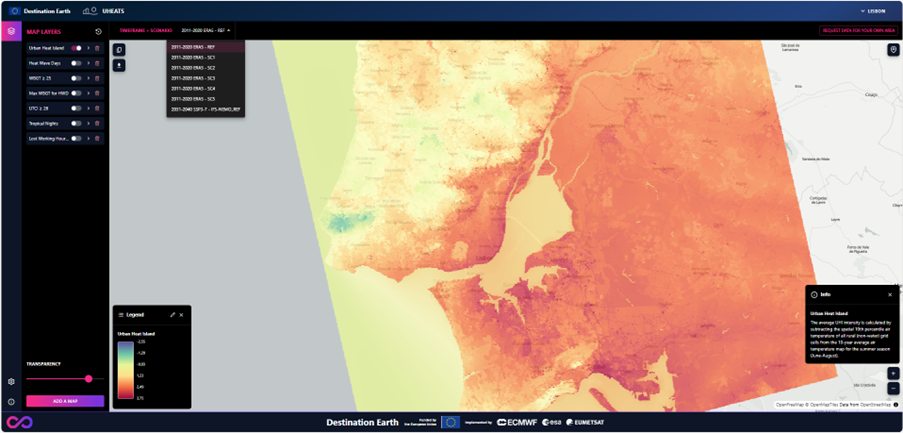
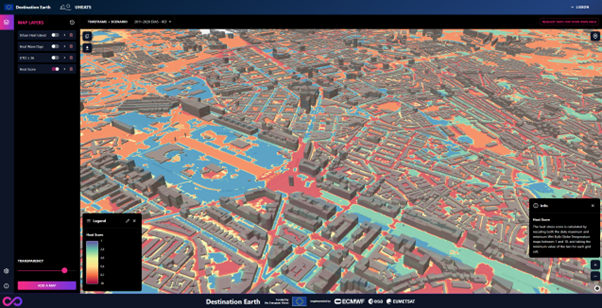
Display indicator layers:
Activate or deactivate layers using toggle buttons.
Select the desired timeframe and scenario.
Adjust layer transparency for visual comparison.
Activate or deactivate legend.
Consult the information panel for descriptions of the selected indicator.
Indicators
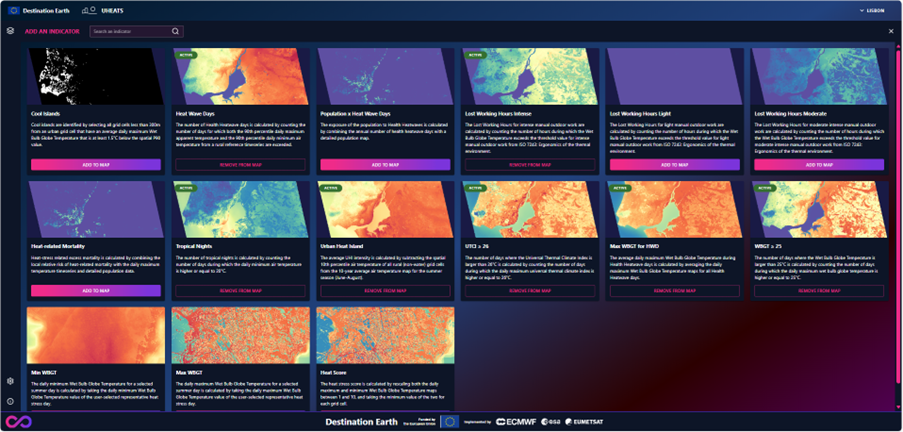
Select additional indicators from the available catalog. Examples include:
Urban Heat Island intensity.
Number of heat wave days.
Thermal comfort threshold exceedances.
Heat-related mortality.
Exploration tools
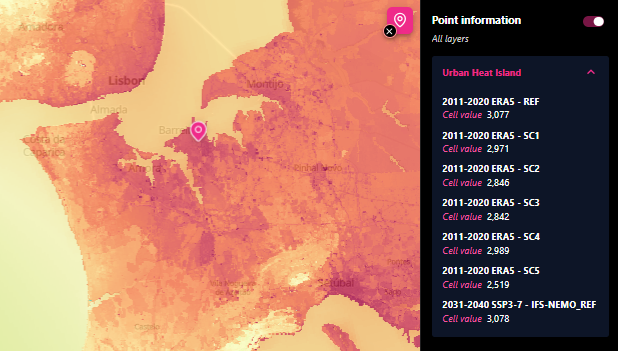
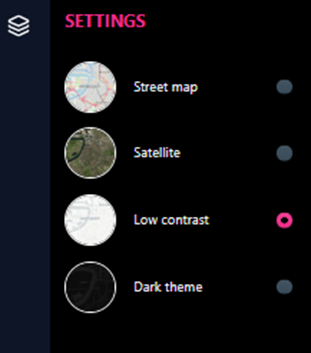
Explore your data:
Zoom and pan.
Click for point-based values.
Switch background maps.
Download
Export maps as GeoTIFF (
.tif).Compatible with GIS workflows.
Usage
Typical workflow
Open the UHEATS viewer.
Compare scenarios and indicators.
Export results for further analysis.
Target users
The service is designed for:
Local authorities and city administrations.
Urban planners and architects.
Policy makers.
Researchers.
Environmental analysts.
Data and modelling
Based on the DestinE Climate Adaptation Digital Twin.
Spatial resolution:
100 m (UrbClim).
1 m (HiRex).
Time horizons:
Historical (2000-2024).
Future (2035, 2045).
Indicators derived from urban climate modelling workflows.
System architecture (simplified)
The UHEATS service consists of:
Viewer interface: interactive visualization.
Results are managed within the Destination Earth infrastructure.