DestinE ESA UrbanSquare documentation
UrbanSquare is an operational framework to assess the exposure of urban areas to climate risks and to enable the stakeholders to act upon these risks through a set of what-if scenarios. This coupling between a monitoring and a prospective view is essential to enable them to understand the situation today and optimize their future actions. The use case is organized along five demonstration units.
Air pollution
Challenge: Deliver near-real-time, local-scale air quality data to analyse urban pollution dynamics and support public policy development.
Solution
High resolution model (1-km) built on Copernicus and in-situ data
Dynamic interface to access the data in near-real-time (daily delivery, 2 days latency)
What-if scenarios to assess the expected impact of public policies
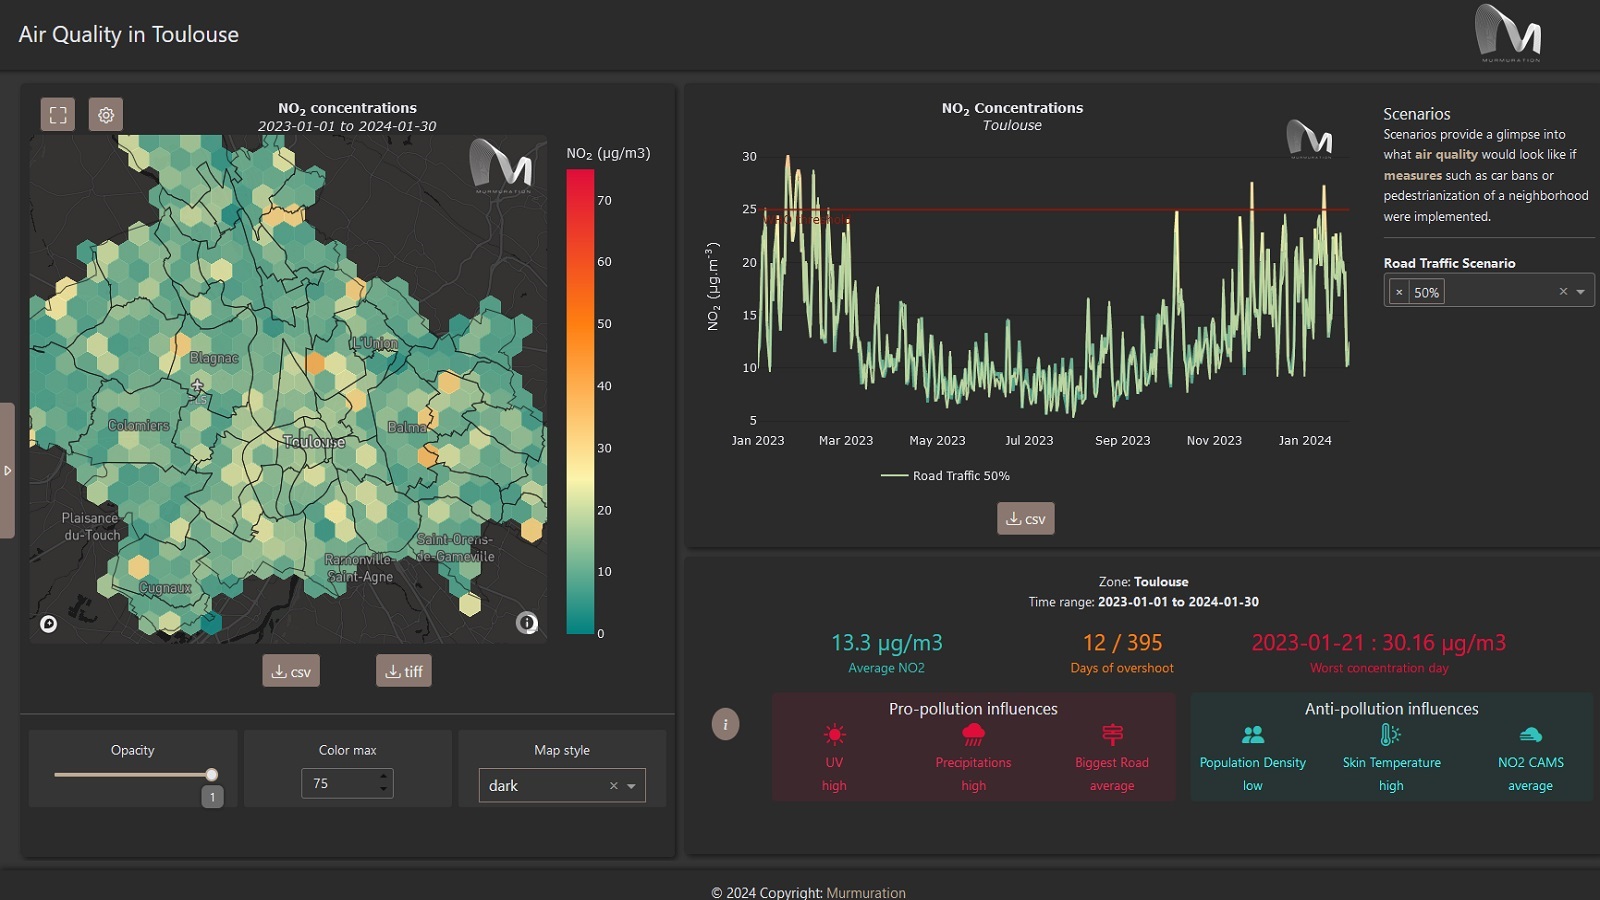
Made by Murmuration
Urban heat
Challenge: Deliver a neighbourhood-scale heat exposure indicator and evaluate the effects of urban changes on exposure levels.
Solution
Exploit Land Surface Temperature satellite data for a high-resolution urban heat island mapping
Dynamic interface to provide a seasonal view of the urban heat island effect
Before/after comparison feature to assess the impact of urban changes
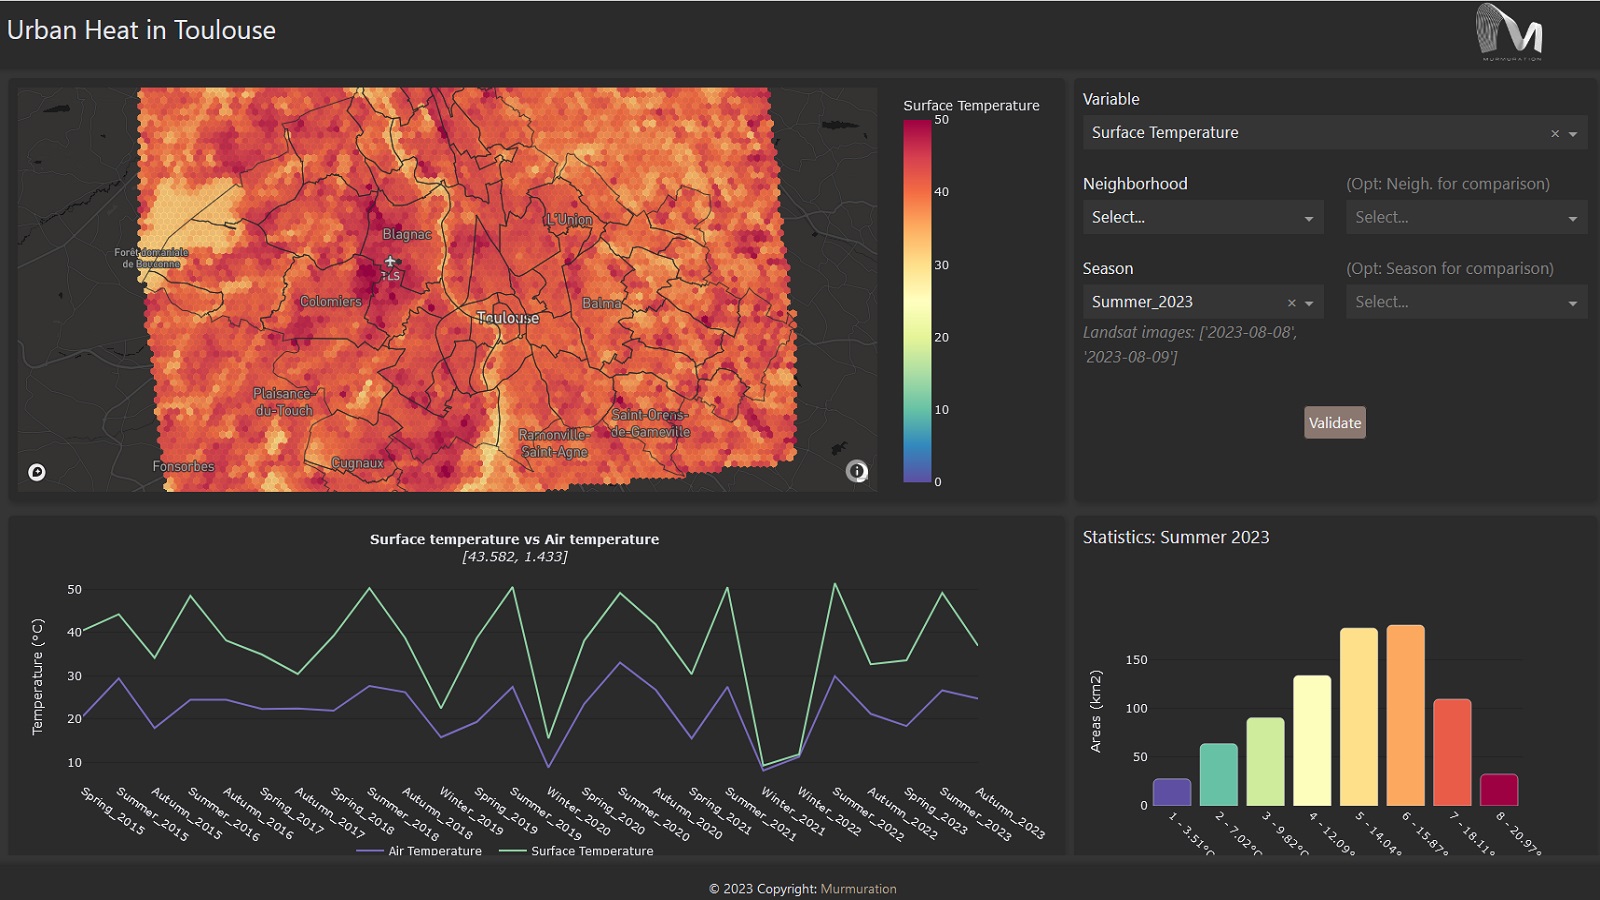
Made by Murmuration
Sea level rise
Challenge: Anticipate sea level rise and storm surges in coastal urban areas
Solution
A 30m resolution Inundation Map leveraging Copernicus Climate projections combined with elevation model
Exposure assessment for affected populations, urban areas, critical infrastructures, and cultivated lands.
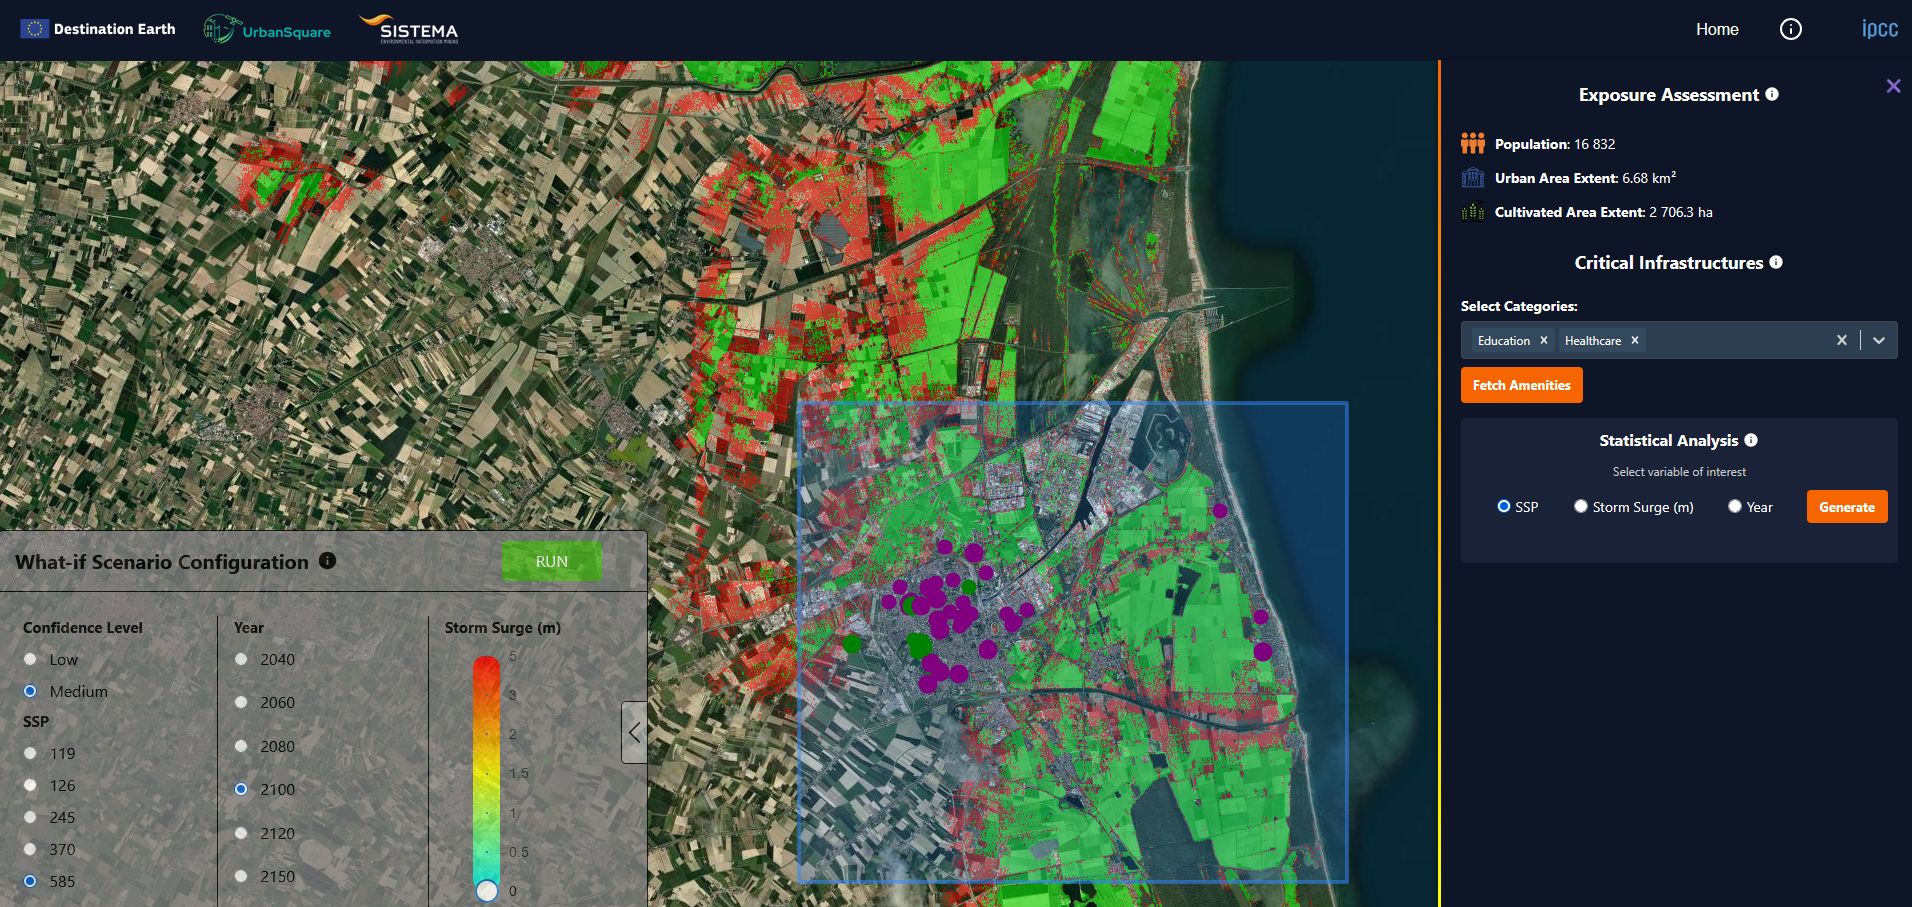
Made by Sistema
What-if Scenarios
The definition of the five Shared Socioeconomic Pathway (SSP) scenarios are described below. They range from optimistic to pessimistic scenarios.
SSP119 holds warming to approximately 1.5°C above 1850-1900 in 2100 after slight overshoot (median) and implies net zero CO2 emissions around the middle of the century.
SSP126 stays below 2.0°C warming relative to 1850-1900 (median) with implied net zero emissions in the second half of the century.
SSP245 is approximately in line with the upper end of aggregate Nationally Determined Contribution emission levels by 2030. SR1.5 assessed temperature projections for NDCs to be between 2.7 and 3.4°C by 2100, corresponding to the upper half of projected warming under SP245. New or updated NDCs by the end of 2020 did not significantly change the emissions projections up to 2030, although more countries adopted 2050 net zero targets in line with SSP119 or SSP126. The SSP245 scenario deviates mildly from a ‘no-additional- climate-policy’ reference scenario, resulting in a best-estimate warming around 2.7°C by the end of the 21st century relative to 1850-1900.
SSP370 is a medium to high reference scenario resulting from no additional climate policy under the SSP3 socioeconomic development narrative. SSP370 has particularly high non-CO2 emissions, including high aerosols emissions.
SSP585 is a high reference scenario with no additional climate policy. Emission levels as high as SSP585 are not obtained by Integrated Assessment Models (IAMs) under any of the SSPs other than the fossil fueled SSP5 socioeconomic development pathway.
When configuring the scenario, the user can choose between low and medium confidence levels, where, ad reported by the IPCC, the low confidence level indicates that there is 20% chance that the event may occur, while a 50% chance for the medium confidence level.
Infrastructure (Coming soon)
Challenge: Assessing disruption to road infrastructure caused natural disasters or norma wear and tear
Solution
High-resolution satellite-based land cover mapping
Before-and-after disaster comparisons
Historical baseline analysis
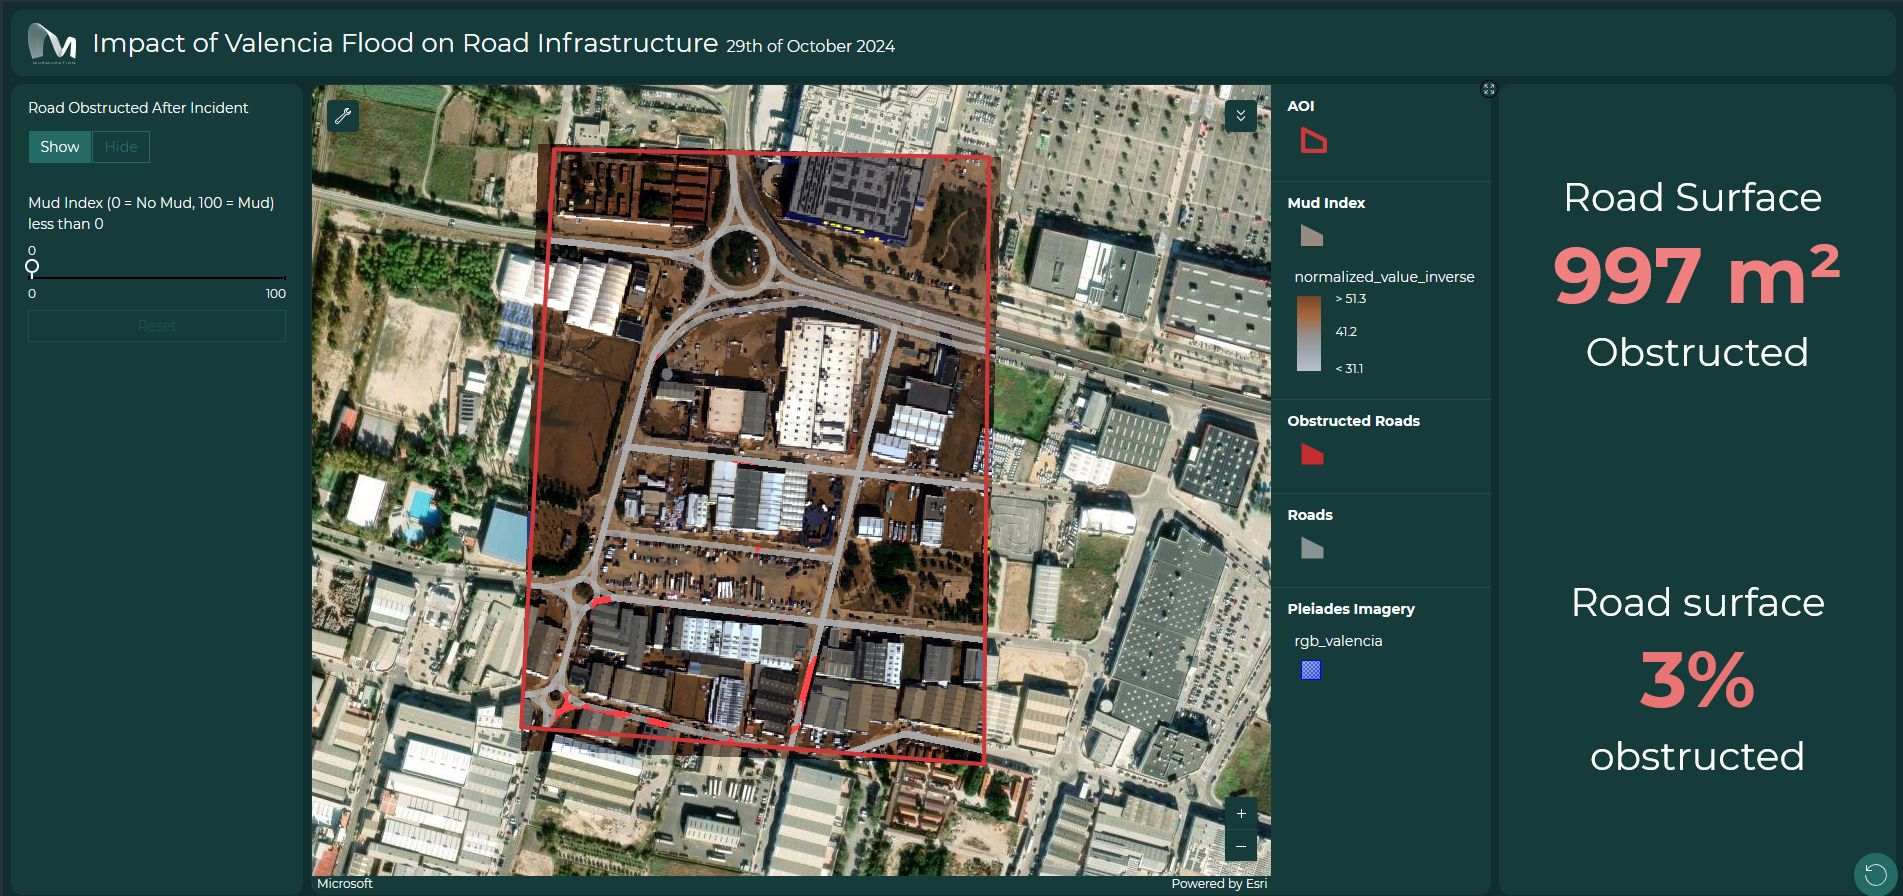
Made by Murmuration