Urban Heat Island (UHI)
The UHI section of the DESTINE platform is available at https://insula.destine.eu/perception/dashboard/ccplan/uhi
More precisely is called Surface Urban Heat Island (SUHI) and its intensity maps show the difference in temperature between urban areas and their surrounding rural areas.
By analyzing these maps, you can identify hotspots within cities and understand how urbanization affects local climate.
SUHI intensity maps comes from Land Surface Temperature (LST) data derived from satellite imagery (Landsat 8/9). The advantage of nighttime images is that surface temperature is more constant than in the daytime due to the absence of solar radiation and temperature values are dependent only on the thermal energy remitted by the Earth’s surface.
Inspect the UHI maps by choosing the city of interest as follow, then explore the map to identify hotspots and understand how urbanization affects local climate.
Stay tuned, more cities will be covered!
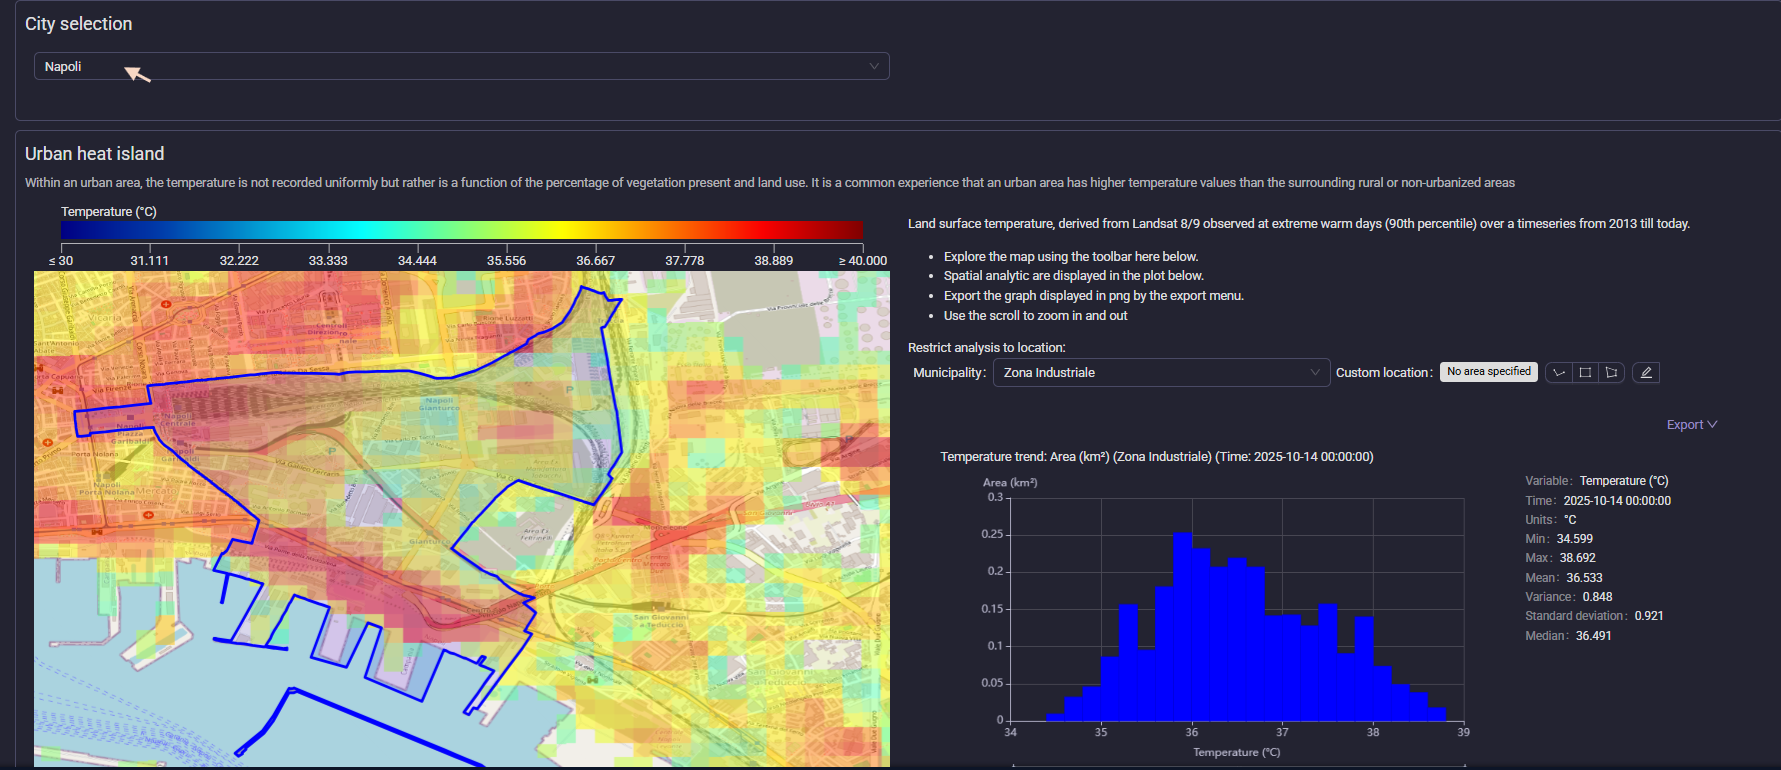
When a custom location is selected, the dashboard displays the distribution of the mapped parameters for that location across all plots on the page.
All graphs visible on the dashboard can be downloaded by clicking the Export button on the right.
The boundaries of the maps define the extent of the urban heat island itself, as determined by specific statistical criteria. Except, the land surface temperature time series, it contains all the LST maps relative to the study analysis over the city.
If none of these pages answer your question, or if you have suggestions for improvement, please contact us at https://platform.destine.eu/support.