Getting Started
This guide walks you through creating your first dashboard with EOPress, using the Raster Dashboard template as an example.
Prerequisites
You need an active account on the Destination Earth platform.
Sign in
When you open EOPress, a prompt will ask you to authenticate with your Destination Earth account.
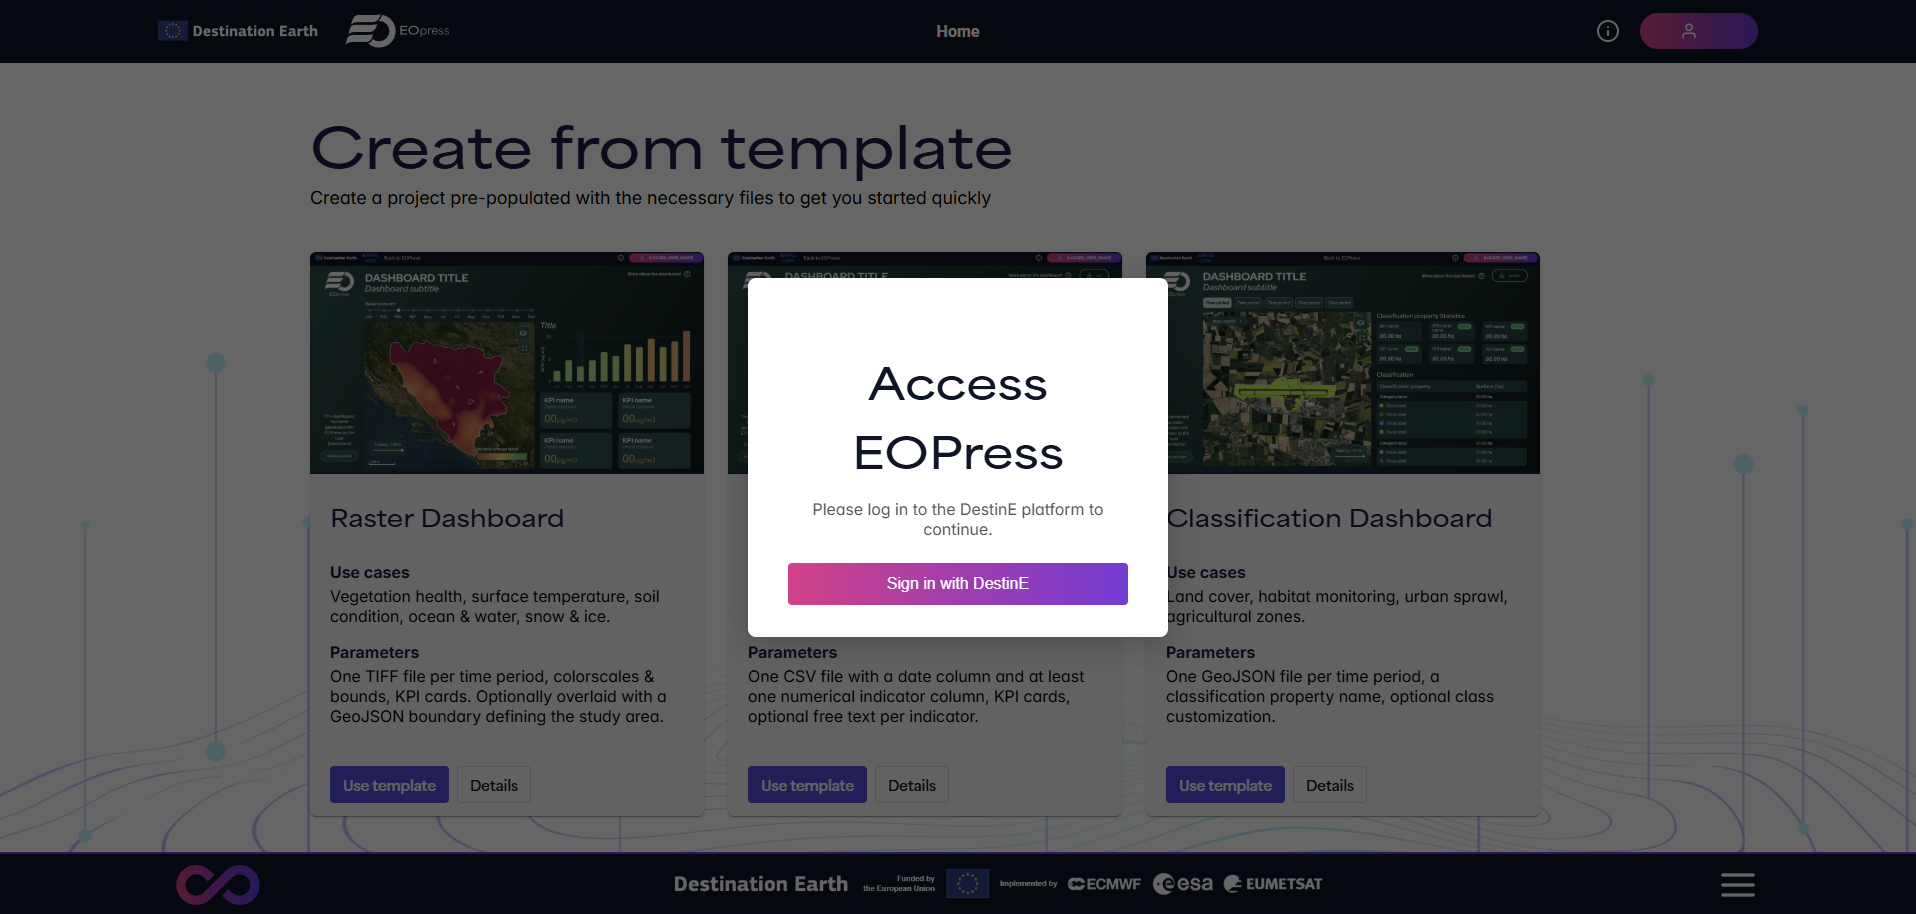
Click Sign in with DestinE to authenticate via the Destination Earth platform.
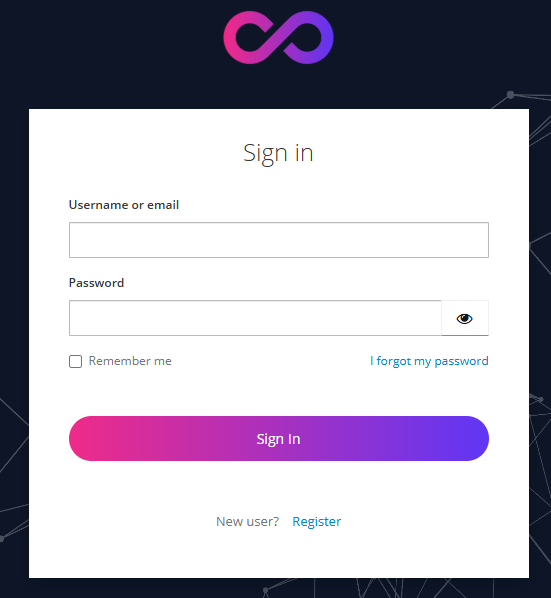
You will be redirected to the Destination Earth login page. Enter your credentials and click Sign In.
Choose a template
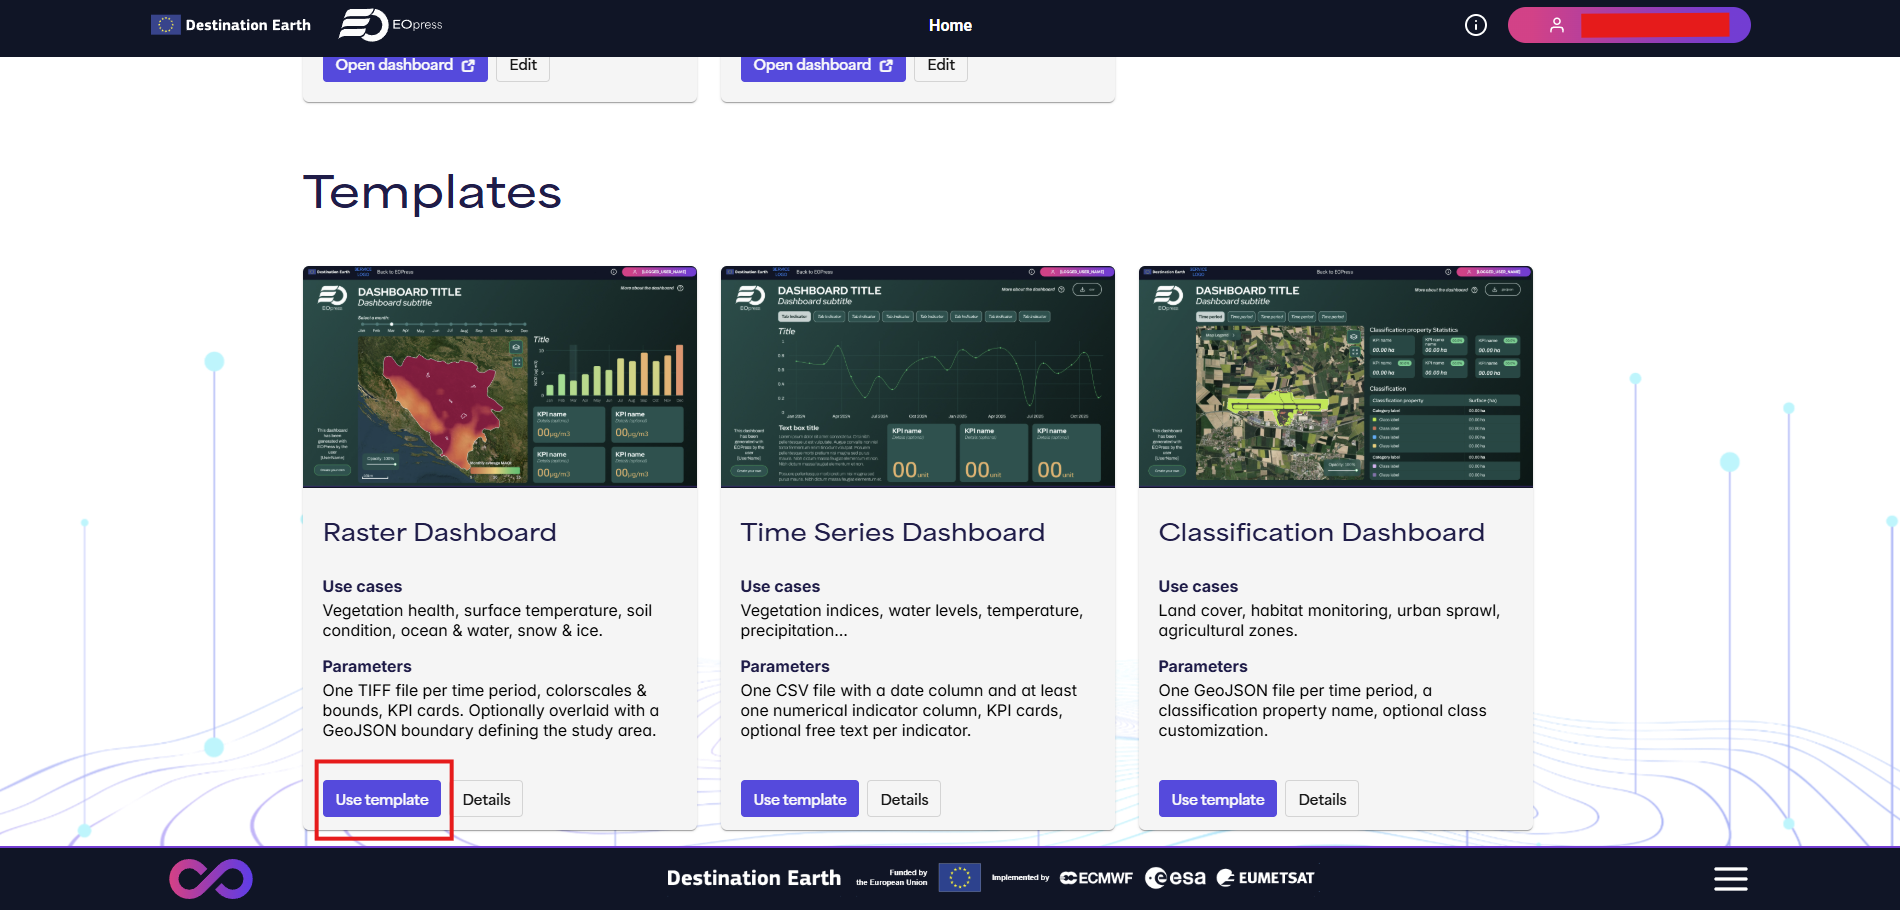
After signing in, you land on the Templates page. EOPress offers three dashboard types:
Raster Dashboard — for GeoTIFF raster data (e.g. vegetation indices, temperature maps)
Time Series Dashboard — for tabular data with at least one date column and one numerical indicator
Classification Dashboard — for categorical raster data (e.g. land use, urban sprawl)
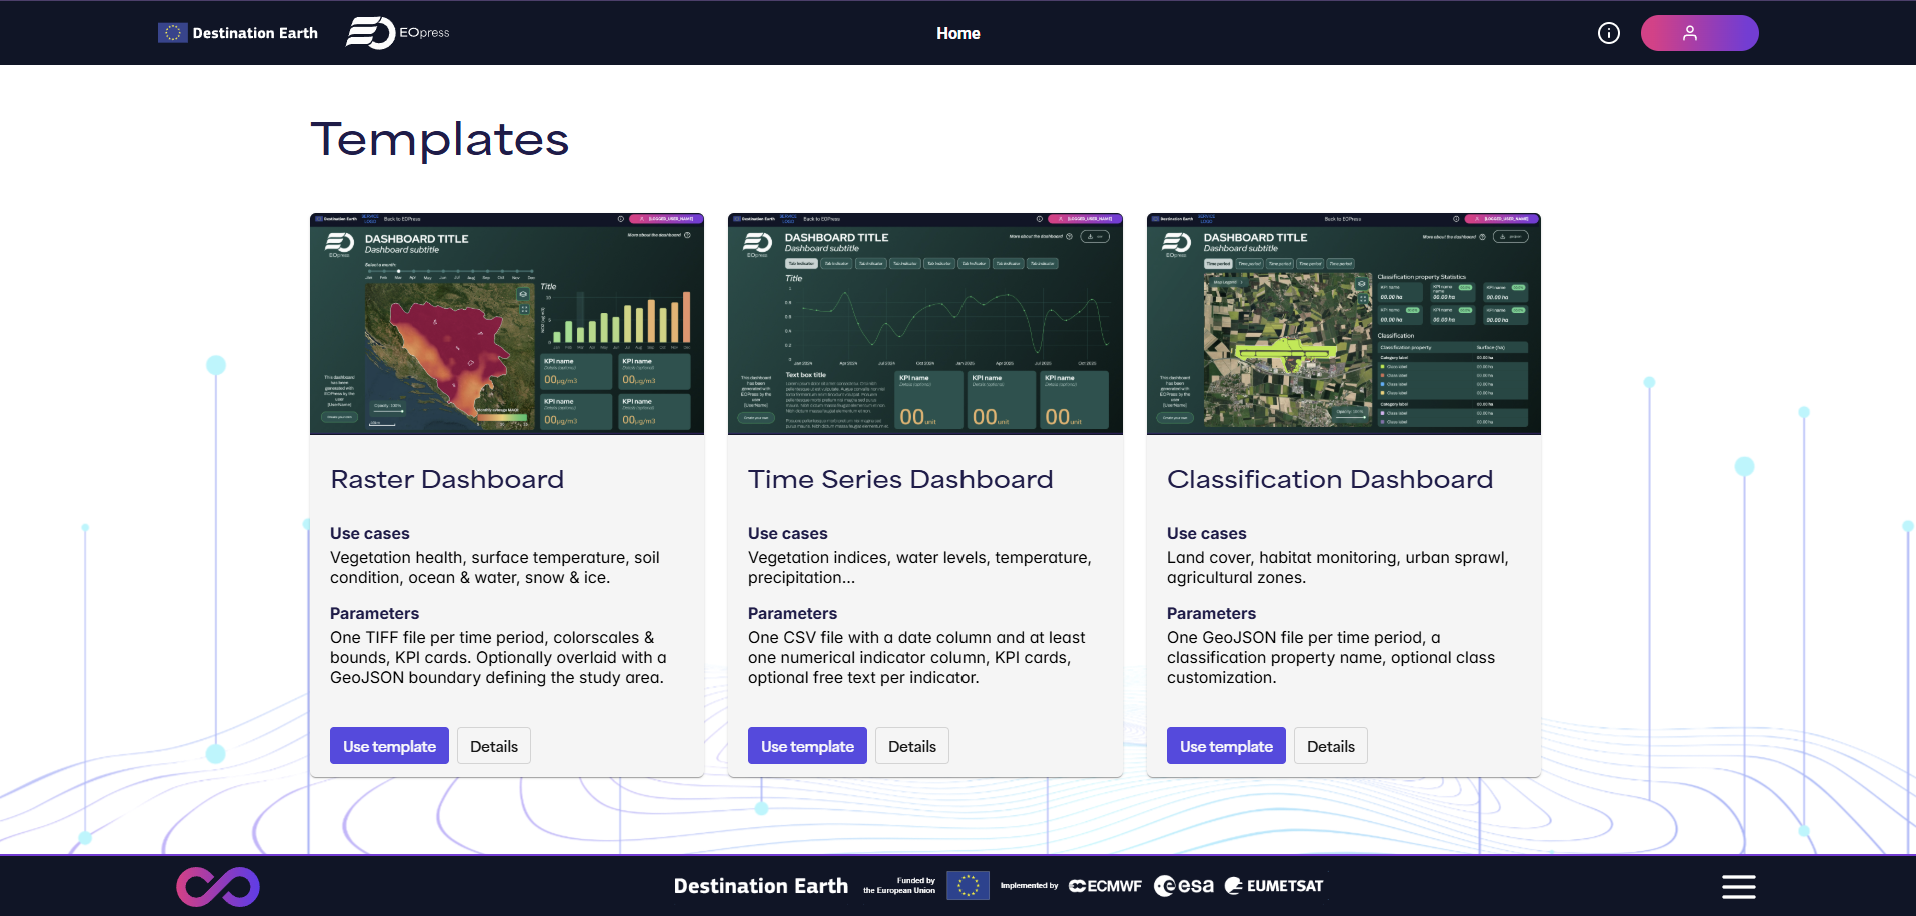
Click Use template on the template of your choice. This example uses the Raster Dashboard.
Fill in the form
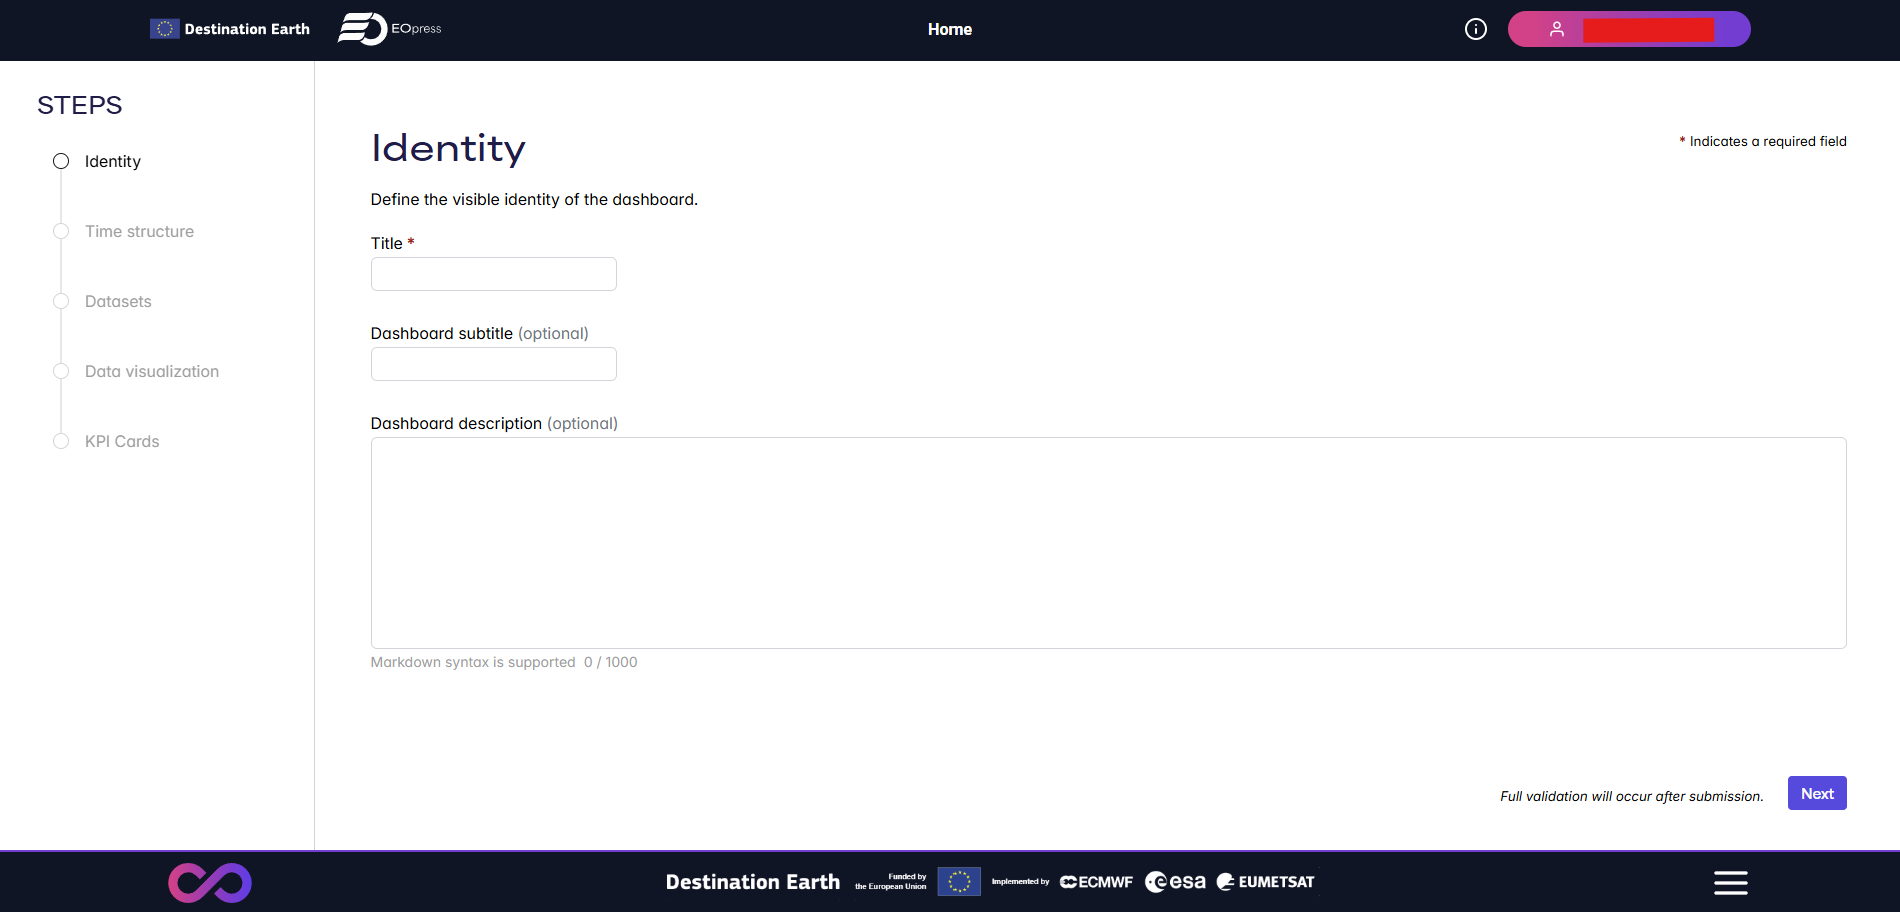
The dashboard creation form is divided into five steps, shown in the left-hand sidebar.
Step 1 — Identity
Define the visible identity of the dashboard: its title, an optional subtitle, and an optional description (Markdown syntax is supported).
Step 2 — Time structure
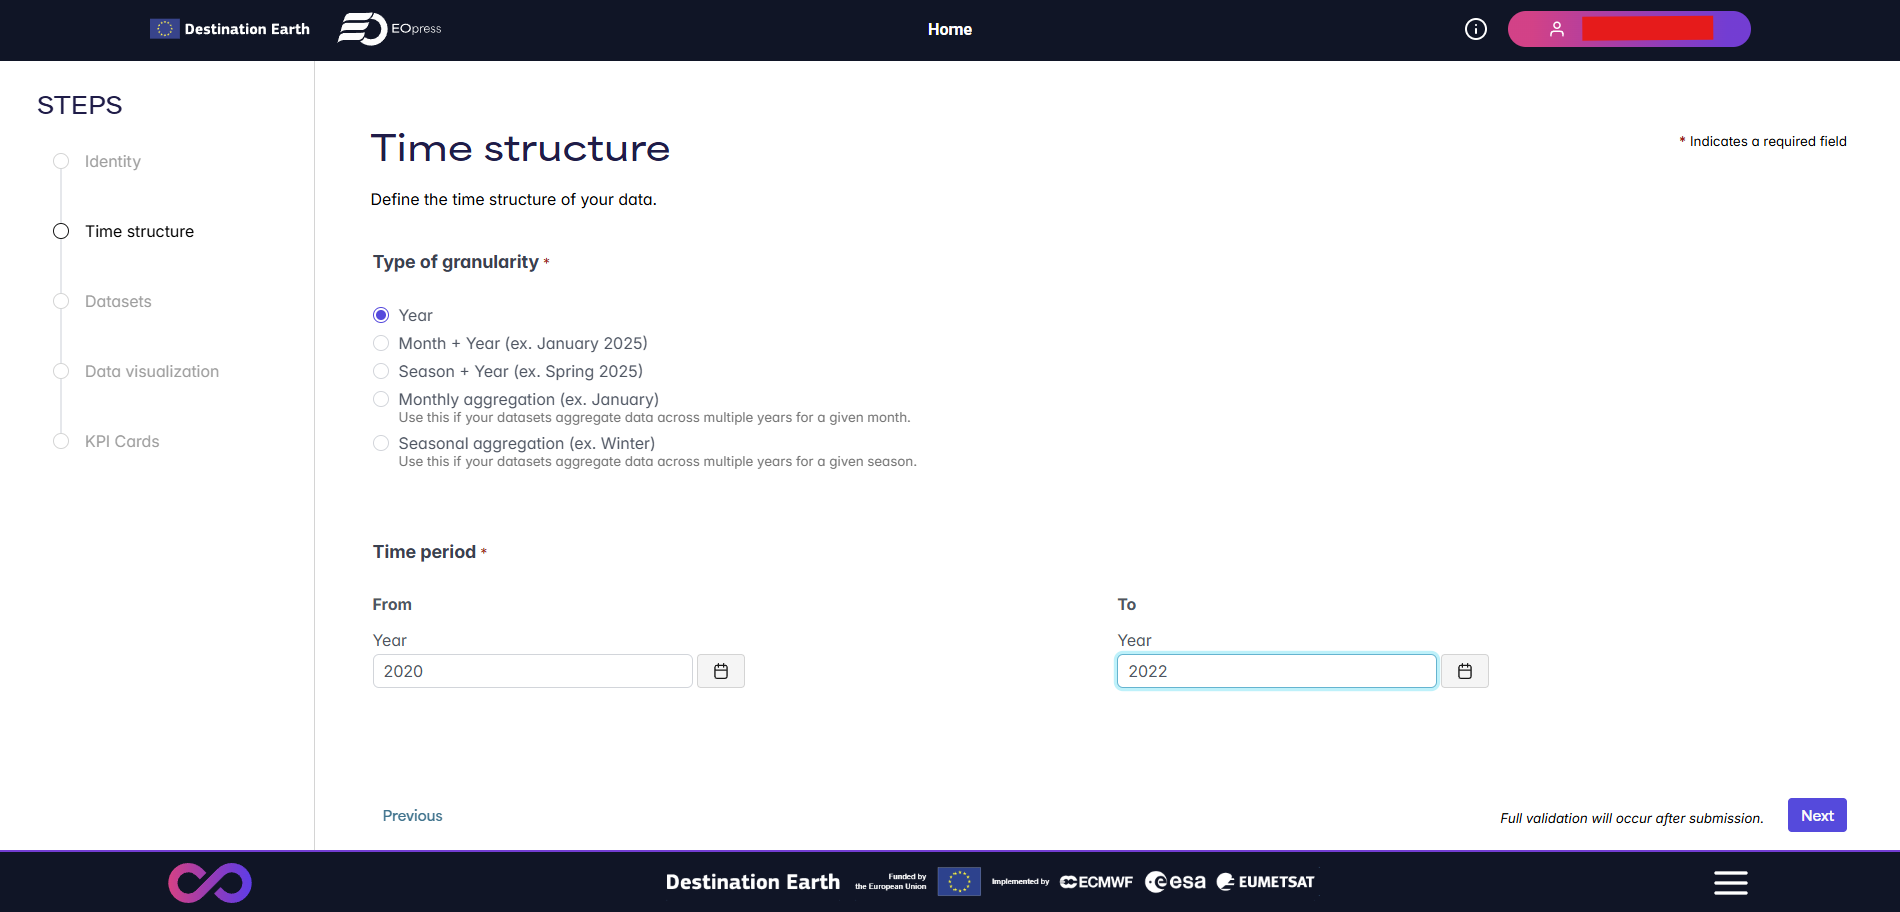
Define how your data is structured in time.
Type of granularity — choose the time resolution of your datasets (Year, Month + Year, Season + Year, Monthly aggregation, or Seasonal aggregation).
Time period — set the start and end of the period covered by your data.
Step 3 — Datasets
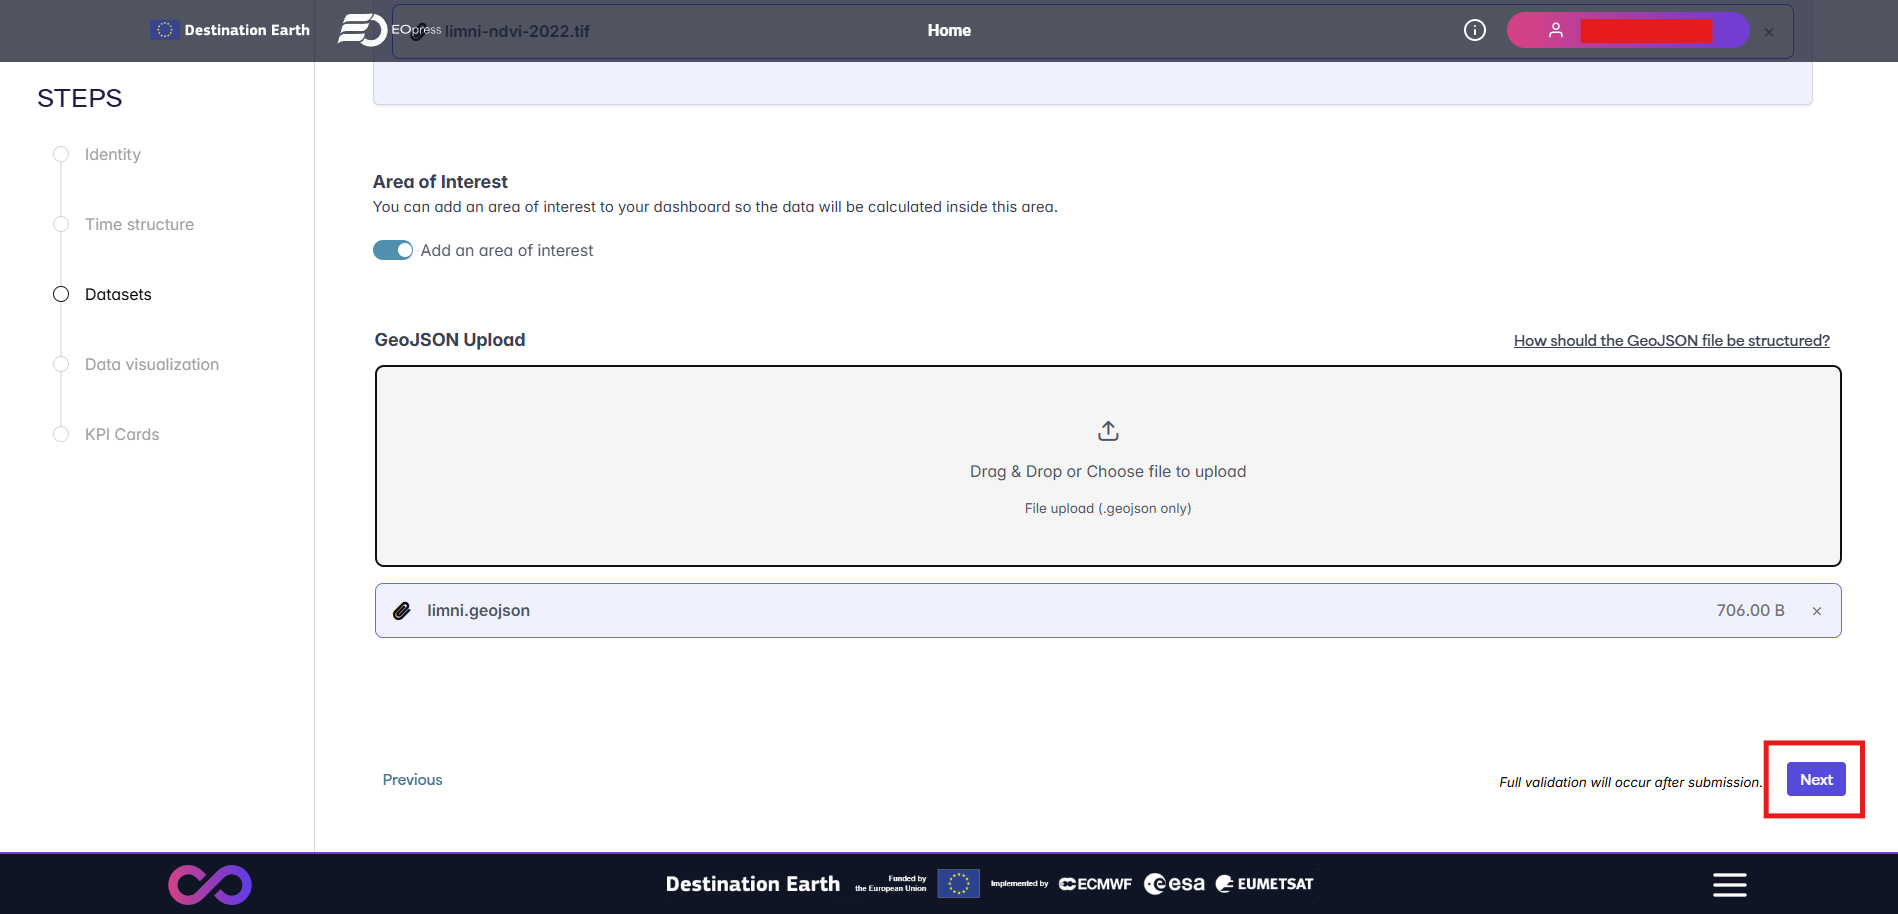
Upload one GeoTIFF file per time period. Each tab corresponds to a period derived from the time structure defined above.
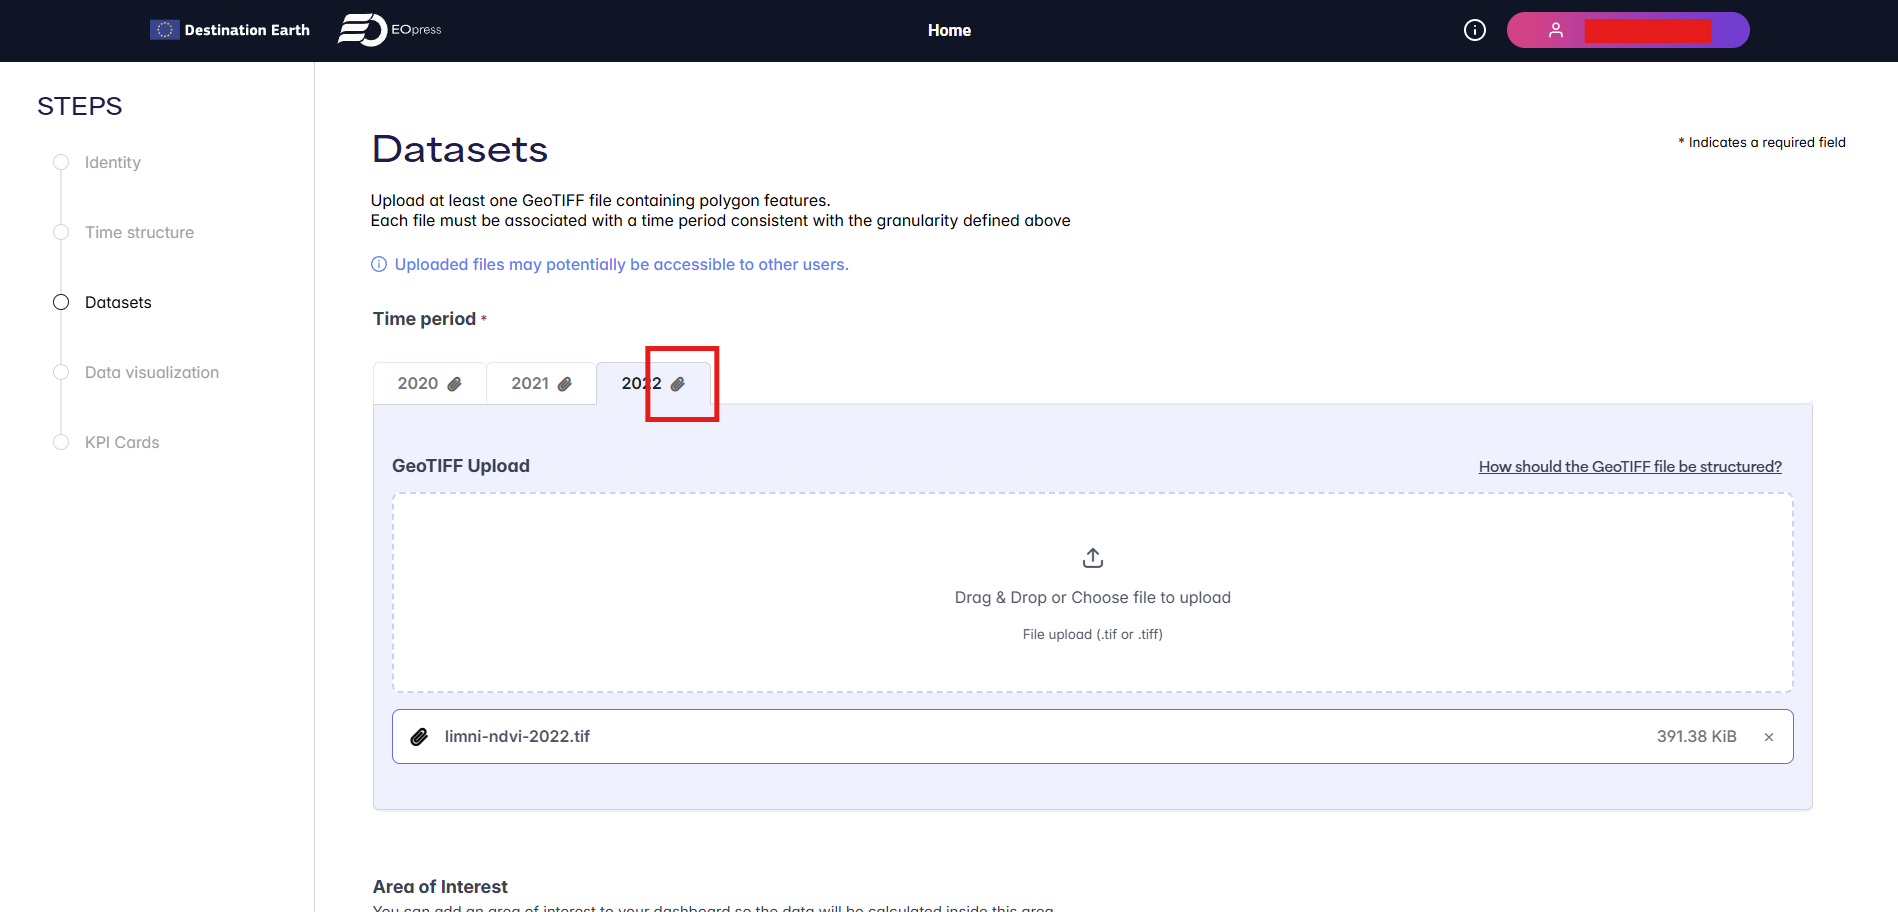
Optionally, enable Add an area of interest and upload a GeoJSON file. The data will then be computed only within that area.
Step 4 — Data visualization
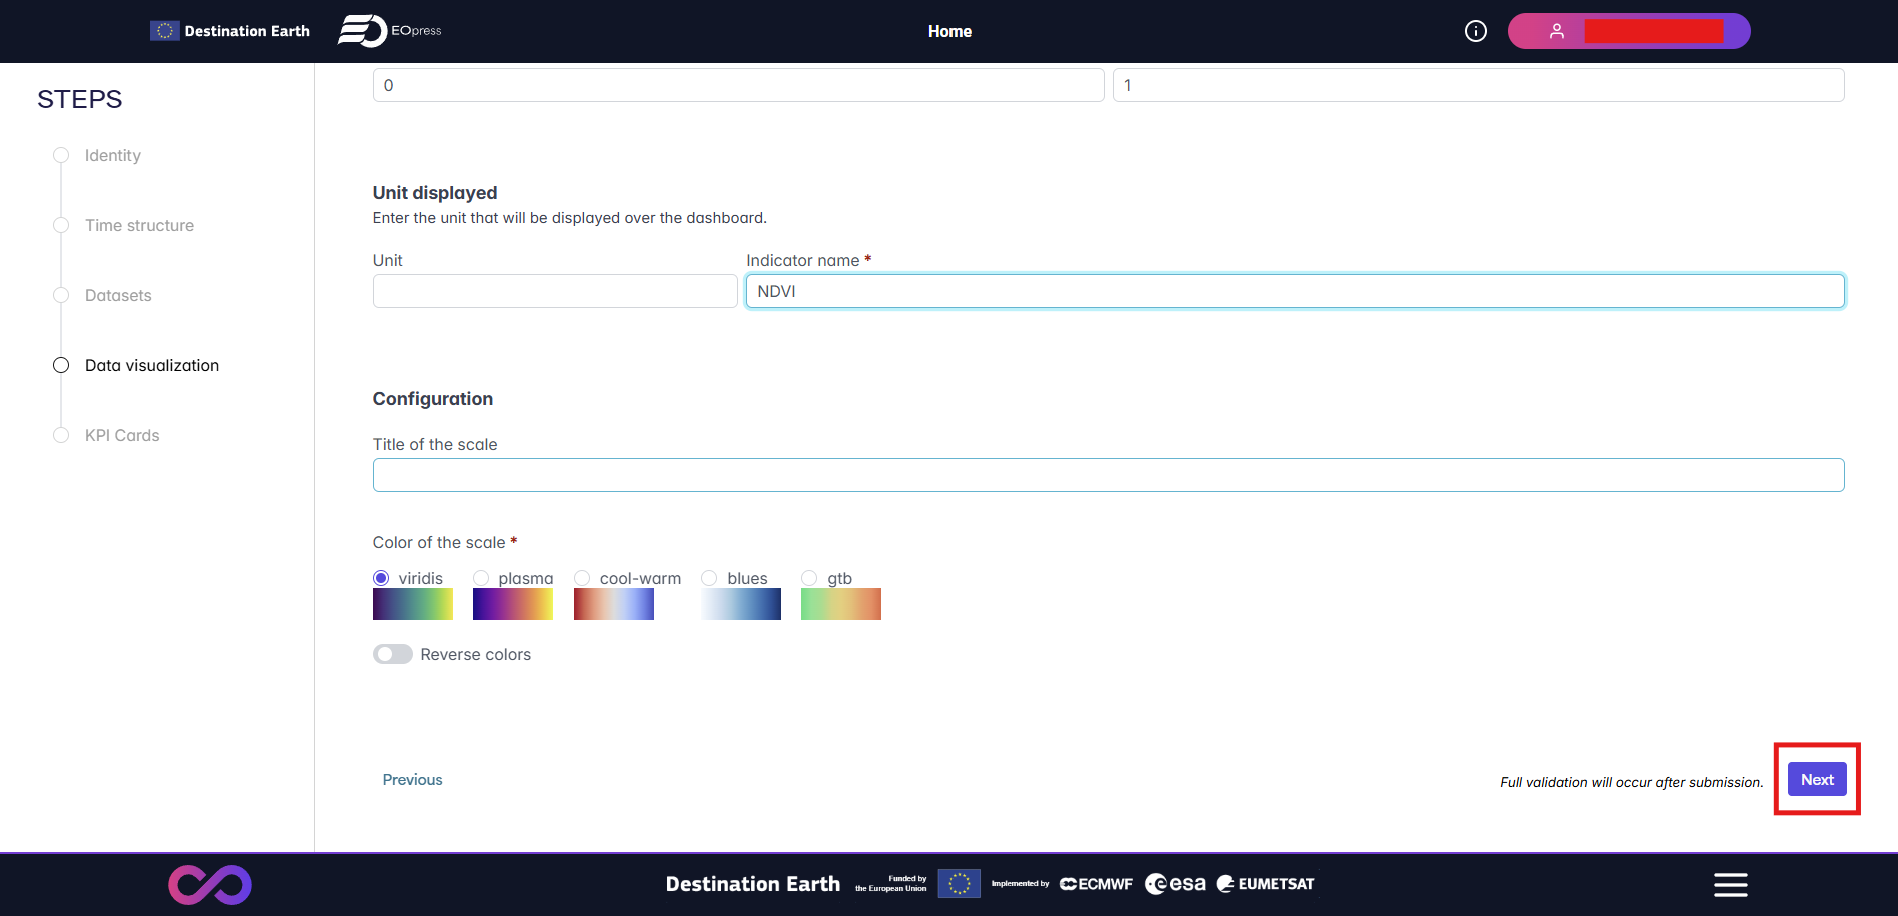
Configure how the raster data is rendered on the map:
Value range — the min and max values used to stretch the color scale.
Unit displayed — the unit shown on the dashboard (optional).
Indicator name — the label for the variable being visualized.
Color of the scale — choose from viridis, plasma, cool-warm, blues, or gtb. You can also reverse the color ramp.
Step 5 — KPI Cards
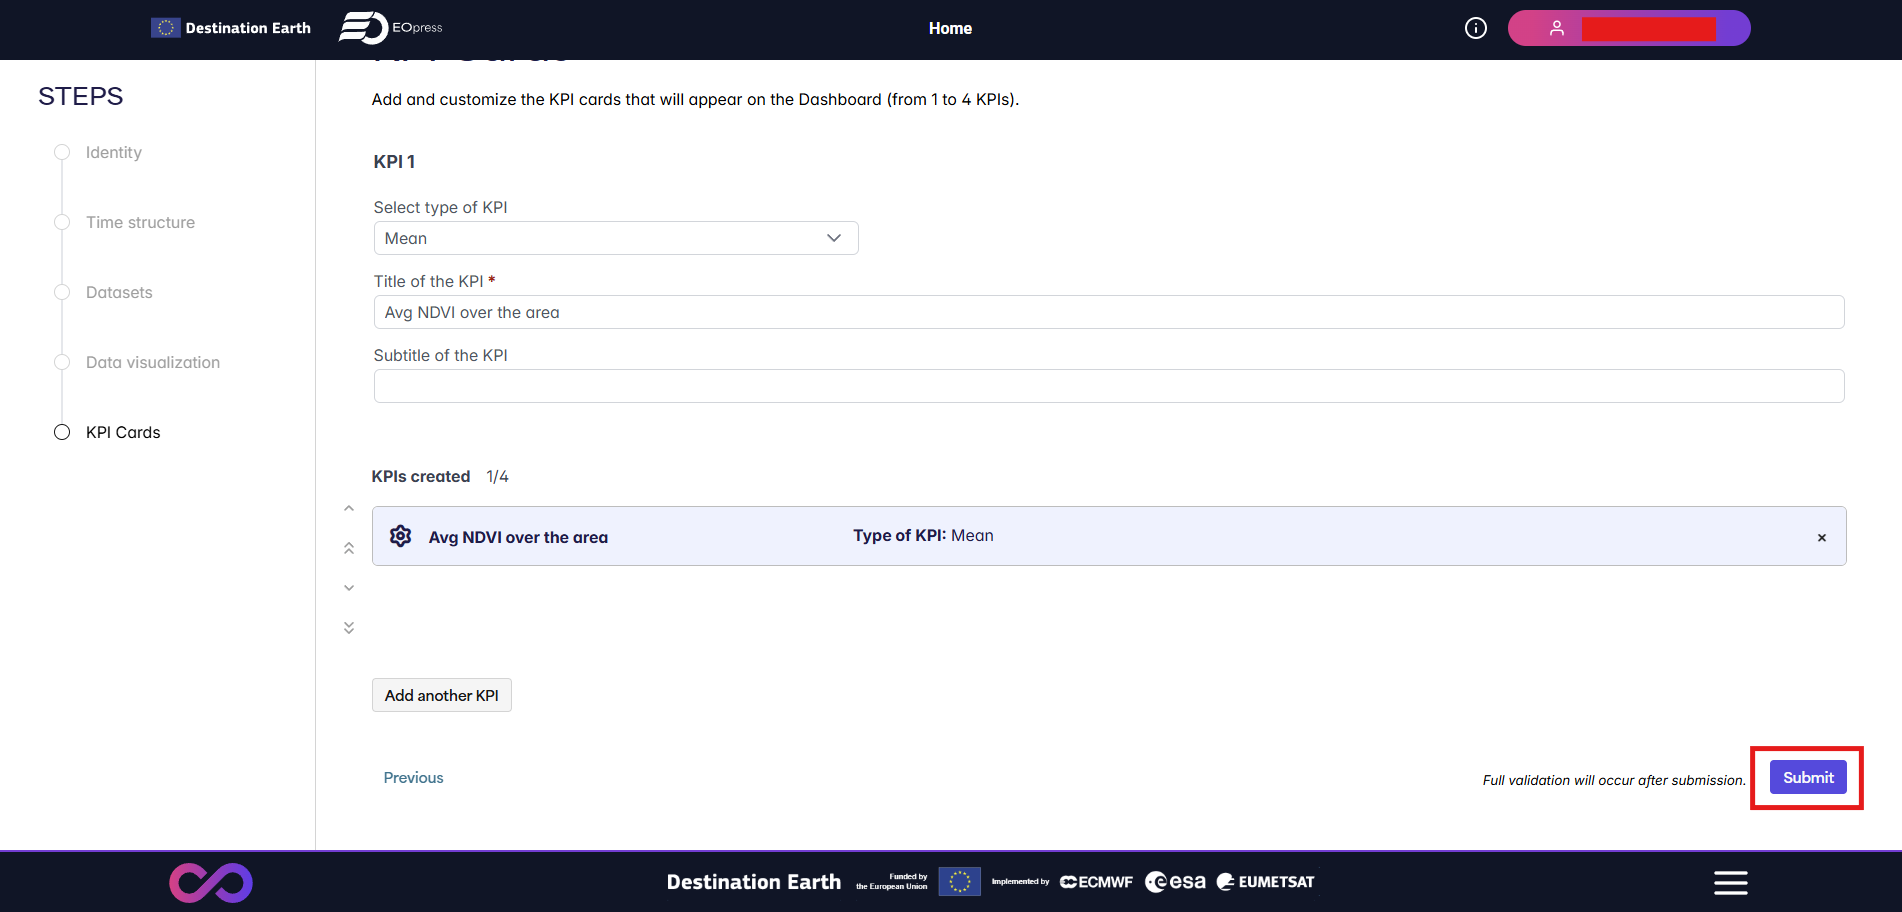
Add between 1 and 4 KPI cards to summarize key statistics on your dashboard. For each KPI, select the aggregation type (e.g. Mean, Min, Max) and give it a title and an optional subtitle.
Once you are satisfied with your KPIs, click Submit.
Processing
After submission, EOPress validates and processes your files. You can monitor the progress on screen. The steps are:
File validation
GeoTIFF readability check
COG pre-validation
Band integrity check
Pixel value statistics
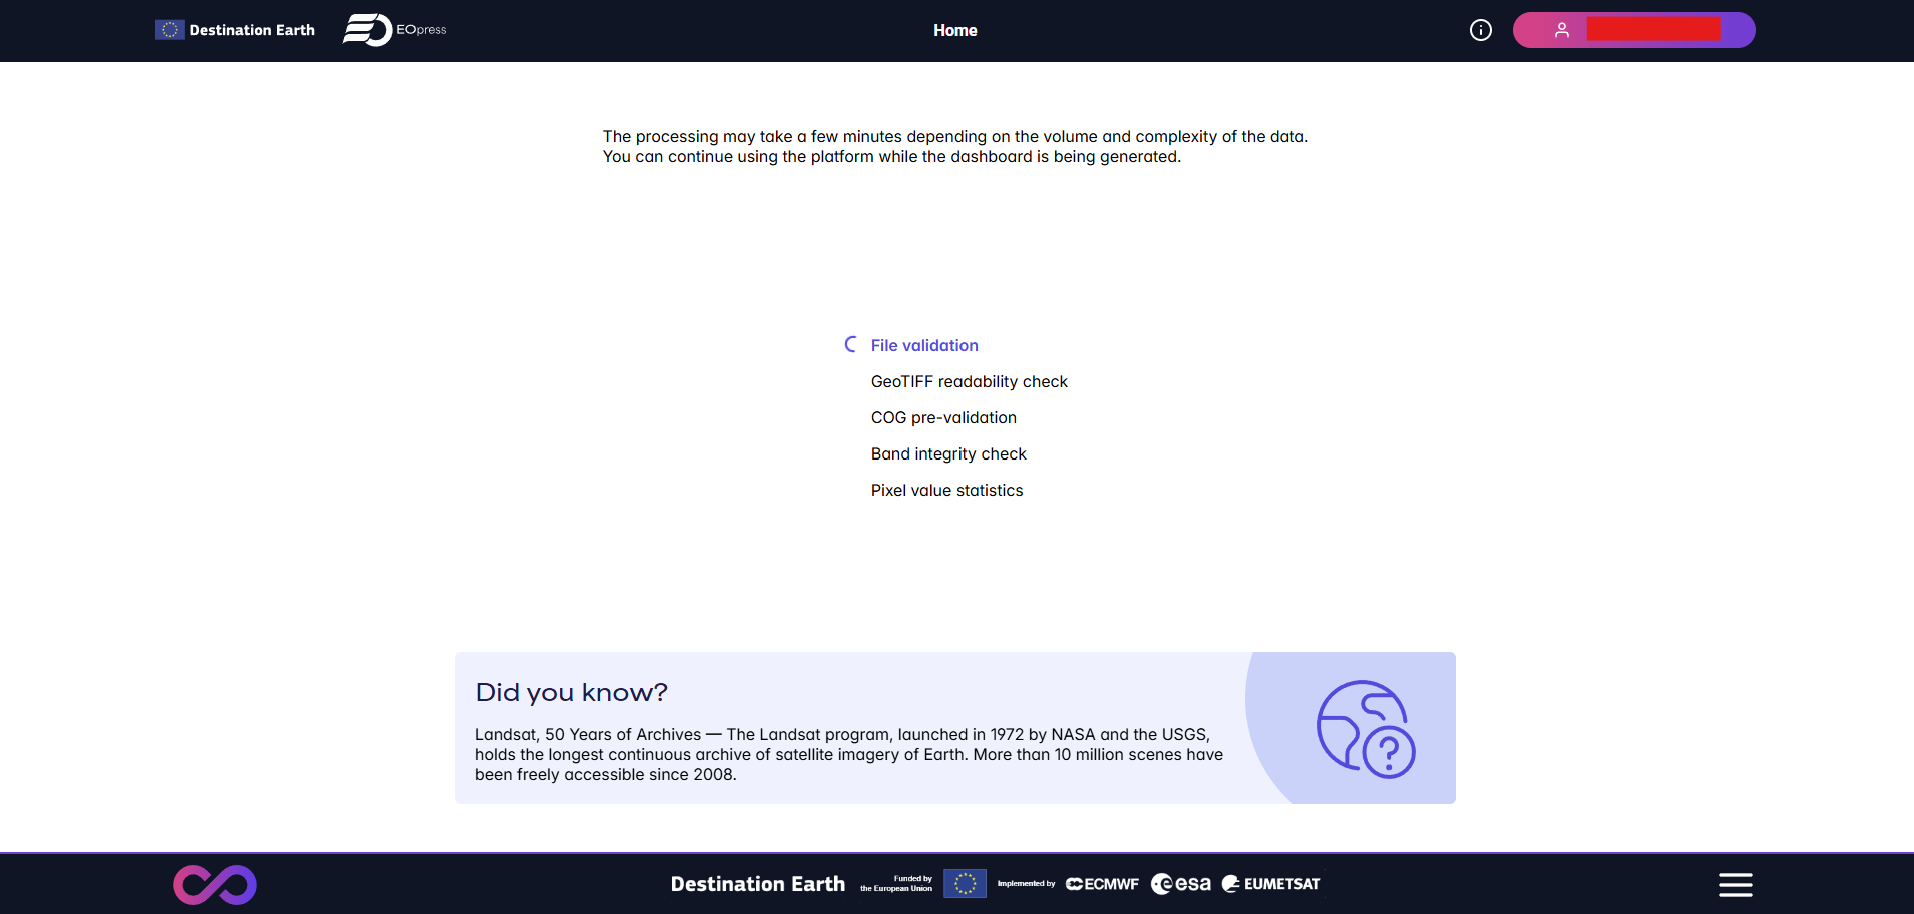
Processing may take a few minutes depending on the volume and complexity of the data. You can continue using the platform while the dashboard is being generated.
Access your dashboard
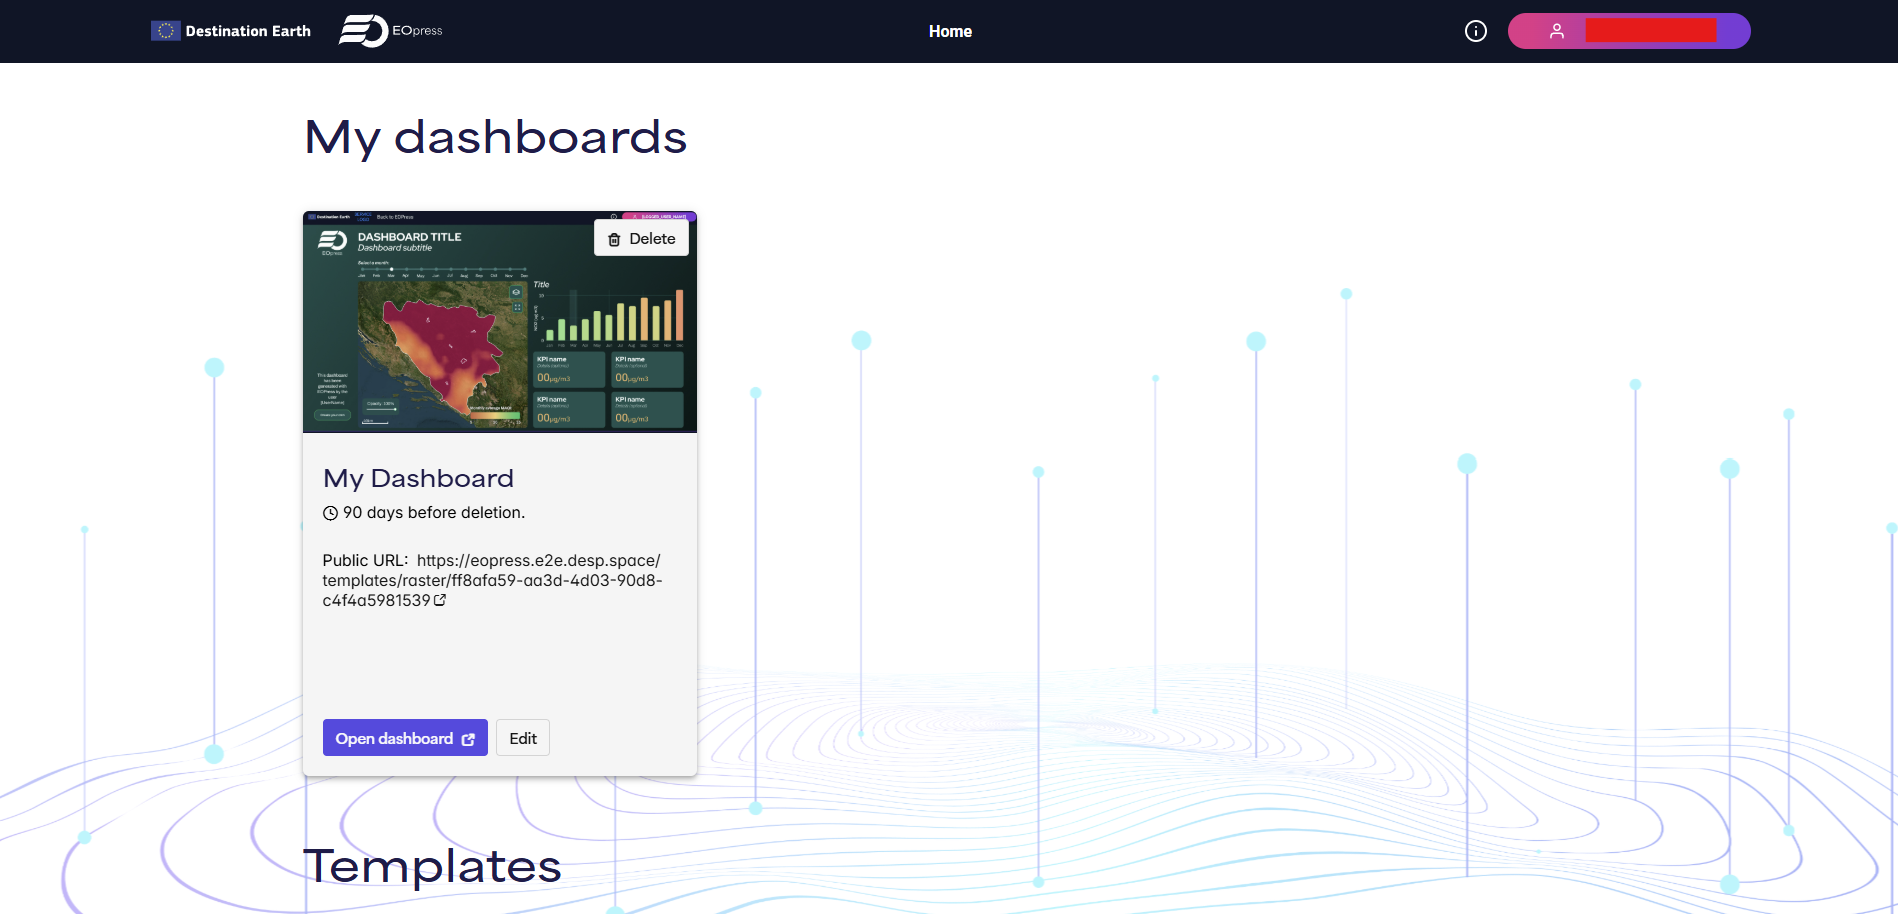
Once processing is complete, the dashboard appears in My dashboards. From there you can open it or edit it.