EOPress Documentation

Are you working with geospatial data and want to turn it into an interactive dashboard?
Or perhaps, looking to monitor an environmental indicator over time across a specific area?
EOPress lets you create ready-to-share geospatial dashboards directly from your own datasets, without writing a single line of code.
What is EOPress?
EOPress is a web-based application on the Destination Earth platform that enables users to generate interactive dashboards from geospatial datasets. Starting from a template, users upload their data, configure the visualization, and get a shareable dashboard in minutes.
Who Benefits from EOPress?
EOPress is designed for anyone working with geospatial data:
Earth Observation researchers who want to share results visually without building a custom tool
Environmental scientists monitoring indicators such as vegetation health, temperature, or land cover over time
Urban planners analyzing spatial data across a defined area of interest
Data teams looking to quickly prototype dashboards from GeoTIFF or CSV datasets
EOPress removes the technical barrier between raw geospatial data and communicable, shareable visualizations.
How Does It Work?
EOPress processes your data through a guided multi-step form:
Template selection: Choose the dashboard type that matches your data structure
Time structure: Define the temporal resolution and period covered by your datasets
Dataset upload: Upload one file per time period, with an optional area of interest
Visualization configuration: Set the color scale, value range, indicator name, and KPI cards
Automated validation: EOPress checks file format, readability, and data integrity before generating the dashboard
Dashboard Templates
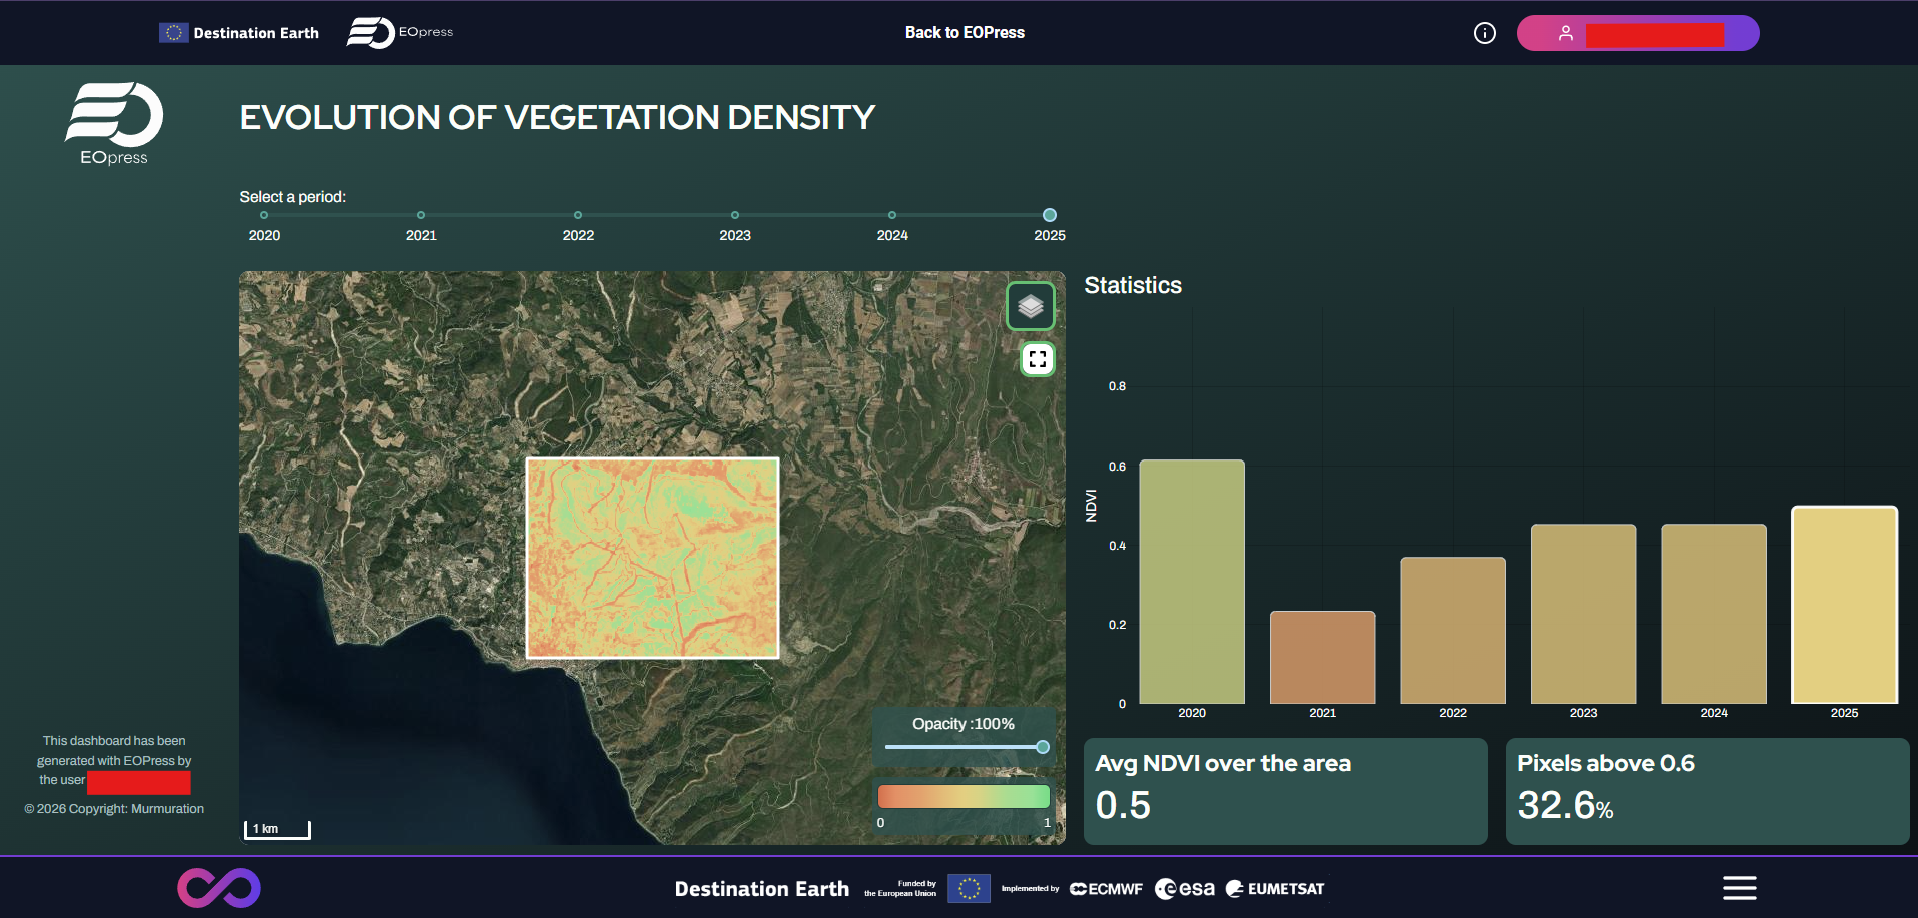
Raster Dashboard — for GeoTIFF raster data (vegetation indices, temperature maps, surface reflectance, etc.)
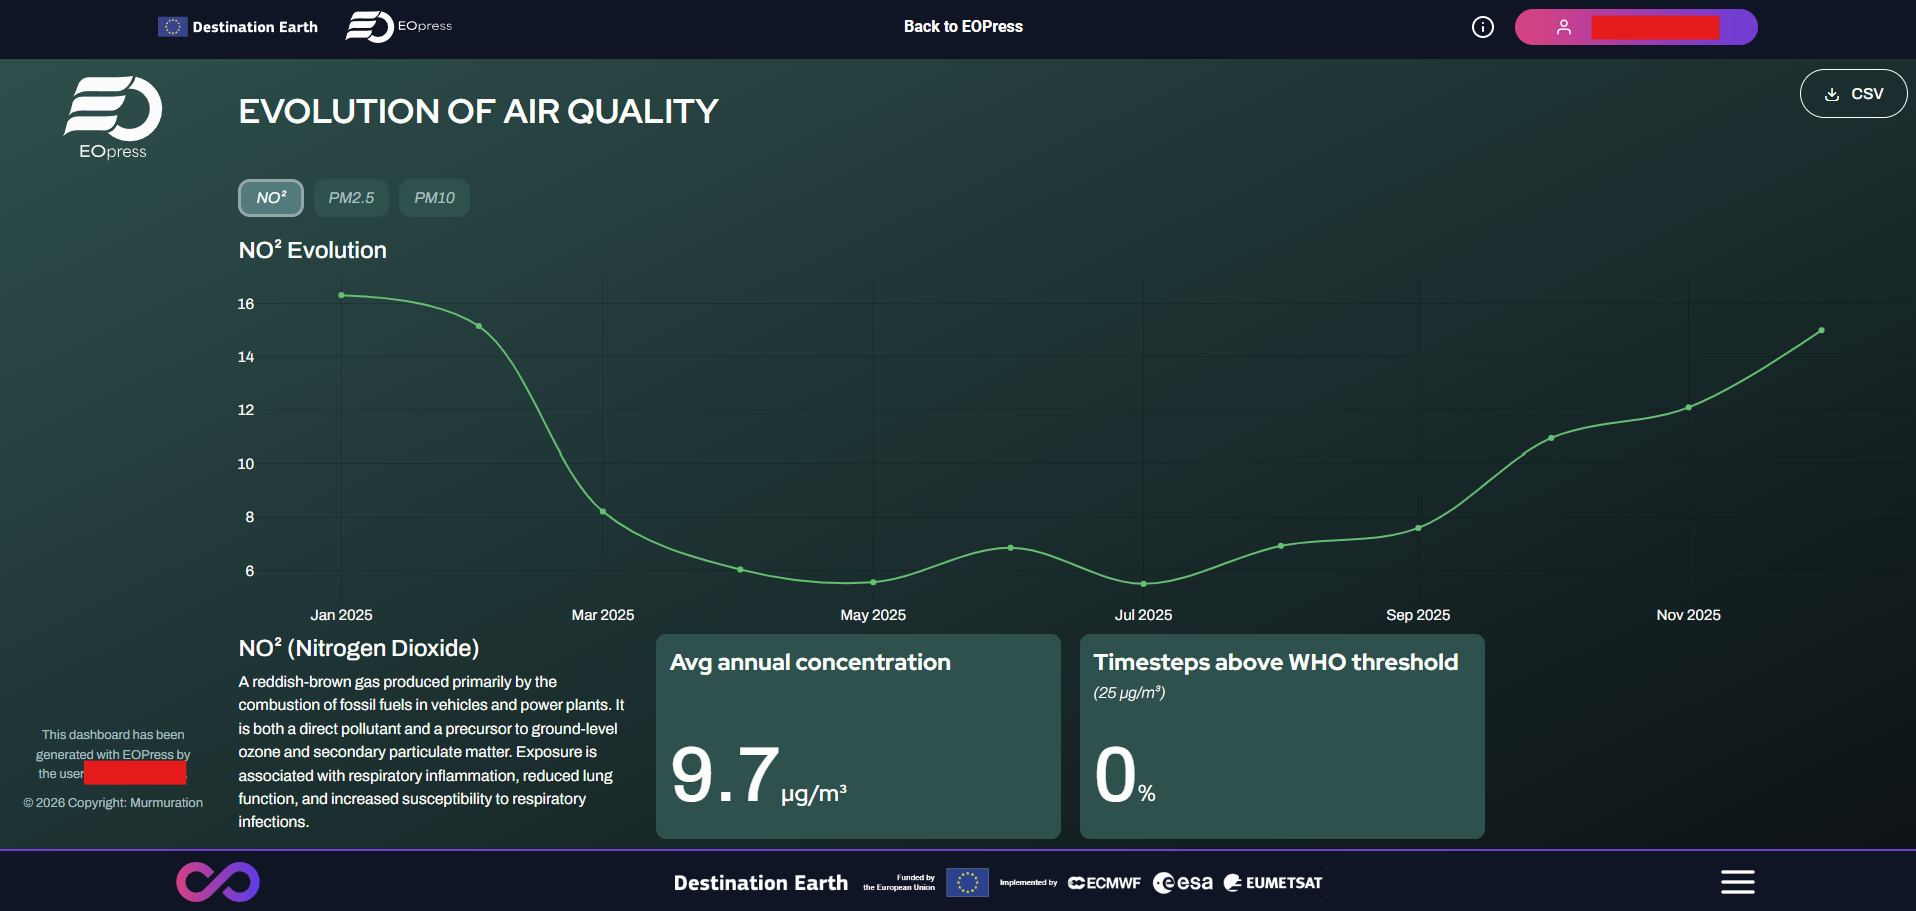
Time Series Dashboard — for tabular CSV data with a date column and one or more numerical indicators
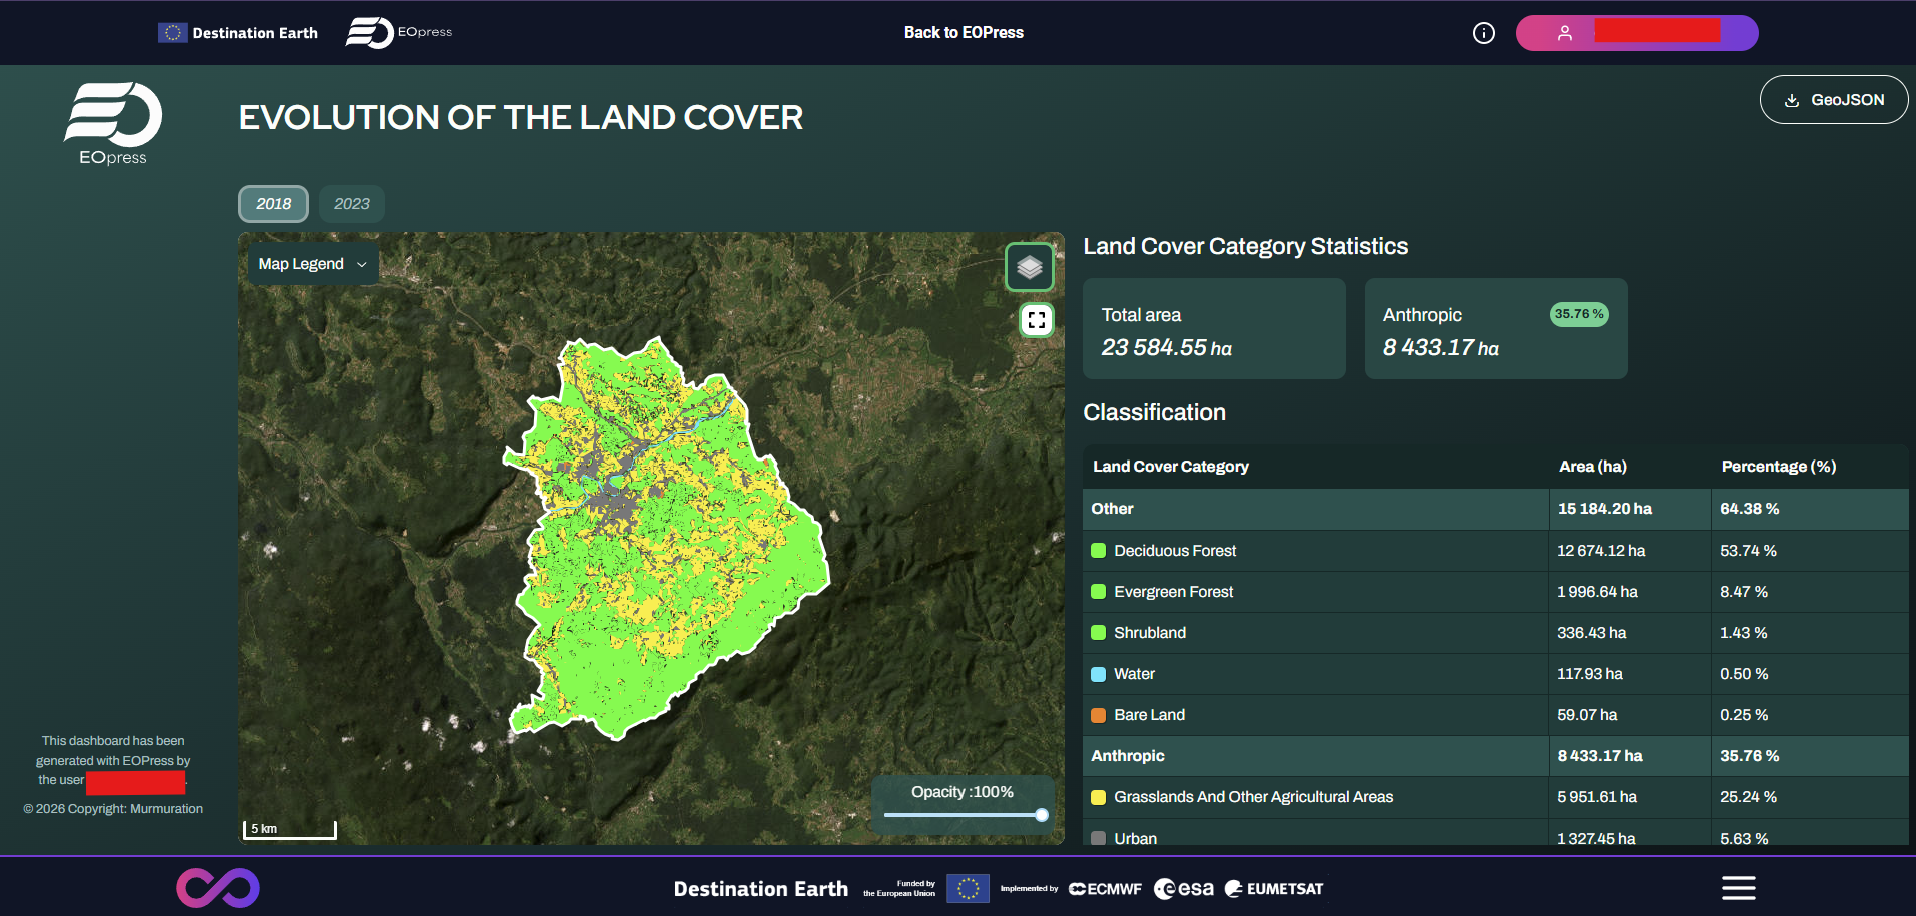
Classification Dashboard — for categorical vectorial data (land use, urban sprawl, habitat classification, etc.)
Requirements & Limits
Supported input formats
GeoTIFF (.tif / .tiff) for raster dashboards
CSV for time series dashboards
GeoJSON for classification dashboards and areas of interest
Quotas
Dashboard generation is free of charge
Each user is allowed to create up to 3 active dashboards
Dashboards are automatically deleted after 90 days