User Manuals for Graphical and Technical Service Access
Introduction
This guide helps you to understand the Hi-Res-LST service and how to effectively use it. The Hi-Res LST service offers two different ways to access its features:
Graphical User Interface (specially designed for a large audience including non-expert users)
API for technical access (addressing users with technical background)
The central elements of this user guide are integrated into the design of the graphical user interface, and can be accessed activating the help mode and clicking on yellow-highlight question marks.
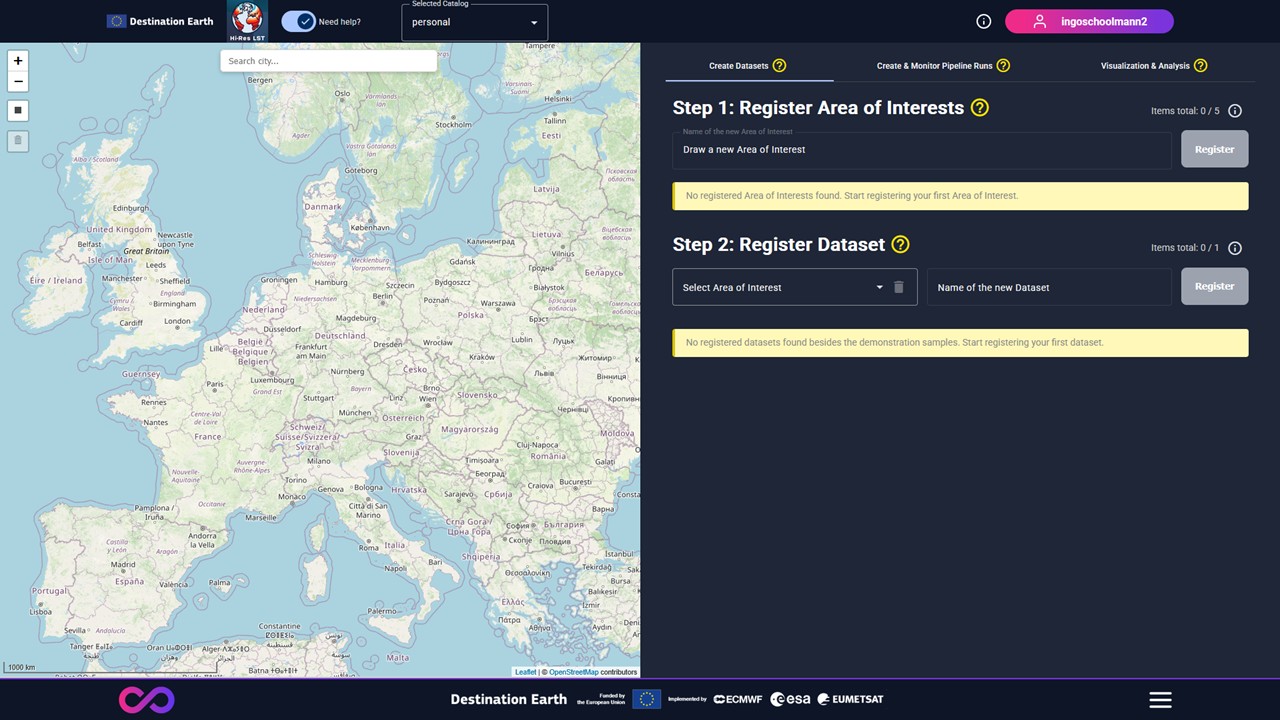
Figure 1: View on the Graphical User Interface when entering the Hi-Res-LST service with activated help mode.
Terminology
An Area of Interest is the geometry which determines where land surface temperature information is required.
A Pipeline Run represents a chain of different processing steps that eventually delivers the requested land surface temperature information in line user-defined temporal coverage.
A Dataset is linked to an Area of Interest and represents the data cube that collects the land surface temperature information produced by pipeline runs.
A Place is a geographical entity (points or user-defined areas) for which time series data can be requested.
User Guide for Graphical Service Access
The service’s graphical user interface (GUI) is composed of two main sections. The lefthand side provides geographical orientation showing Area of Interests and supports visual inspection of the service results, while the right section offers the three purpose-specific views which are:
Create Datasets: Create your Area of Interests and register datasets that are used to store processed the land surface temperature information.
Create & Monitor Pipeline Runs: Selecting a registered Dataset, register and monitor on-demand pipeline runs, that fills the dataset with land surface temperature information according to the requested the temporal coverages.
Visualization & Analysis: Once a pipeline runs is completed, investigate the resulting land surface temperature information by visual as well as numerical inspection.
The views are organized in horizontal tabs, which you can navigate by clicking on the respective tab headers. See following figure for reference:
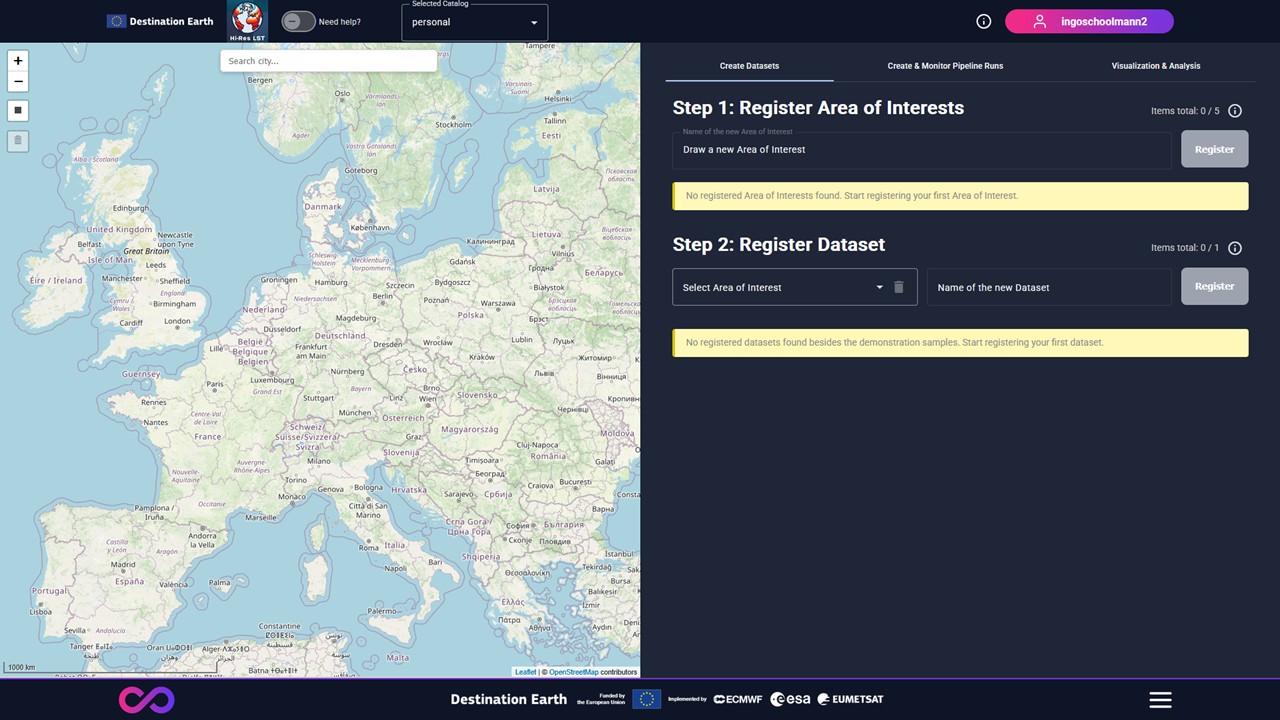
Figure 2: Organization of the service web interface components.
Part 1: Create Area of Interests and register linked datasets
Create Area of Interests and register Datasets that are used to store processed the land surface temperature information.
Figure 3: View on the Graphical User Interface Tab Create Datasets.
Step 1: Register Area of Interests
Workflow
A new Area of Interest (of fixed size) can be placed on the map using the drawing toolbar.
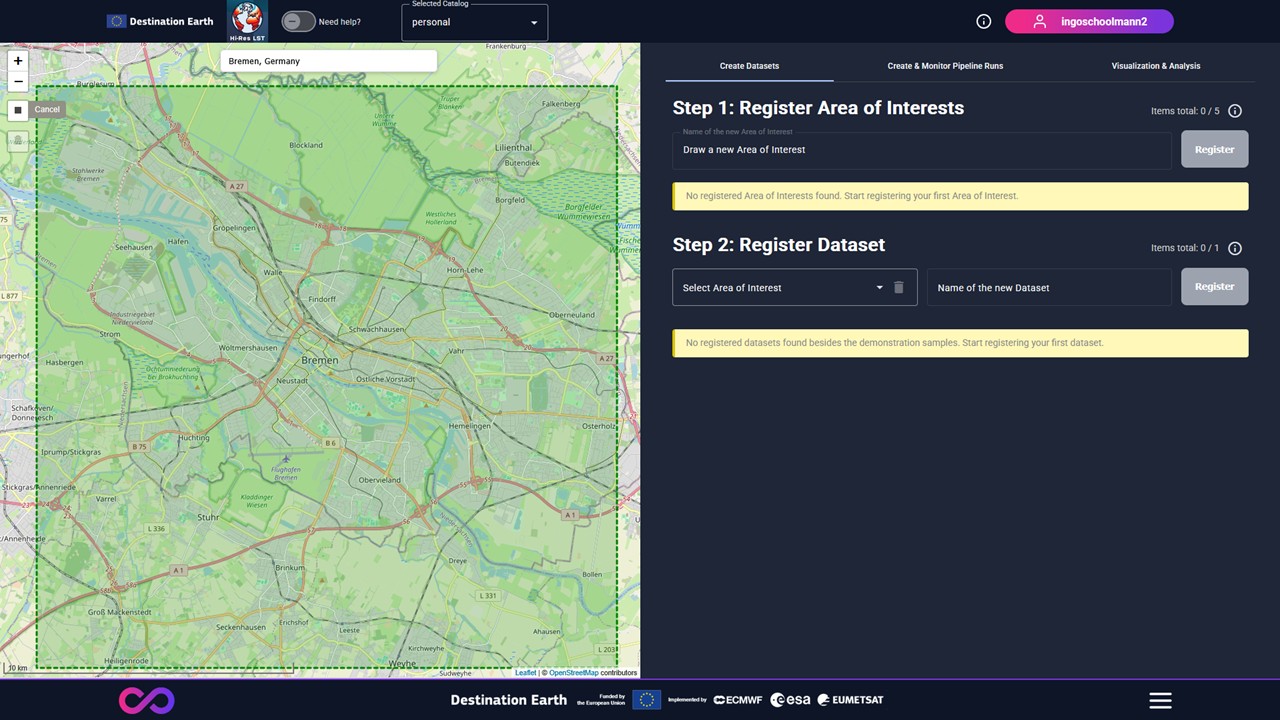
Figure 4: A new Area of Interest (of fixed size) can be placed on the map using the drawing toolbar.
Once the Area of Interest is placed, a pop-up appears that requires a name of the new Area of Interest, which must be unique for each user account.
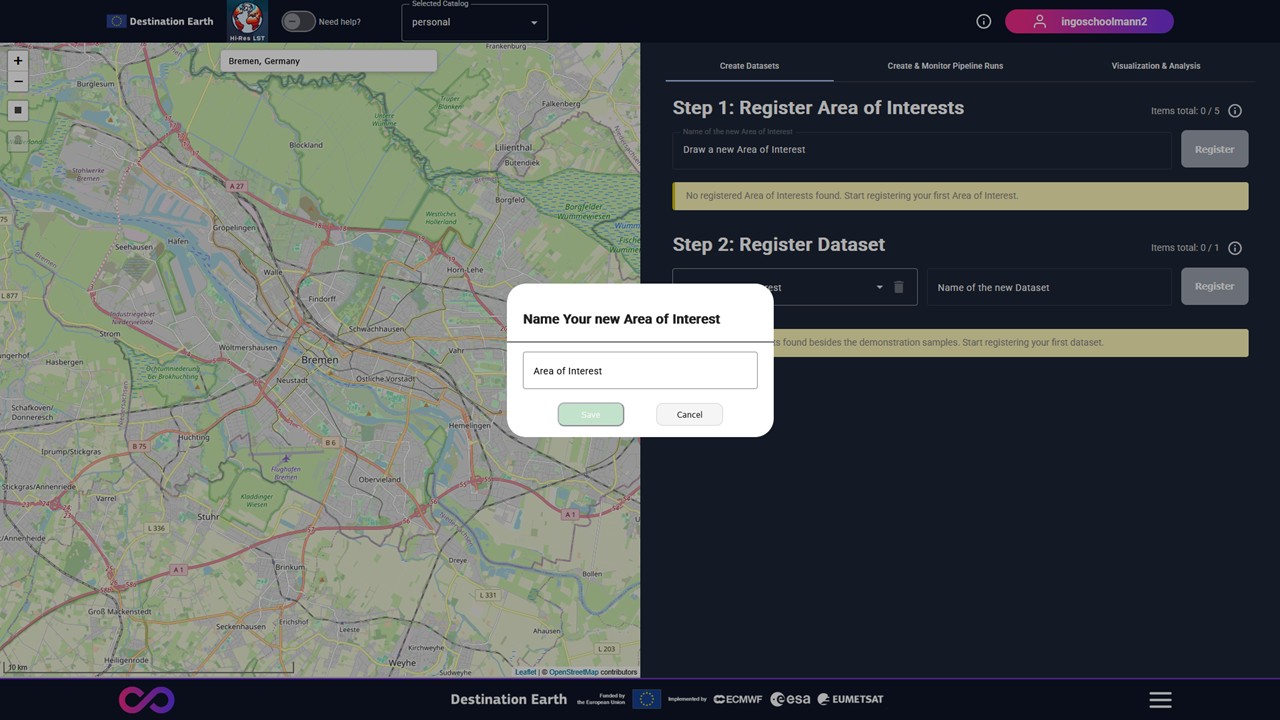
Figure 5: Once the Area of Interest is placed, a pop-up appears that requires a name of the new Area of Interest.
After that, the new Area of Interest can be registered by clicking on the Register button.
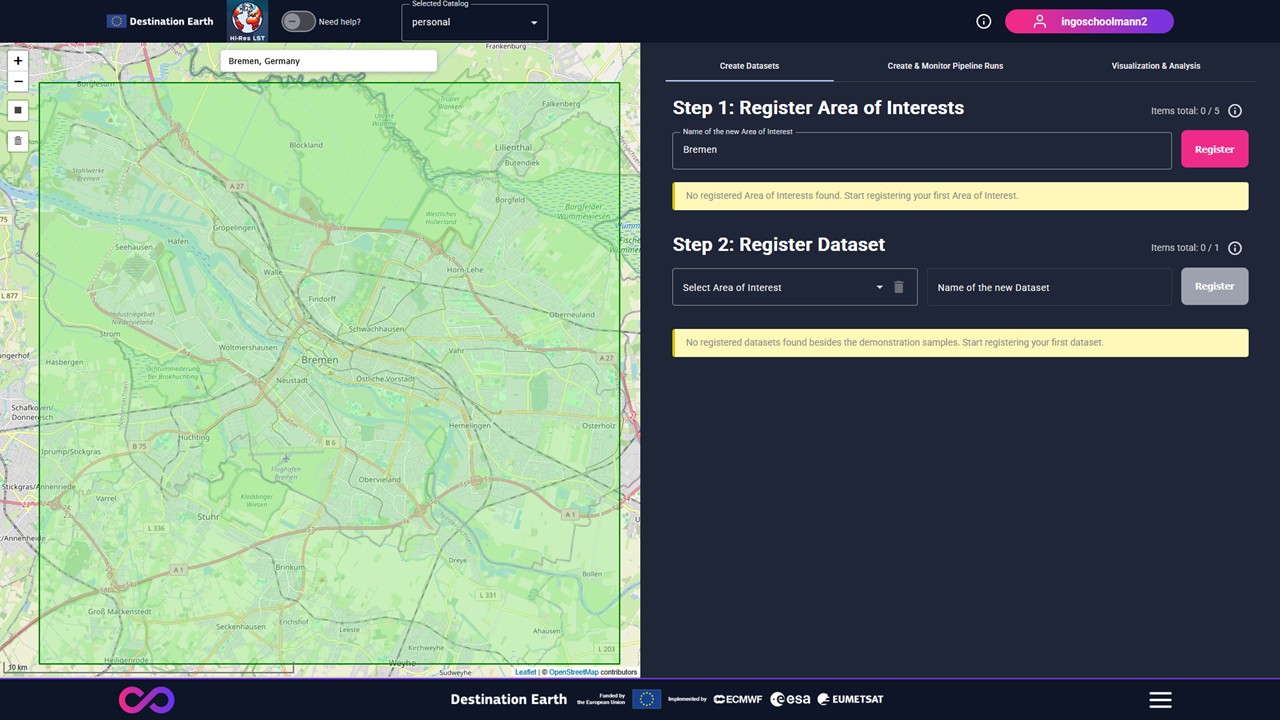
Figure 6: The new Area of Interest can be registered by clicking on the Register button.
Once the registration is completed, the new Area of Interest is ready for selection in the dataset registration in Step 2.
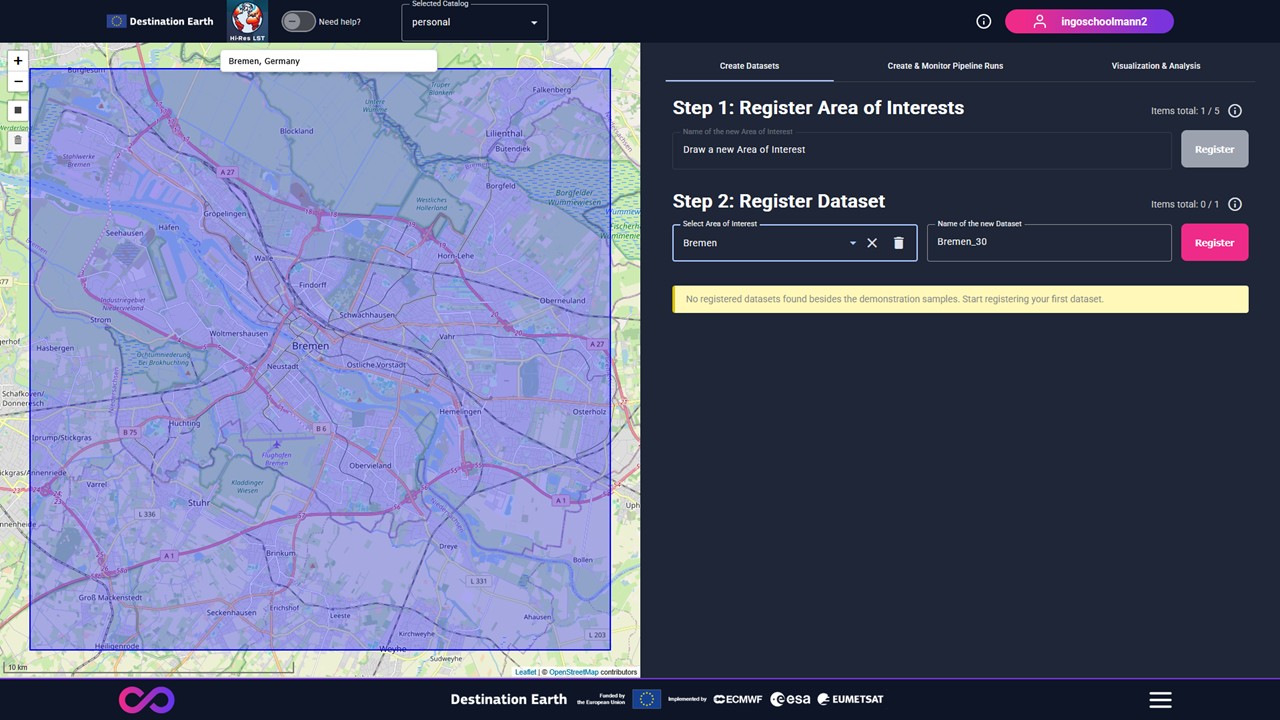
Figure 7: The new Area of Interest can be selected in the dataset registration in Step 2.
(Optional) Registered Area of Interests can be deleted, which deletes also all linked datasets.
Configurations & Limitations
The name of the Area of Interest must be unique for the user.
After successful registration, it is not possible to change the geometry of the Area of Interest.
Step 2: Register Datasets
Workflow
Once a registered Area of Interest is selected, an auto-generated name for the new dataset appears, which can be further adapted by the user. It is advised to select a recognizable dataset name.
Figure 8: Once a registered Area of Interest is selected, an auto-generated name for the new dataset appears, which can be further adapted by the user.
After selecting one of the registered Area of Interest, a new Dataset can be registered using the Register button. A dedicated table provides an overview of the registered datasets.
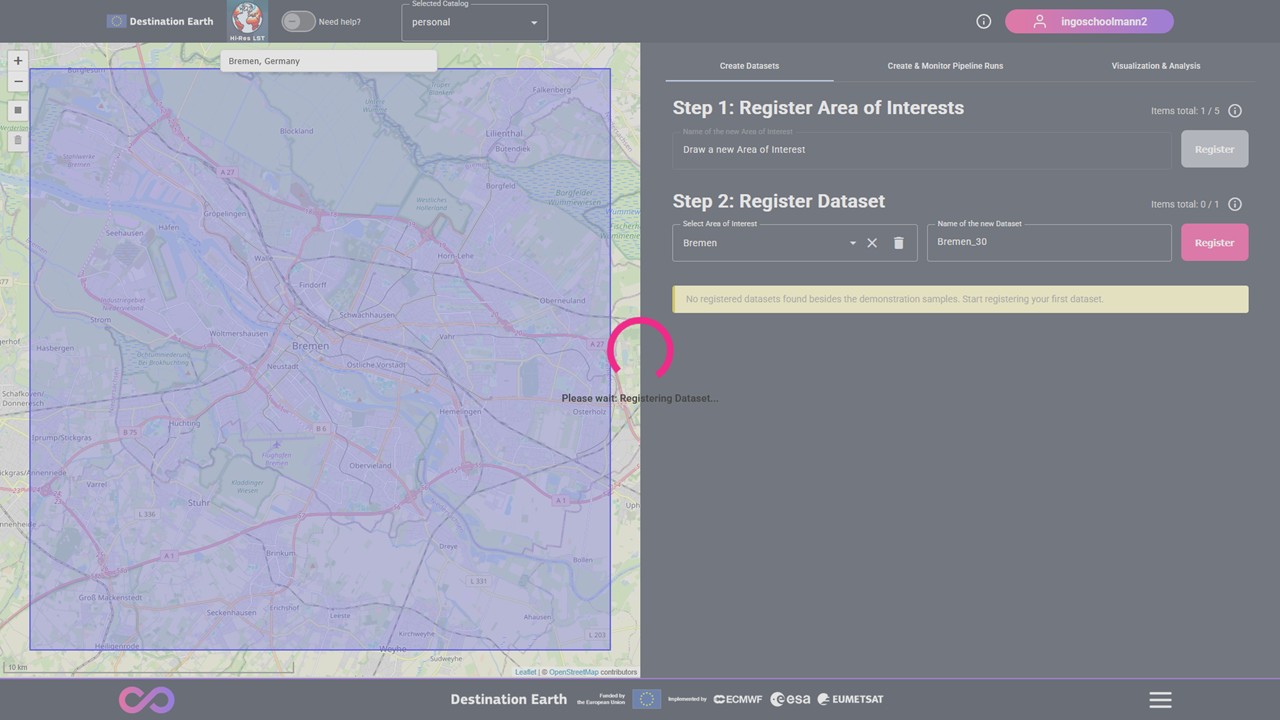
Figure 9: The new Area of Interest can be registered by clicking on the Register button.
(Optional) A dataset can be deleted using the delete button.
Configurations & Limitations
The name of the dataset must be unique for the user.
Each Dataset is uniquely linked to one Area of Interests.
Part 2: Create & Monitor pipeline runs
Based on registered Datasets, which are linked to an Area of Interest, register and monitor on-demand pipeline runs, that fills the dataset with land surface temperature information according to the requested temporal coverages.
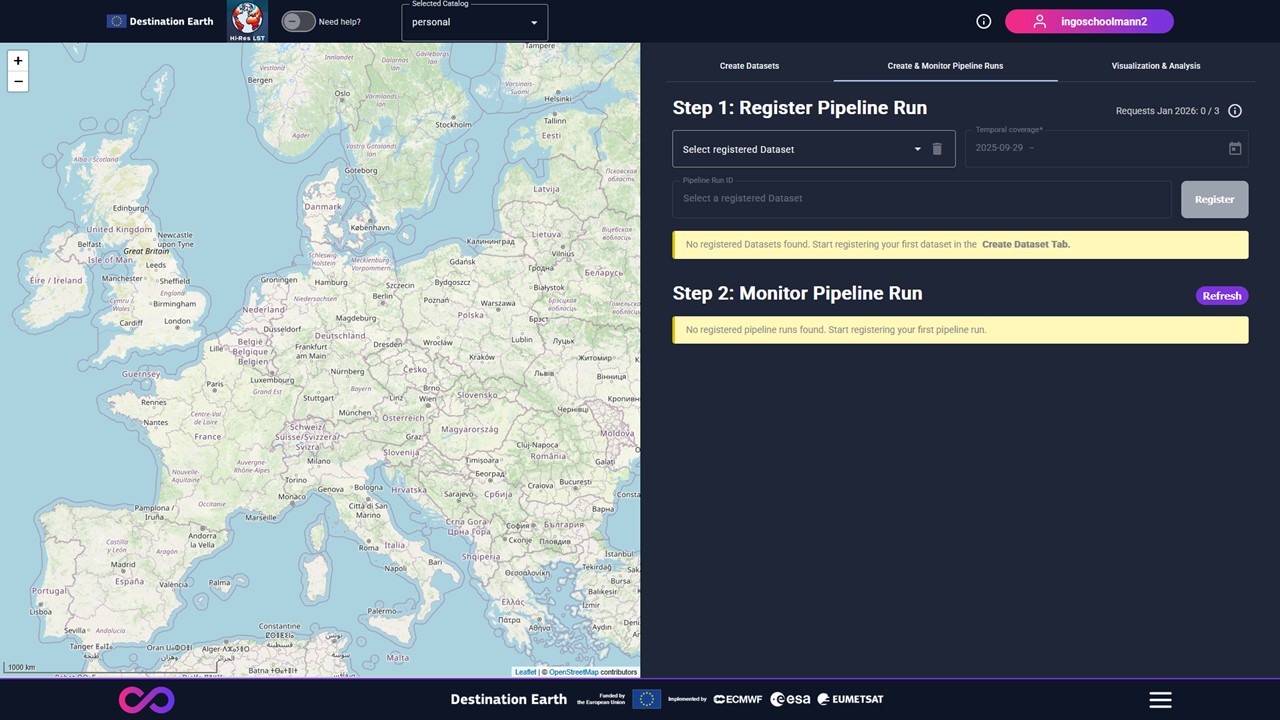
Figure 10: View on the Create & Monitor Pipeline Runs Tab.
Step 1: Register Pipeline Runs
Workflow
Select a registered Dataset, as well as admissible start and end dates.
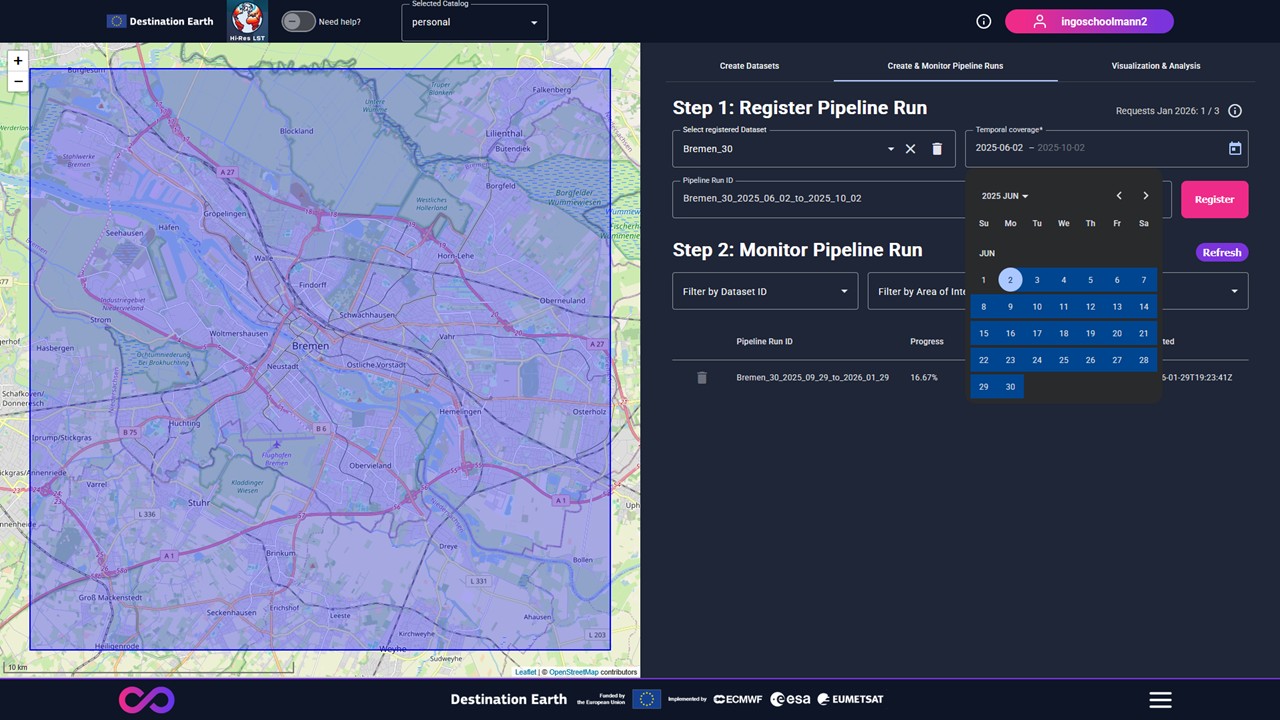
Figure 11: After selecting a registered dataset, a date selection is enabled to choose an admissible temporal coverage.
Register the Pipeline Run by clicking on the Register button, which adds the requests to the service processing queue.
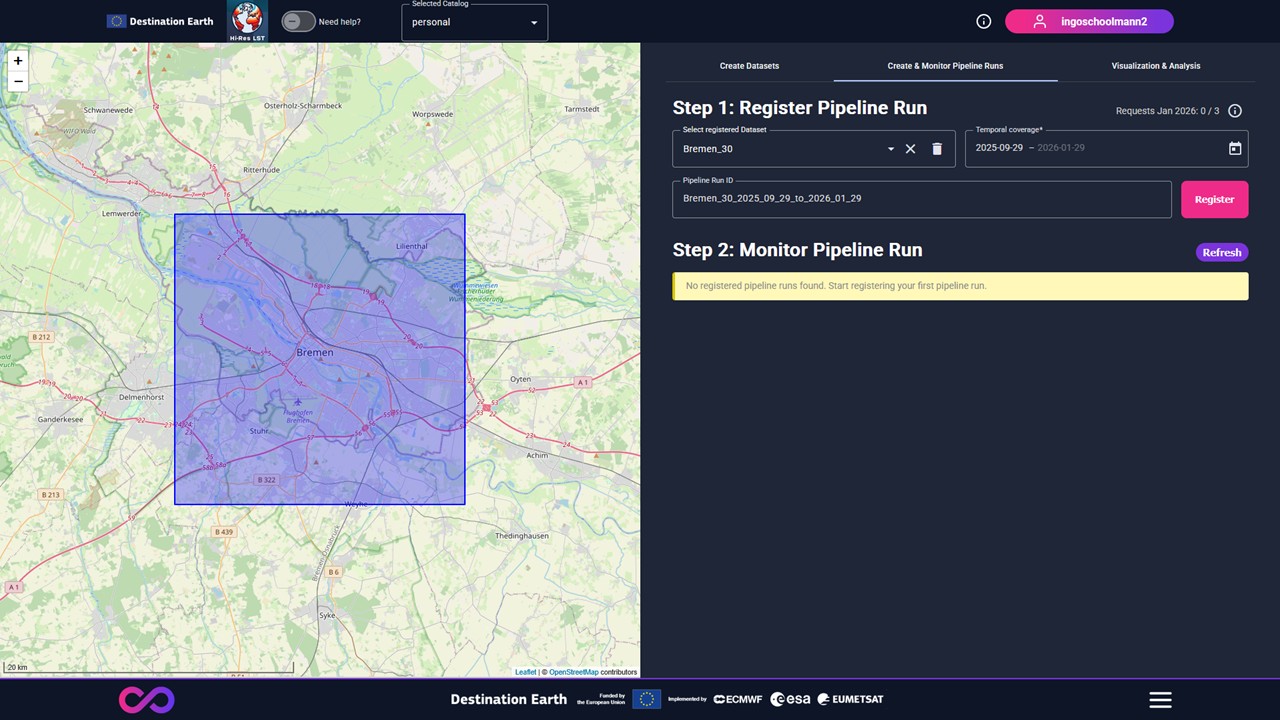
Figure 12: Register the Pipeline Run by clicking on the Register button.
Configurations & Limitations
The pipeline run ID (uniquely determined by the user, dataset, start and end time) is auto-generated and can be further changed by the user.
The temporal coverage of a pipeline run is limited and set to a fixed period.
The service supports data from 1st June 2018 onwards.
Step 2: Monitor Pipeline Runs
Workflow
(Optional) Apply filtering for Dataset, Area of Interest, or status of the pipeline run.
(Optional) The Refresh button allows receiving up-to-date information on existing pipeline runs (completed or pending).
(Optional) Deleting a completed pipeline run does not delete the linked dataset.
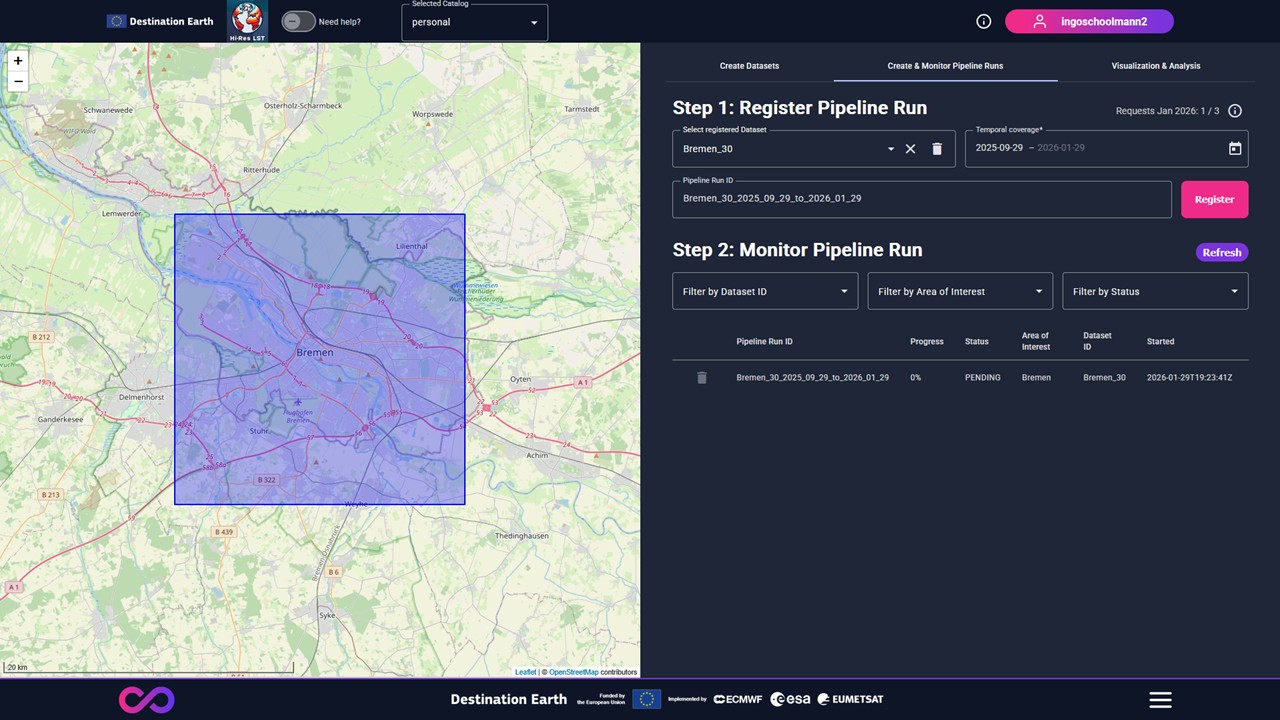
Figure 13: Apply filtering for Dataset, Area of Interest, or status of the pipeline run while the Refresh button allows receiving up-to-date information on existing pipeline runs (completed or pending).
Configurations & Limitations
Only completed pipeline runs can be deleted.
Deleting a completed pipeline runs does not influence the number of supported requested pipeline runs.
Part 3: Visualization & Analysis
Once a pipeline runs is completed, investigate the resulting land surface temperature information by visual (via a map layer) as well as numerical inspection (via time series requests).
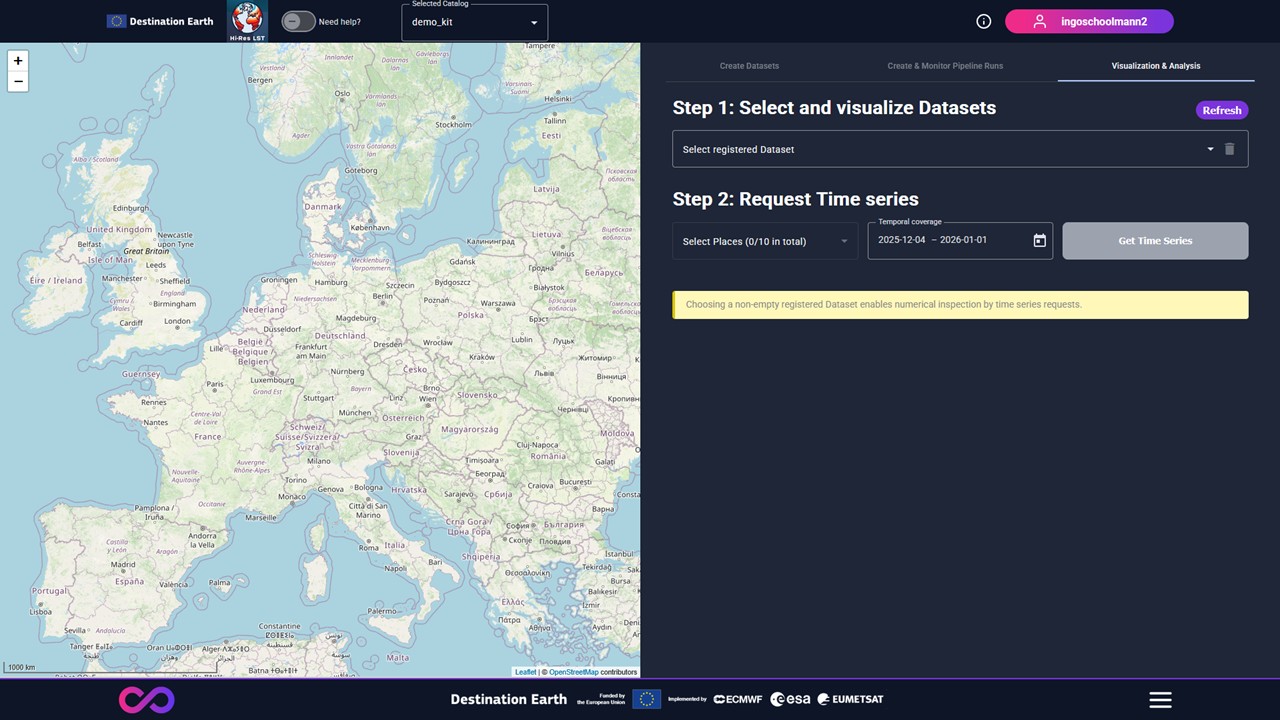
Figure 14: View on the Graphical User Interface Tab Visualization & Analysis.
Step 1: Select and visualize Dataset
Workflow
Select a registered Dataset. If the datasets is non-empty (i.e. having at least one completed linked pipeline run), the access to its stored information is enabled.
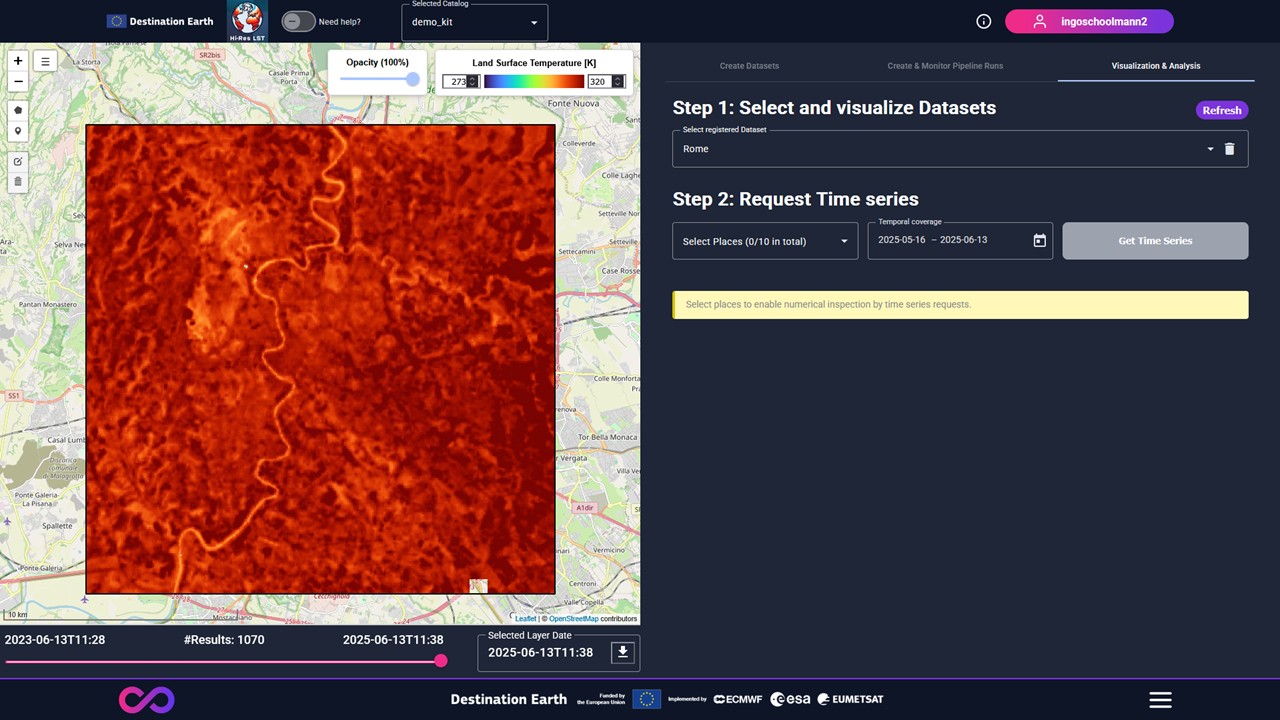
Figure 15: Selecting a registered Dataset collects all available products and enables access to individual map layers.
- Once the dataset is loaded, the following functions can be used:
A Slider bar to change timestamps of the land surface temperature map layer.
Adaptation of the applied color map to better visualize smaller differences in the datasets.
Double-clicking on the map opens a popup showing the land surface temperature at the corresponding coordinate.
Export the visualized land surface temperature layer as geoTiff file.
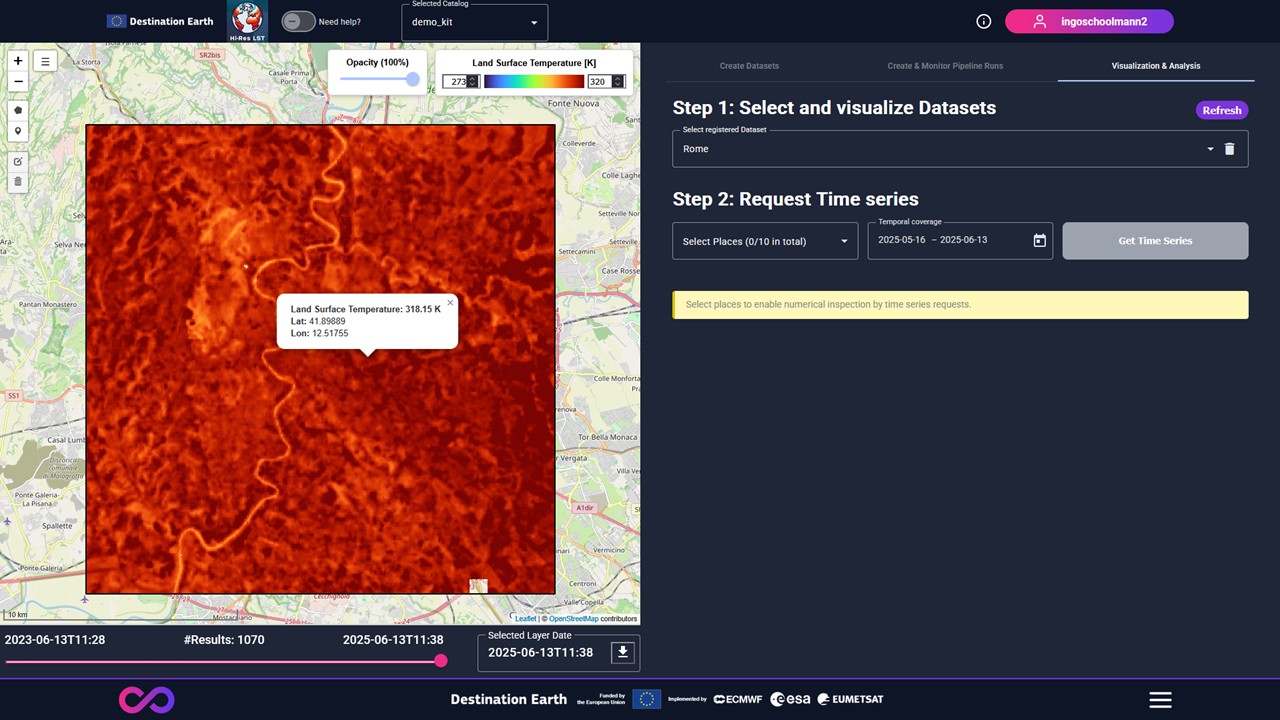
Figure 16: Double-clicking on the map opens a popup showing the land surface temperature at the corresponding coordinate while a slider bar to change timestamps of the land surface temperature map layer.
(Optional) A dataset can be deleted using the delete button.
(Optional) The Refresh button allows receiving up-to-date datasets.
Configurations & Limitations
If the selected dataset is empty, then a pop-up appears indicating to register pipeline runs in the ‘Create & Monitor Pipeline Runs’ tab.
Step 2: Request time series
Workflow
Use the draw toolbar to set places on the map.
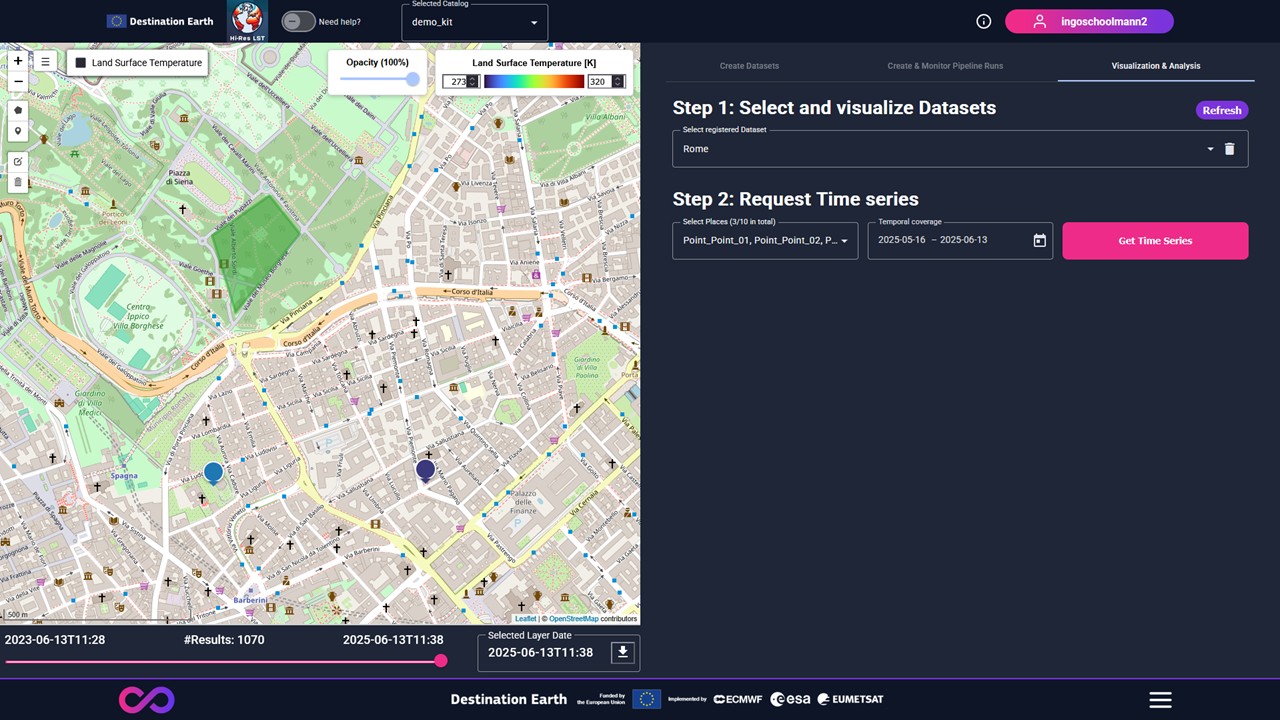
Figure 17: Use the draw toolbar to set places on the map.
Placing a Place opens a pop-up requesting a name for that place.
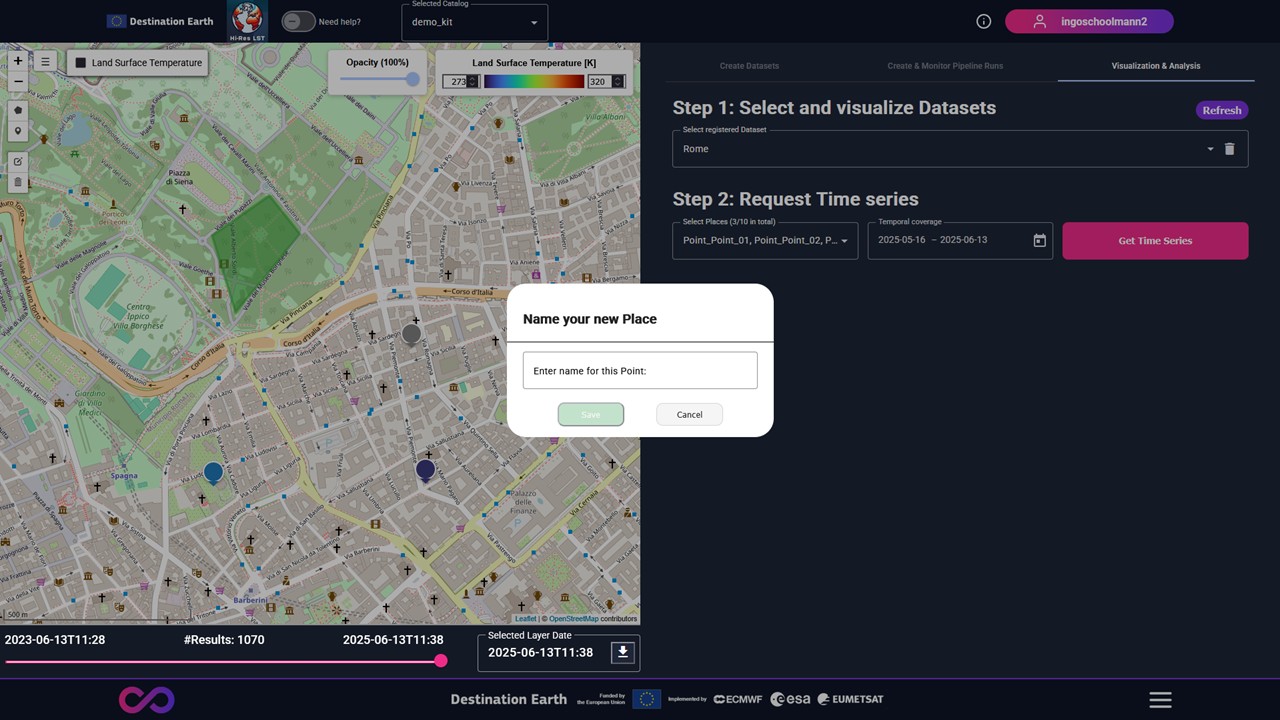
Figure 18: Placing a Place opens a pop-up requesting a name for that place.
Clicking the Get Time Series button, shows the land surface temperature time series for the selected places in a line chart.
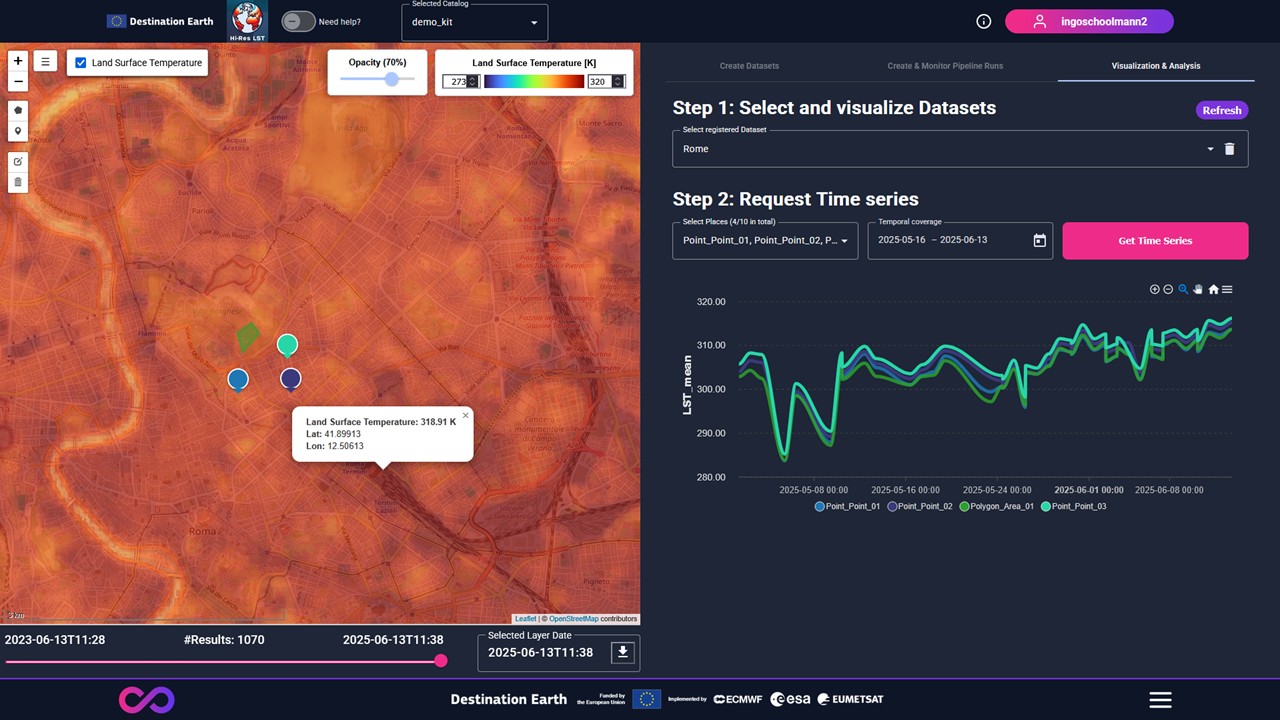
Figure 19: After Clicking the Get Time Series button, a line chart shows the land surface temperature time series for the selected places.
Configurations & Limitations
The user can request time series for a limited number of places.
User Guide for Technical Service Access
Get Access Token
To get in a programmatic way an access token from DestinE, we refer to the official documentation.
Part 1: Create Area of Interest and register linked Datasets
Step 1: Register Area of Interests
Workflow
Register a new area of interest under the given AOI name.
- POST /aois/{aoi_name}
- Parameters:
aoi_name (string) – Name of the Area of Interest.
Example Request
POST /aois/my_aoi_name HTTP/1.1
Host: hi-res-lst.destine.eu
Authorization: Bearer <token>
m2m: true
(Optional) Delete Area Of Interest.
- DELETE /aois/{aoi_name}
- Parameters:
aoi_name (string) – Name of the Area of Interest.
Example Request
DELETE /aois/my_aoi_name HTTP/1.1
Host: hi-res-lst.destine.eu
Authorization: Bearer <token>
m2m: true
(Optional) Get Area Of Interest Info
- GET /aois/{aoi_name}
- Parameters:
aoi_name (string) – Name of the Area of Interest.
Example Request
GET /aois/my_aoi_name HTTP/1.1
Host: hi-res-lst.destine.eu
Authorization: Bearer <token>
m2m: true
(Optional) Get all registered Area Of Interests
- GET /aois
Example Request
GET /aois HTTP/1.1
Host: api.example.com
Authorization: Bearer <token>
m2m: true
Configurations & Limitations
The name of the Area of Interest must be unique.
Step 2: Register Datasets
Workflow
Register Datasets
- POST /datasets/{dataset_id}
- Parameters:
dataset_id (string) – Name of the Dataset.
- Query Parameters:
aoi_name (string) – Name of the Area of Interest.
Example Request
POST /datasets/my_dataset_name?aoi_name=my_aoi_name HTTP/1.1
Host: hi-res-lst.destine.eu
Authorization: Bearer <token>
m2m: true
(Optional): Get all existing datasets
- GET /datasets
- Parameters:
dataset_id (string) – Name of the Dataset.
- Query Parameters:
aoi_name (string) – Name of the Area of Interest (Optional?).
Example Request
POST /datasets/my_dataset_name?aoi_name=my_aoi_name HTTP/1.1
Host: hi-res-lst.destine.eu
Authorization: Bearer <token>
m2m: true
(Optional): Delete Datasets
- DELETE /datasets/{dataset_id}
- Parameters:
dataset_id (string) – Name of the Dataset.
Example Request
DELETE /datasets/my_dataset_name HTTP/1.1
Host: hi-res-lst.destine.eu
Authorization: Bearer <token>
m2m: true
(Optional): Get Dataset Info
- POST /datasets/{dataset_id}
- Parameters:
dataset_id (string) – Name of the Dataset.
Example Request
POST /datasets/my_dataset_name HTTP/1.1
Host: hi-res-lst.destine.eu
Authorization: Bearer <token>
m2m: true
Configurations & Limitations
The name of the Dataset must be unique for each user.
Each Dataset is uniquely linked to one Area of Interests.
For each registered Area of Interest different Datasets can be registered.
Part 2: Create & Monitor Pipeline Runs
Step 1: Register Pipeline Runs
Workflow
Register Pipeline Run
- POST /pipeline_runs/{pipeline_run_id}
- Parameters:
pipeline_run_id (string) – Name of the Pipeline Run.
- Query Parameters:
dataset_id (string) – Name of the Dataset
start_date (string) – Start date in ISO-8601 format, for example: 2020-09-10T00:00:00Z.
end_date (string) – End date in ISO-8601 format, for example: 2020-09-30T00:00:00Z
Example Request
POST /pipeline_run_id/my_pipeline_run?dataset_id=my_dataset_name&start_date=2020-09-10T00:00:00Z&end_date=2020-09-30T00:00:00Z HTTP/1.1
Host: hi-res-lst.destine.eu
Authorization: Bearer <token>
m2m: true
(Optional): Delete Pipeline Run
- DELETE /pipeline_runs/{pipeline_run_id}
- Parameters:
pipeline_run_id (string) – Name of the Pipeline Run.
Example Request
DELETE /pipeline_run_id/my_pipeline_run HTTP/1.1
Host: hi-res-lst.destine.eu
Authorization: Bearer <token>
m2m: true
Configurations & Limitations
The temporal coverage of a pipeline run is limited.
The service supports data from 1st January 2018 onwards.
Several pipeline runs can be requested for the same dataset.
Step 2: Monitor Pipeline Runs
Workflow
Get Status of a single Pipeline Run
- GET /pipeline_runs/{pipeline_run_id}
- Parameters:
pipeline_run_id (string) – Name of the Pipeline Run.
Example Request
GET /pipeline_run_id/my_pipeline_run HTTP/1.1
Host: hi-res-lst.destine.eu
Authorization: Bearer <token>
m2m: true
Get status of all pipeline runs
- GET /pipeline_runs/{pipeline_run_id}
- Parameters:
pipeline_run_id (string) – Name of the Pipeline Run.
Example Request
GET /pipeline_runs HTTP/1.1
Host: hi-res-lst.destine.eu
Authorization: Bearer <token>
m2m: true
Configurations & Limitations
Only completed pipeline runs can be deleted.
Deleting a completed pipeline runs does not influence the number of supported requested pipeline runs.
Part 3: Visualization & Analysis
Step 1: Visualize Datasets
Workflow
Get all data timestamps for a single dataset
- GET /datasets/{dataset_id}/timestamps
- Parameters:
dataset_id (string) – Name of the Dataset.
Example Request
GET /datasets/my_dataset_name/timestamps HTTP/1.1
Host: hi-res-lst.destine.eu
Authorization: Bearer <token>
m2m: true
Export dataset as COG for a single timestamp
- GET /datasets/{dataset_id}/timestamps/{timestamp}/cog
- Parameters:
dataset_id (string) – Name of the Dataset.
timestamp (string) – Timestamp in Format ().
Example Request
GET /datasets/my_dataset_name/timestamps/XYT HTTP/1.1
Host: hi-res-lst.destine.eu
Authorization: Bearer <token>
m2m: true
Step 2: Request time series
Workflow
Given a timestamp and a place, return the LST values
- POST /datasets/{dataset_id}/timeseries
- Parameters:
dataset_id (string) – Name of the Dataset.
- Query Parameters:
start_date (string) – Start date in ISO-8601 format, for example: 2020-09-10T00:00:00Z.
end_date (string) – End date in ISO-8601 format, for example: 2020-09-30T00:00:00Z
Example Request
POST /datasets/my_dataset_name/timeseries?start_date=2020-09-10T00:00:00Z&end_date=2020-09-30T00:00:00Z HTTP/1.1
Host: hireslst.destine.eu
Authorization: Bearer <token>
m2m: true
Configurations & Limitations
The time series requests support a limited number of places.