EAGLE - Earth Intelligence Studio
Welcome to the Destination Earth EAGLE platform documentation. EAGLE is the Earth Intelligence Studio, a visual geospatial workflow platform for satellite imagery analysis and AI-powered Earth observation.
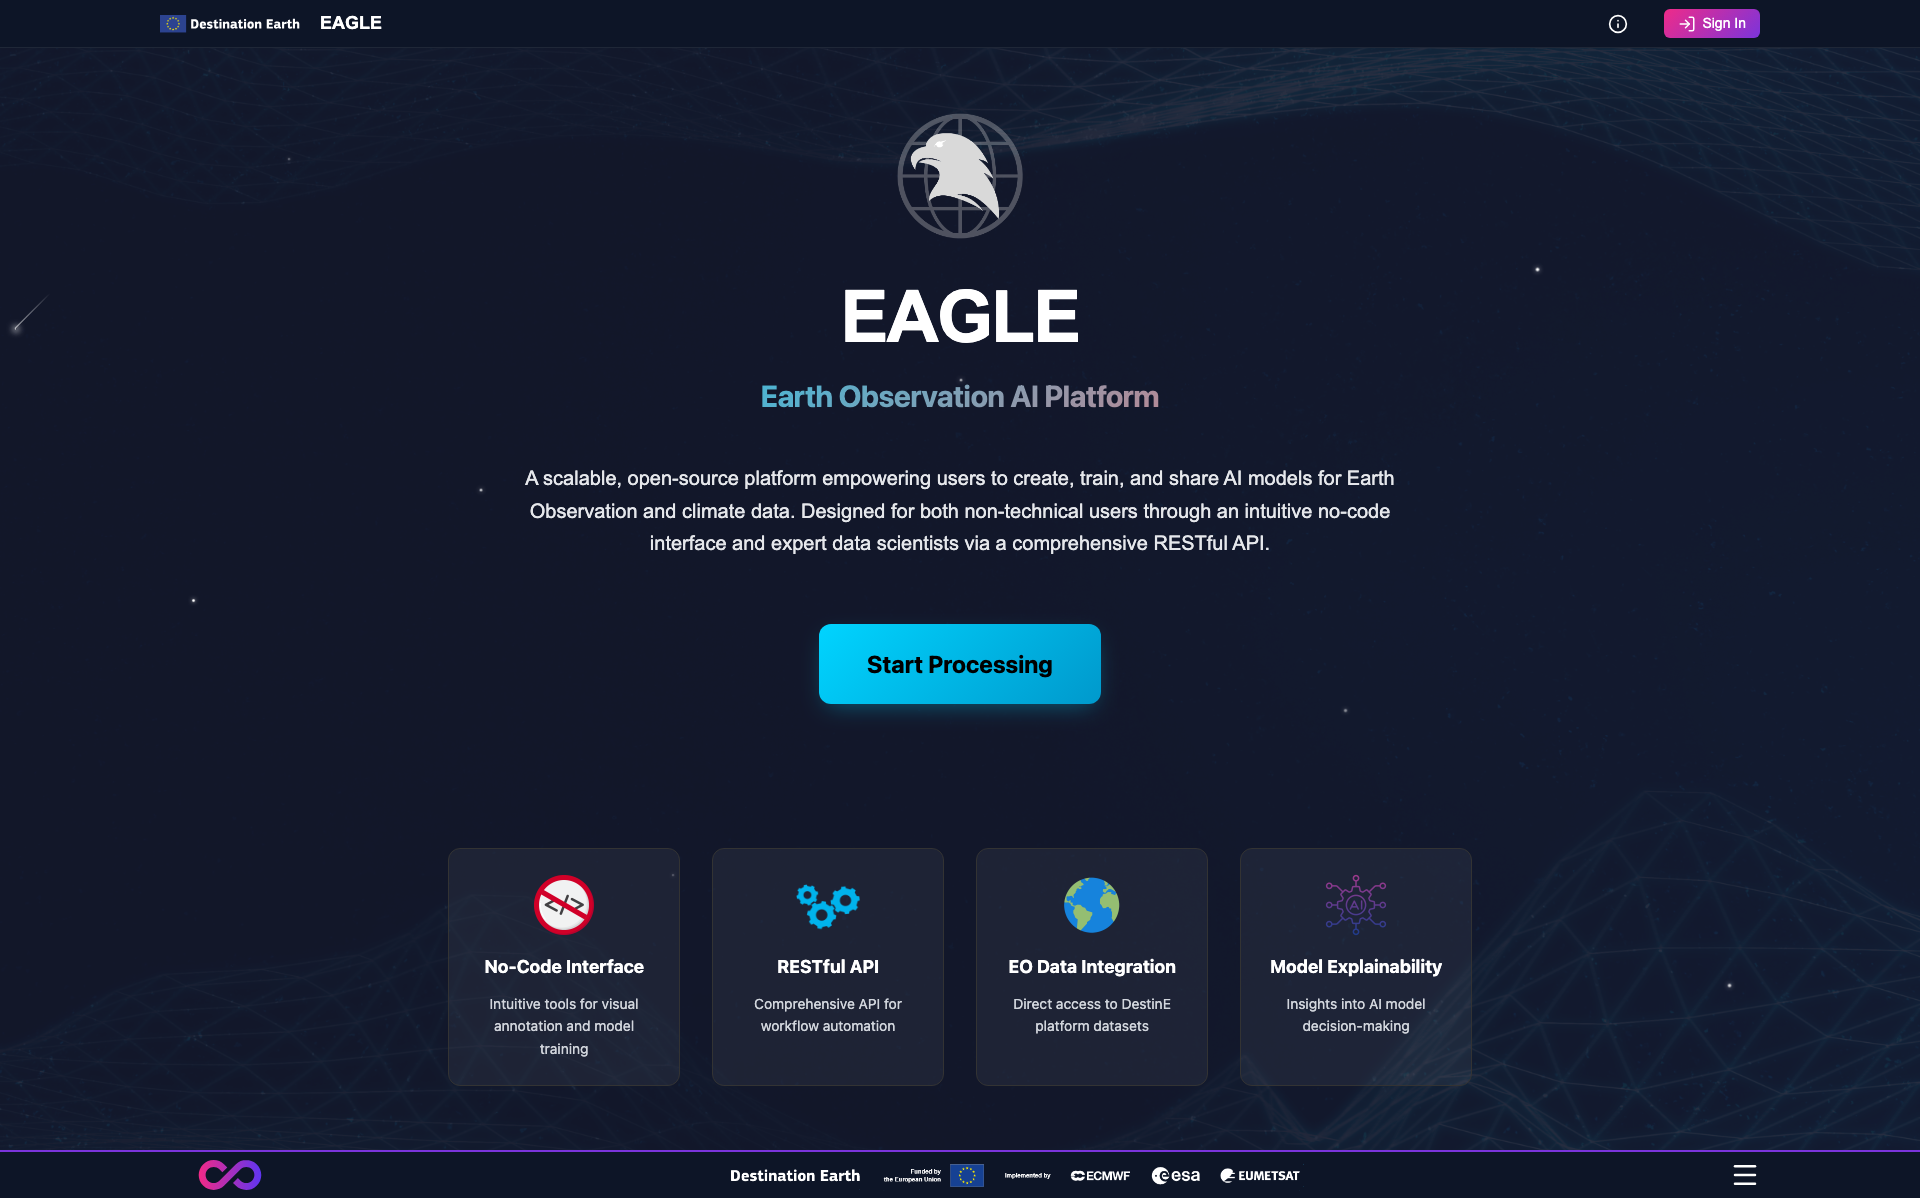
Figure 1: The EAGLE public landing page on the Destination Earth platform.
Overview
EAGLE provides a no-code, drag-and-drop canvas for building, executing, and monitoring AI-powered processing pipelines on Earth observation data. Users design workflows by connecting nodes on an interactive canvas, running inference, fine-tuning models, and exploring results - all without writing code.
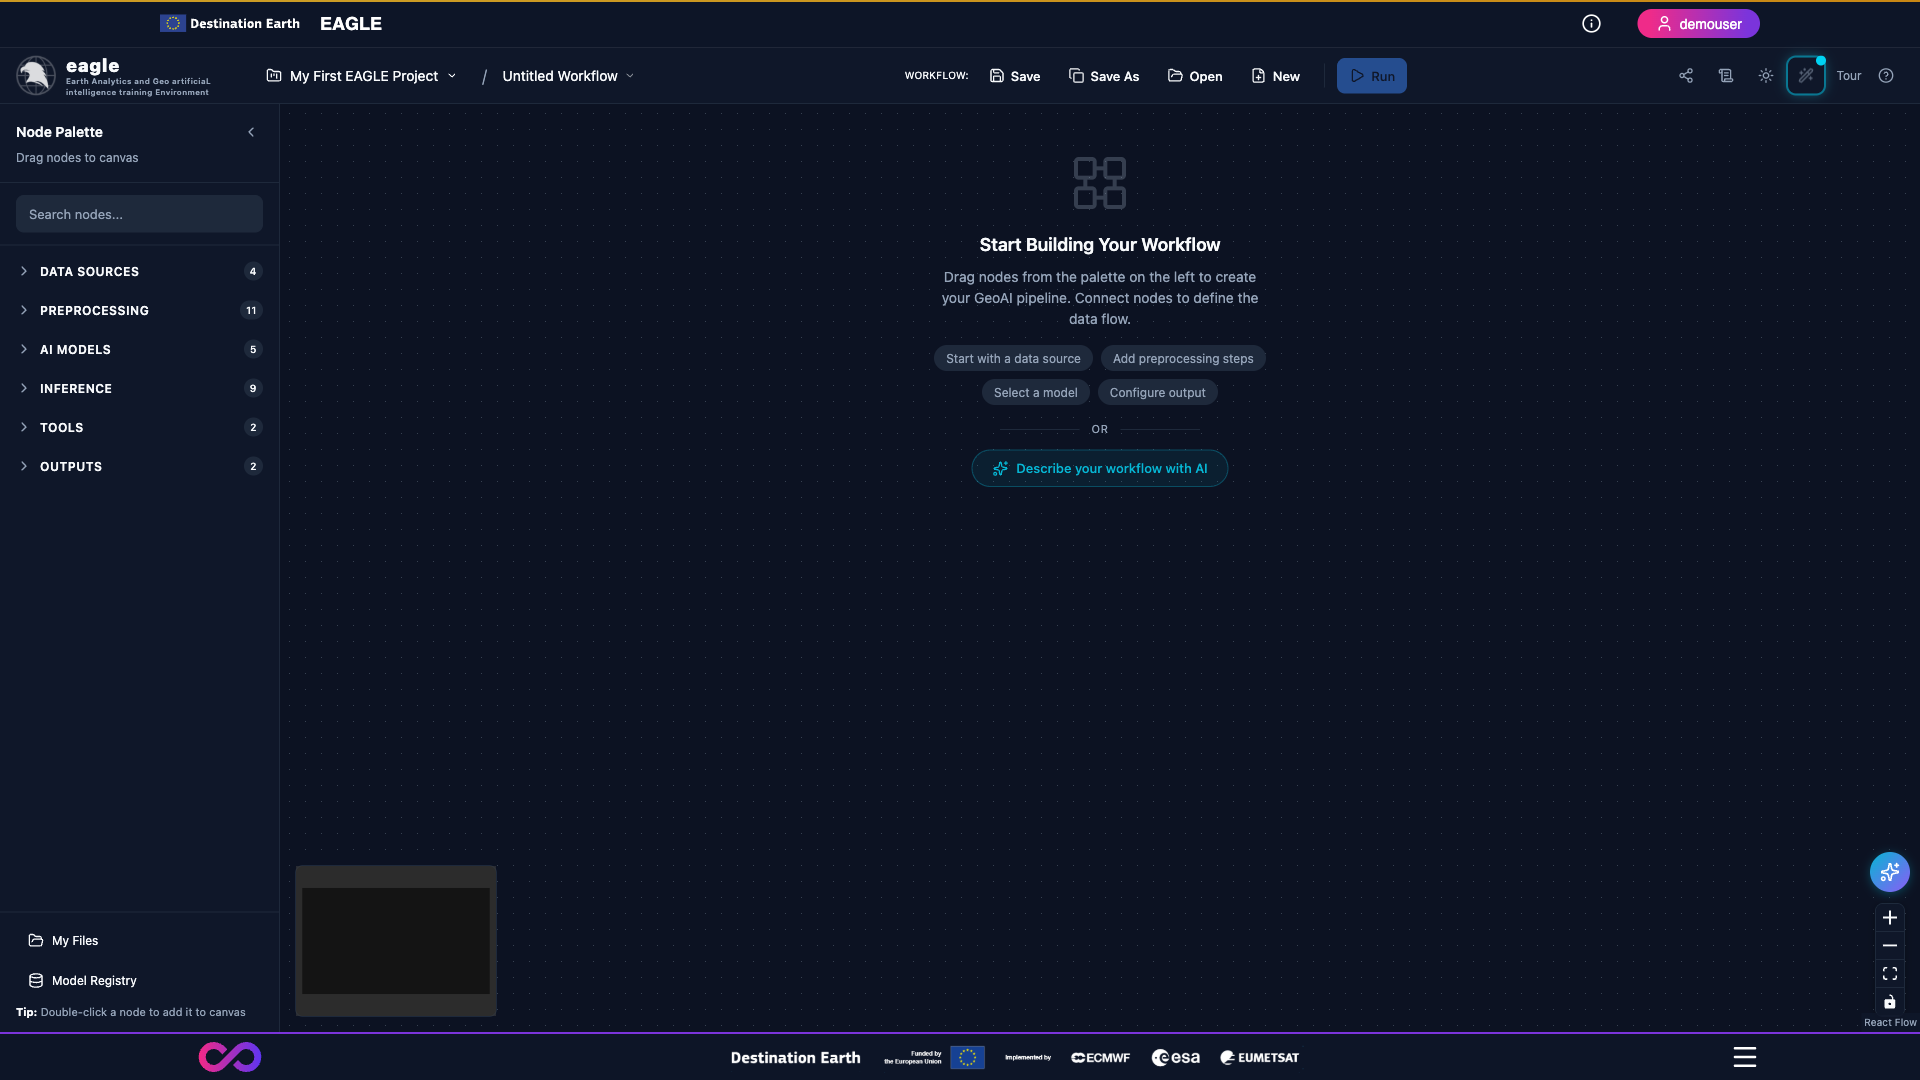
Figure 2: The empty EAGLE workflow canvas with the Node Palette on the left and quick-start prompts in the centre.
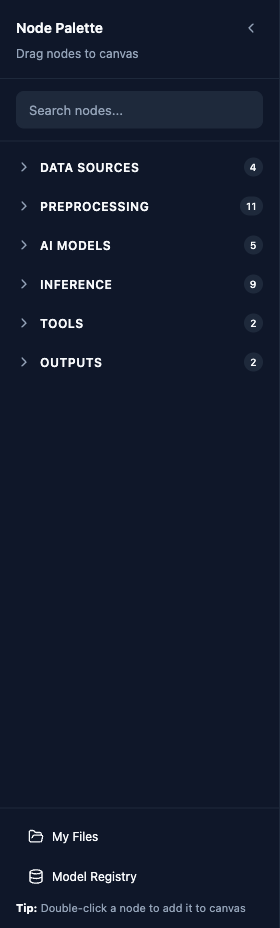
Figure 3: The Node Palette grouped by category (Data Sources, Preprocessing, AI Models, Inference, Tools, Outputs).
Core Platform Capabilities
EAGLE is built around a visual workflow paradigm:
Visual Workflow Builder - Design geospatial processing pipelines by dragging, connecting, and configuring nodes on an interactive canvas powered by React Flow.
AI Model Inference - Run pretrained models for flood/water detection, burn scar detection, crop classification, solar farm and rooftop solar panel detection, change detection, cloud and shadow detection, field boundary delineation, and text-prompted segmentation with SAM3.
Model Fine-tuning - Fine-tune flood/water, burn scar, crop classification, and Satlas solar farm models on your own labelled data using one of four foundation-model backbones.
Satellite Data Access - Integrated Copernicus Data Space access for Sentinel-2 search, download, and processing. GeoTIFF, Zarr, and NetCDF upload are supported.
Interactive Segmentation (SAM3) - Segment Anything Model 3 integration for text-prompted geospatial segmentation.
Spectral Analysis - Interactive per-pixel and grid-based spectral profile extraction with reference spectra, spectral indices (NDVI, NDWI, SAVI, EVI, NDBI, BSI), and statistics.
Zonal Statistics - Polygon-based aggregate statistics (17+ measures including percentiles, variance, and frequency metrics) over raster imagery with choropleth visualization.
Super Resolution - Upscale Sentinel-2 10 m imagery to 2.5 m using the OpenSR latent diffusion model.
Explainable AI (GradCAM) - Visual heatmap overlays on all segmentation models showing which regions drove each prediction.
LLM Workflow Assistant - AI advisor powered by Mistral for natural-language workflow generation and error recovery (“Fix with AI”).
Model Registry - Versioned lifecycle management of fine-tuned models with promotion, comparison, rollback, and tagging.
Workflow Sharing - Public read-only share links with configurable expiry for collaborating on workflows and outputs.
Result Visualization - Interactive map previews, GeoTIFF tile serving, timeline playback, and downloadable GeoJSON / GeoTIFF outputs.
Foundation Model Backbones
Core segmentation tasks (flood/water, burn scar, crop classification) can be run on four backbone architectures:
Prithvi EO v2 (IBM / NASA) - 600 M-parameter Vision Transformer pretrained on 4.2 M global Sentinel-2 / Landsat time-series samples. Ships with pretrained task checkpoints for immediate inference.
TerraMind v1 (IBM / ESA) - Any-to-any multi-modal foundation model using all 12 Sentinel-2 L2A bands. Requires fine-tuning before use.
DOFA Large (Dynamic One-For-All) - Wavelength-adaptive foundation model that works with any sensor via sensor presets (Sentinel-2, Sentinel-2 Full, Landsat-8/9, RGB). Requires fine-tuning before use.
Satlas Swin-V2-B (Allen AI) - Swin Transformer V2-B with Feature Pyramid Network, specialised for infrastructure and environmental mapping on Sentinel-2. Ships with a pretrained solar-farm checkpoint.
Available AI Models
Inference:
Flood / Water Detection - Prithvi, TerraMind, or DOFA backbone. Prithvi ships with a pretrained checkpoint.
Burn Scar Detection - Prithvi, TerraMind, or DOFA backbone. Prithvi ships with a pretrained checkpoint.
Crop Classification - Multitemporal (3 timesteps) with Prithvi, TerraMind, or DOFA backbone. Prithvi ships with a pretrained checkpoint.
Solar Farm Detection - Pretrained Satlas Swin-V2-B for utility-scale solar farms on Sentinel-2 imagery.
Solar Panel Detection - Mask R-CNN instance segmentation (geoai-py) for rooftop and ground-mounted panels on VHR / aerial RGB imagery.
Field Boundary Detection - YOLO11 (Delineate Anything) for agricultural parcel delineation, with GeoJSON vector output.
Cloud Detection - OmniCloudMask 4-class segmentation (clear / thick cloud / thin cloud / shadow) for 10-50 m imagery.
Change Detection - SAM-based bi-temporal comparison between two co-registered images.
SAM3 Text Segmentation - Zero-shot segmentation from natural-language prompts using Segment Anything Model 3.
Fine-tuning (Training):
Flood / Water, Burn Scar, and Crop Classification training pipelines with Prithvi, TerraMind, or DOFA backbones.
Satlas Solar Farm fine-tuning for domain adaptation on custom labelled data.
Project-Based Workflow
All work within EAGLE is organized through a hierarchy:
Project - A user-scoped container for workflows, data, and results for a specific initiative.
Workflow - A visual pipeline of connected nodes saved within a project.
Job - A single execution of a workflow, tracked with per-node status and GPU-aware queue management, recoverable after pod restarts.
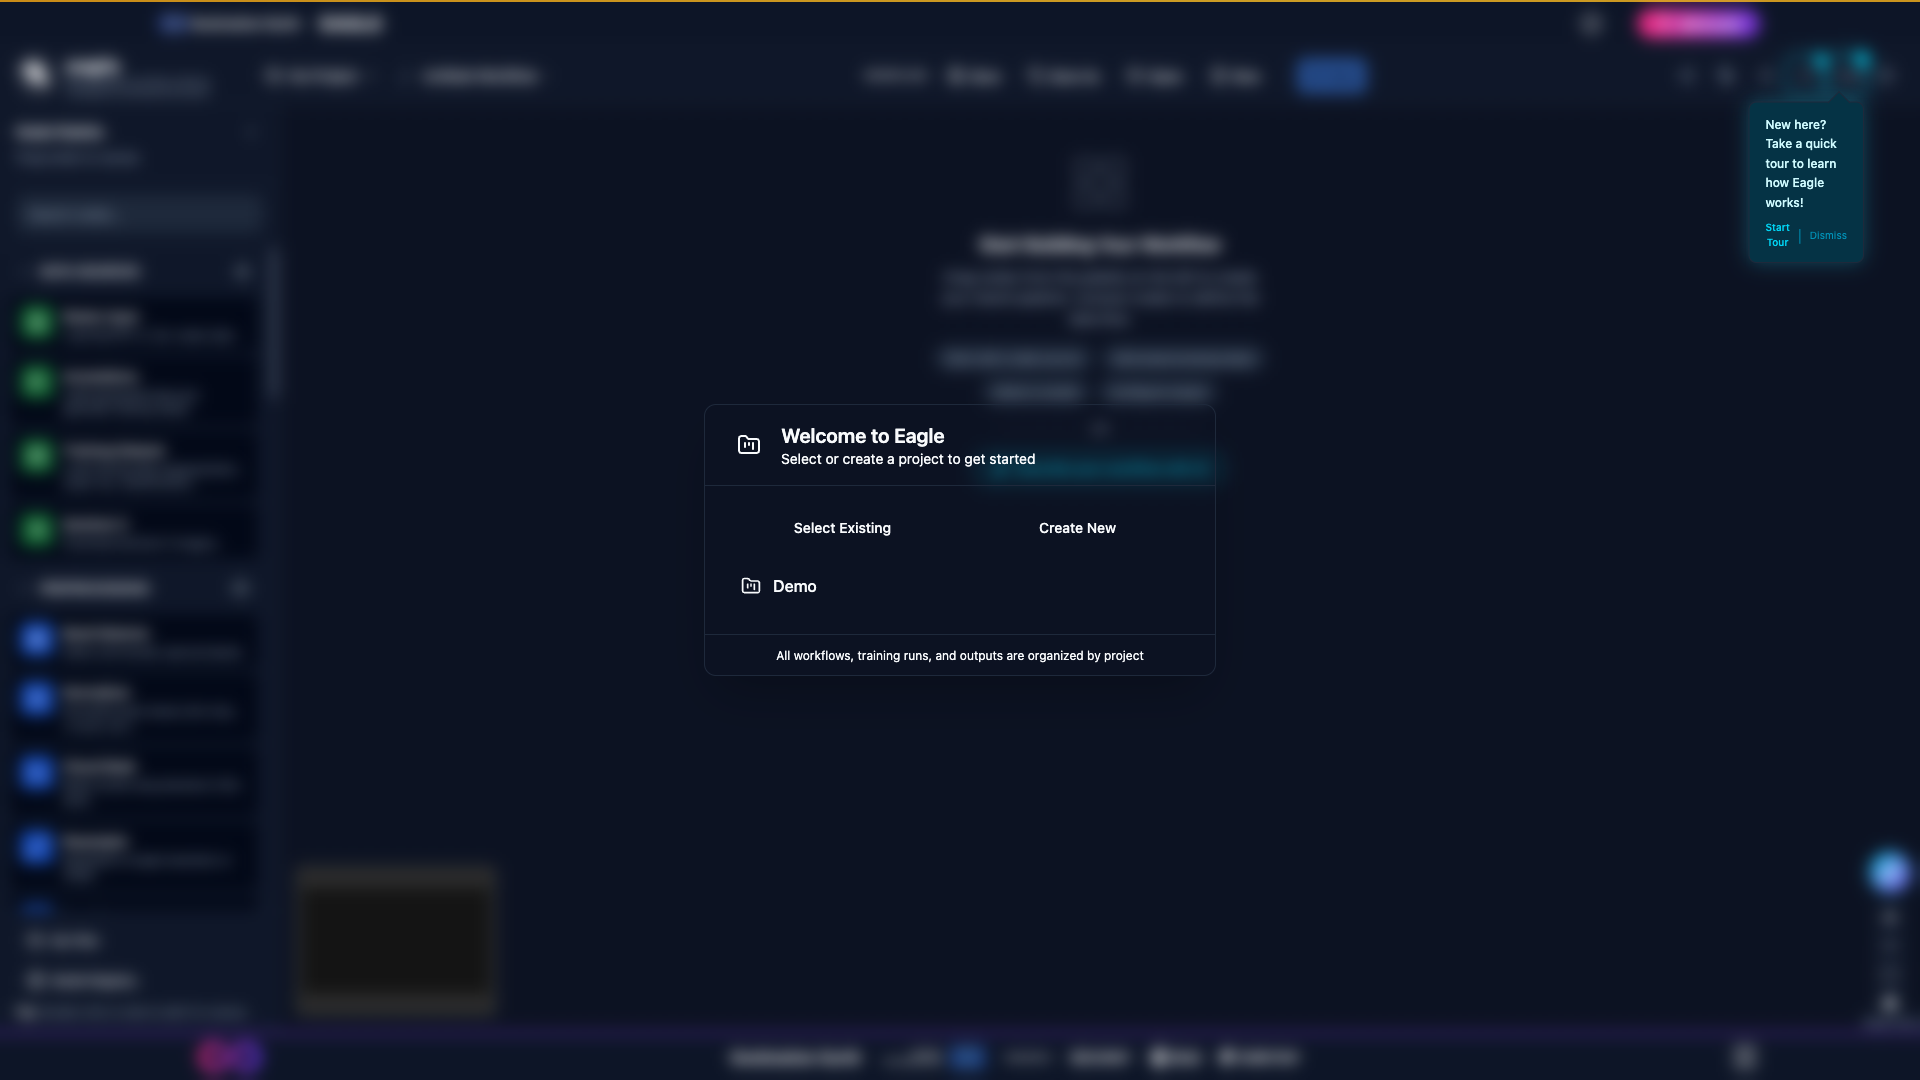
Figure 4: The “Welcome to Eagle” modal prompting the user to select an existing project, create a new one, or open the demo.
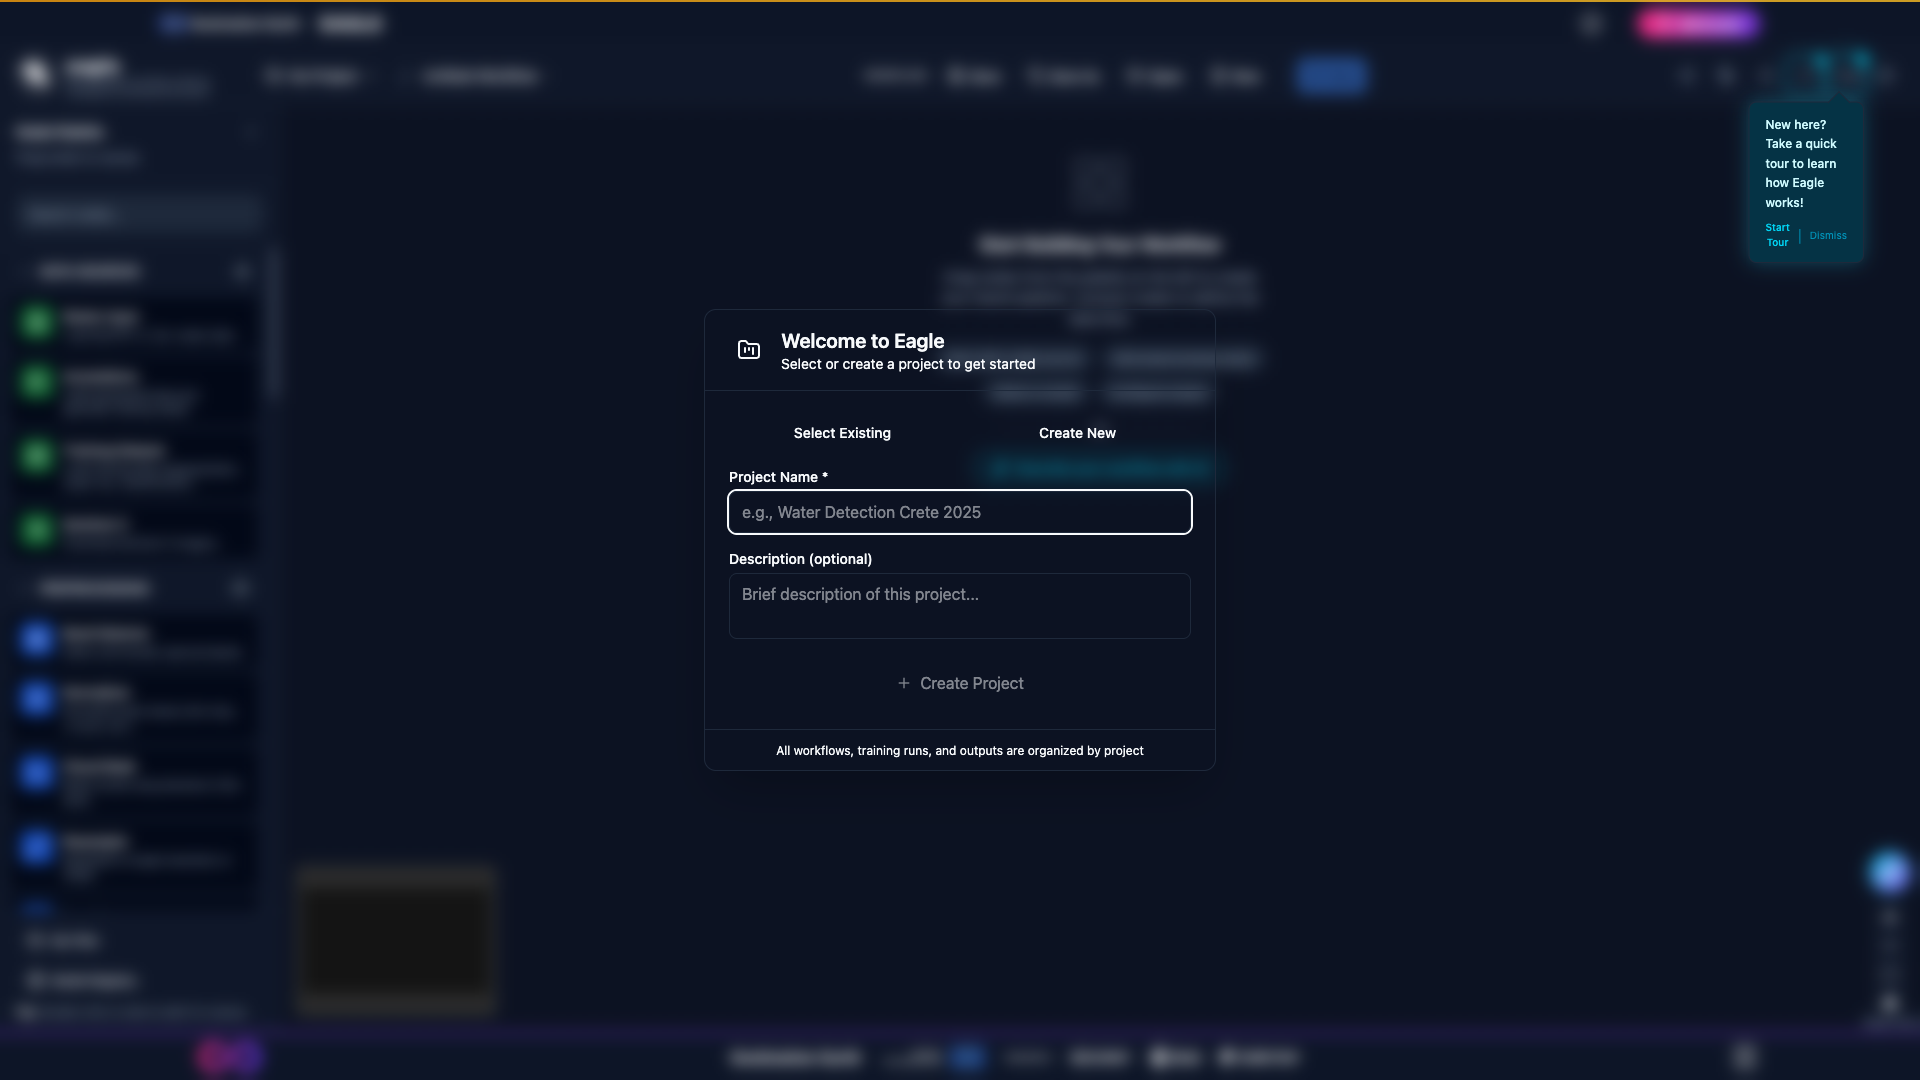
Figure 5: The Create Project dialog before any details are entered.
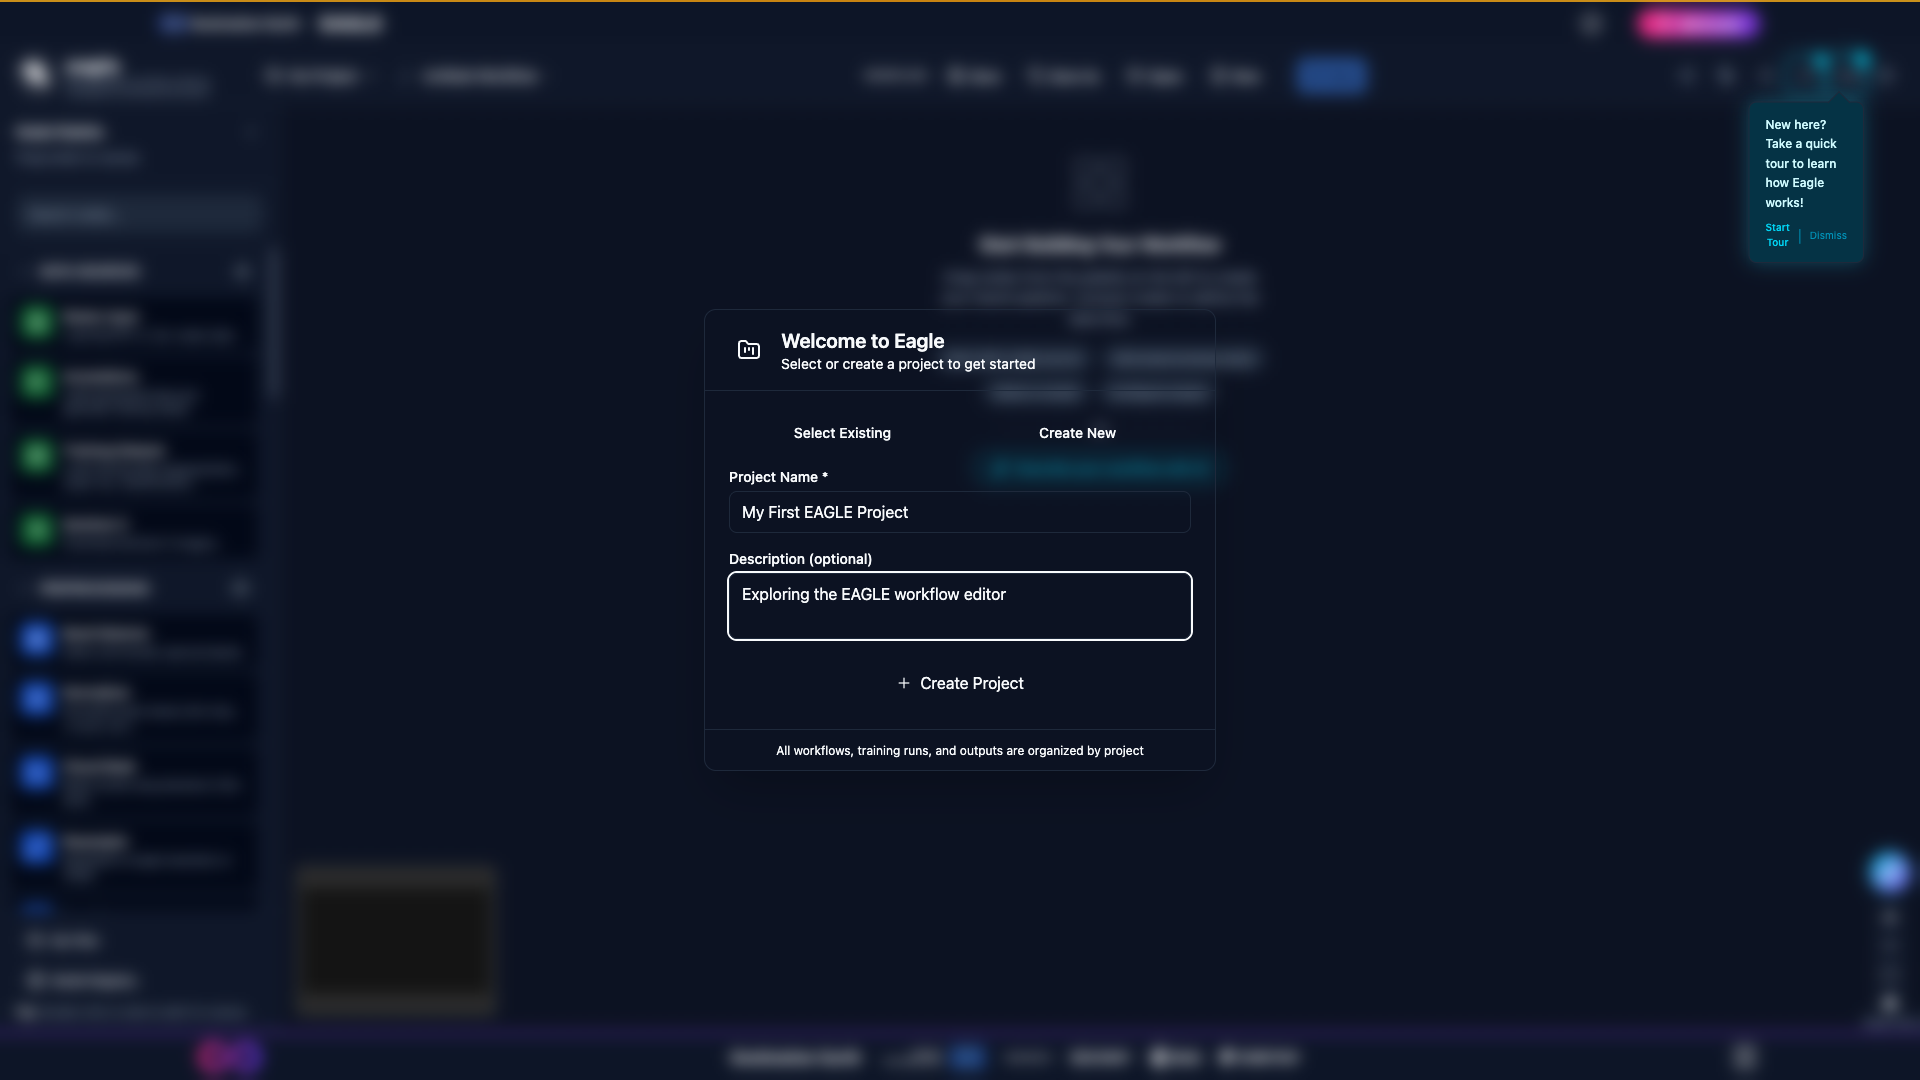
Figure 6: The Create Project dialog with a name and description filled in.
Documentation Sections
Contents:
Quick Start Guide
To start using EAGLE:
Sign In - Authenticate via the Destination Earth Keycloak SSO.
Create a Project - Use the project selector in the header to create a new project.
Try a Demo - Open the Help Guide (F1 or
?) and pick Flood Detection Demo (Emilia-Romagna 2023) from the Workflow Templates gallery. Choose an output folder on the Sentinel-2 node and click Run.Build Your Own - Drag nodes from the sidebar onto the canvas, connect them by dragging from output to input handles, and configure each node’s parameters.
Submit Job - Click Run in the header to execute the workflow and monitor progress in the Operations Log.
View Results - Explore outputs in the preview panel (maps, charts, GradCAM heatmaps) and download GeoTIFF / GeoJSON exports.
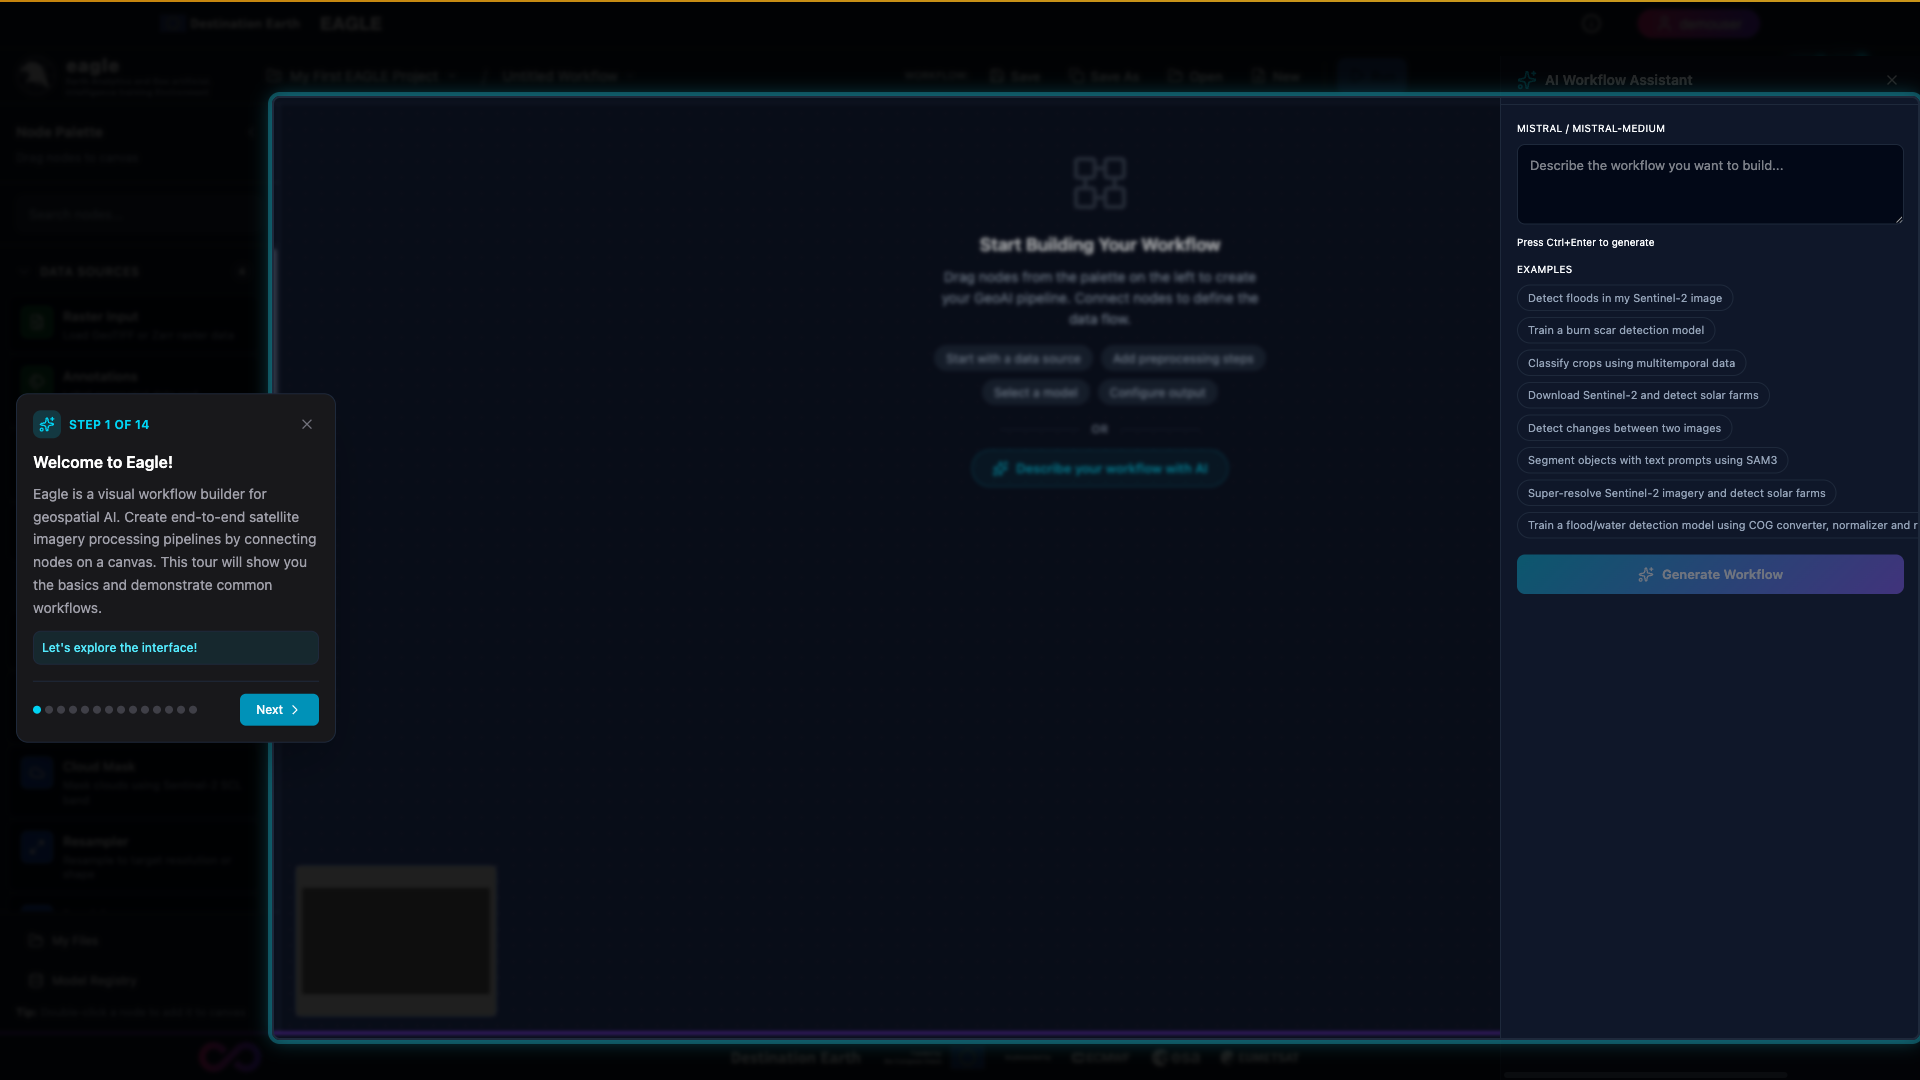
Figure 7: The interactive onboarding tour, accessible from the “Tour” button in the top-right corner of the canvas.
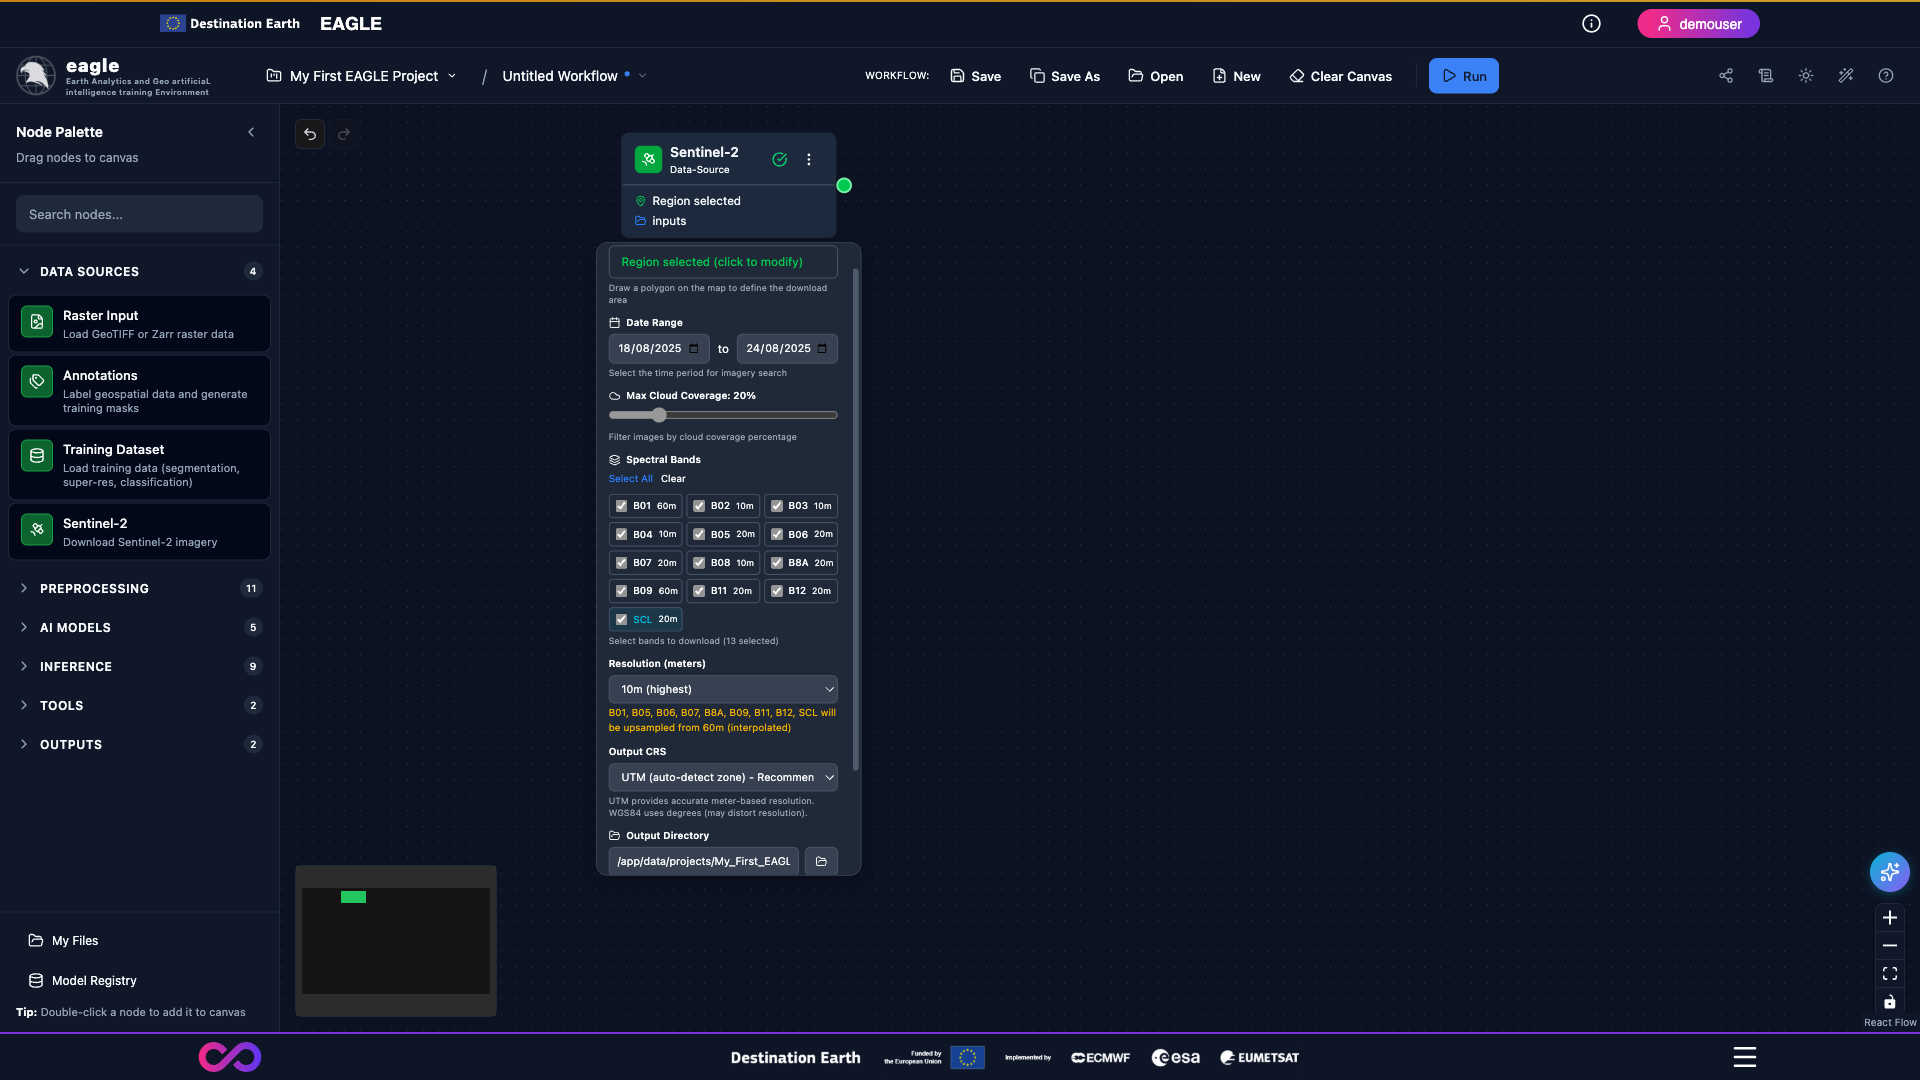
Figure 8: A configured Sentinel-2 Data Source node showing date range, cloud-cover threshold, band selection and resolution.
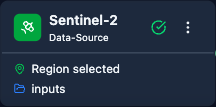
Figure 9: Close-up of the Sentinel-2 node header indicating that a region and inputs have been selected.
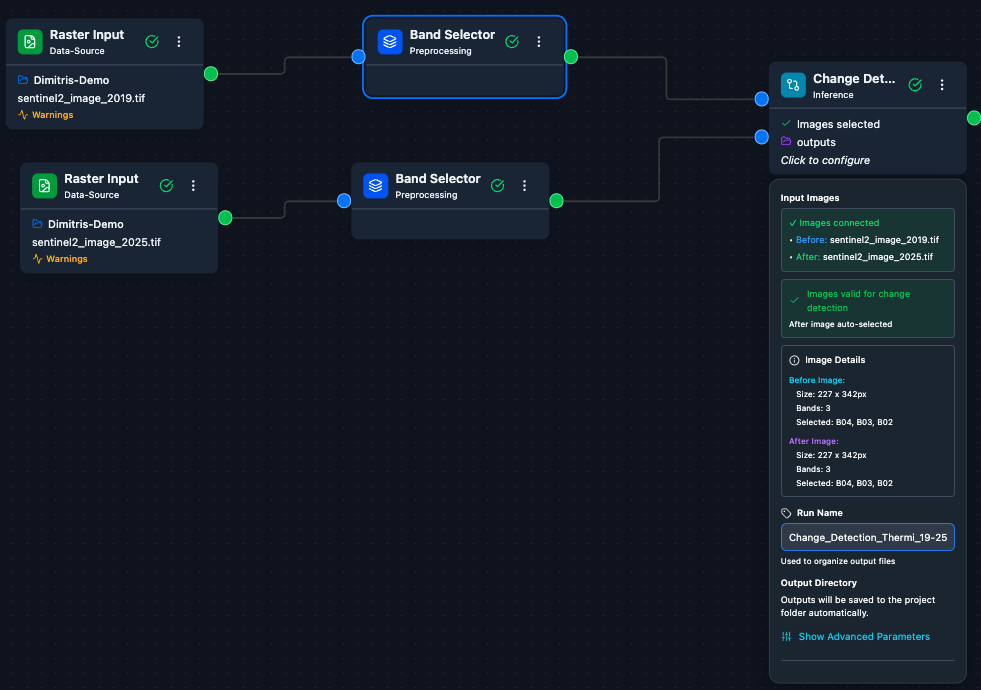
Figure 10: An example end-to-end change-detection workflow connecting two Raster Inputs, Band Selectors and a Change Detection inference node.
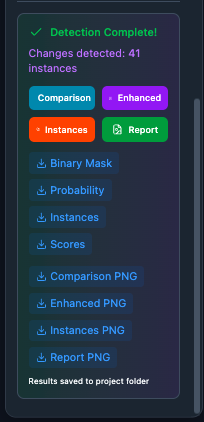
Figure 11: The change-detection results panel offering Comparison, Enhanced, Instances and Report previews together with download links.
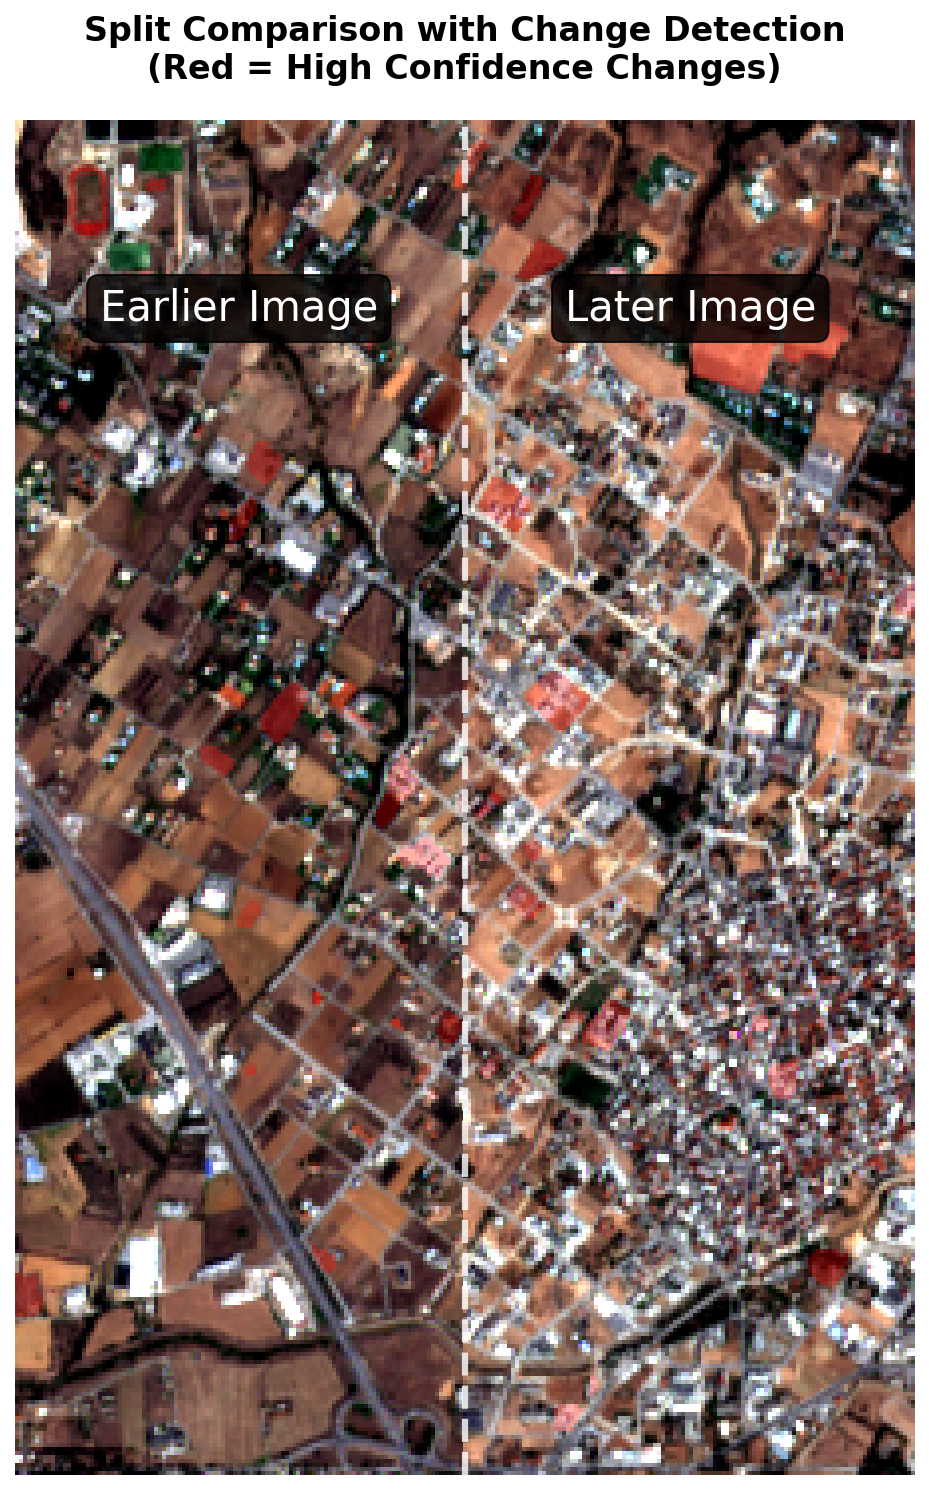
Figure 12: A side-by-side split comparison highlighting high-confidence changes between the earlier and later Sentinel-2 acquisitions.
License
Copyright © 2026 Destination Earth. All rights reserved.