2. The SenCore Monitoring Interface
The SenCore interface is organized into five primary tabs, providing distinct, high-level views of the monitoring network: the Dashboard, the Map View, the Table View, the Compare view, and the Groups view.
2.1. Main Dashboard View
The Main Dashboard is the default view upon login. It provides an at-a-glance summary of the entire sensor network’s real-time status. This view is comprised of two main components, as shown in Figure 2.
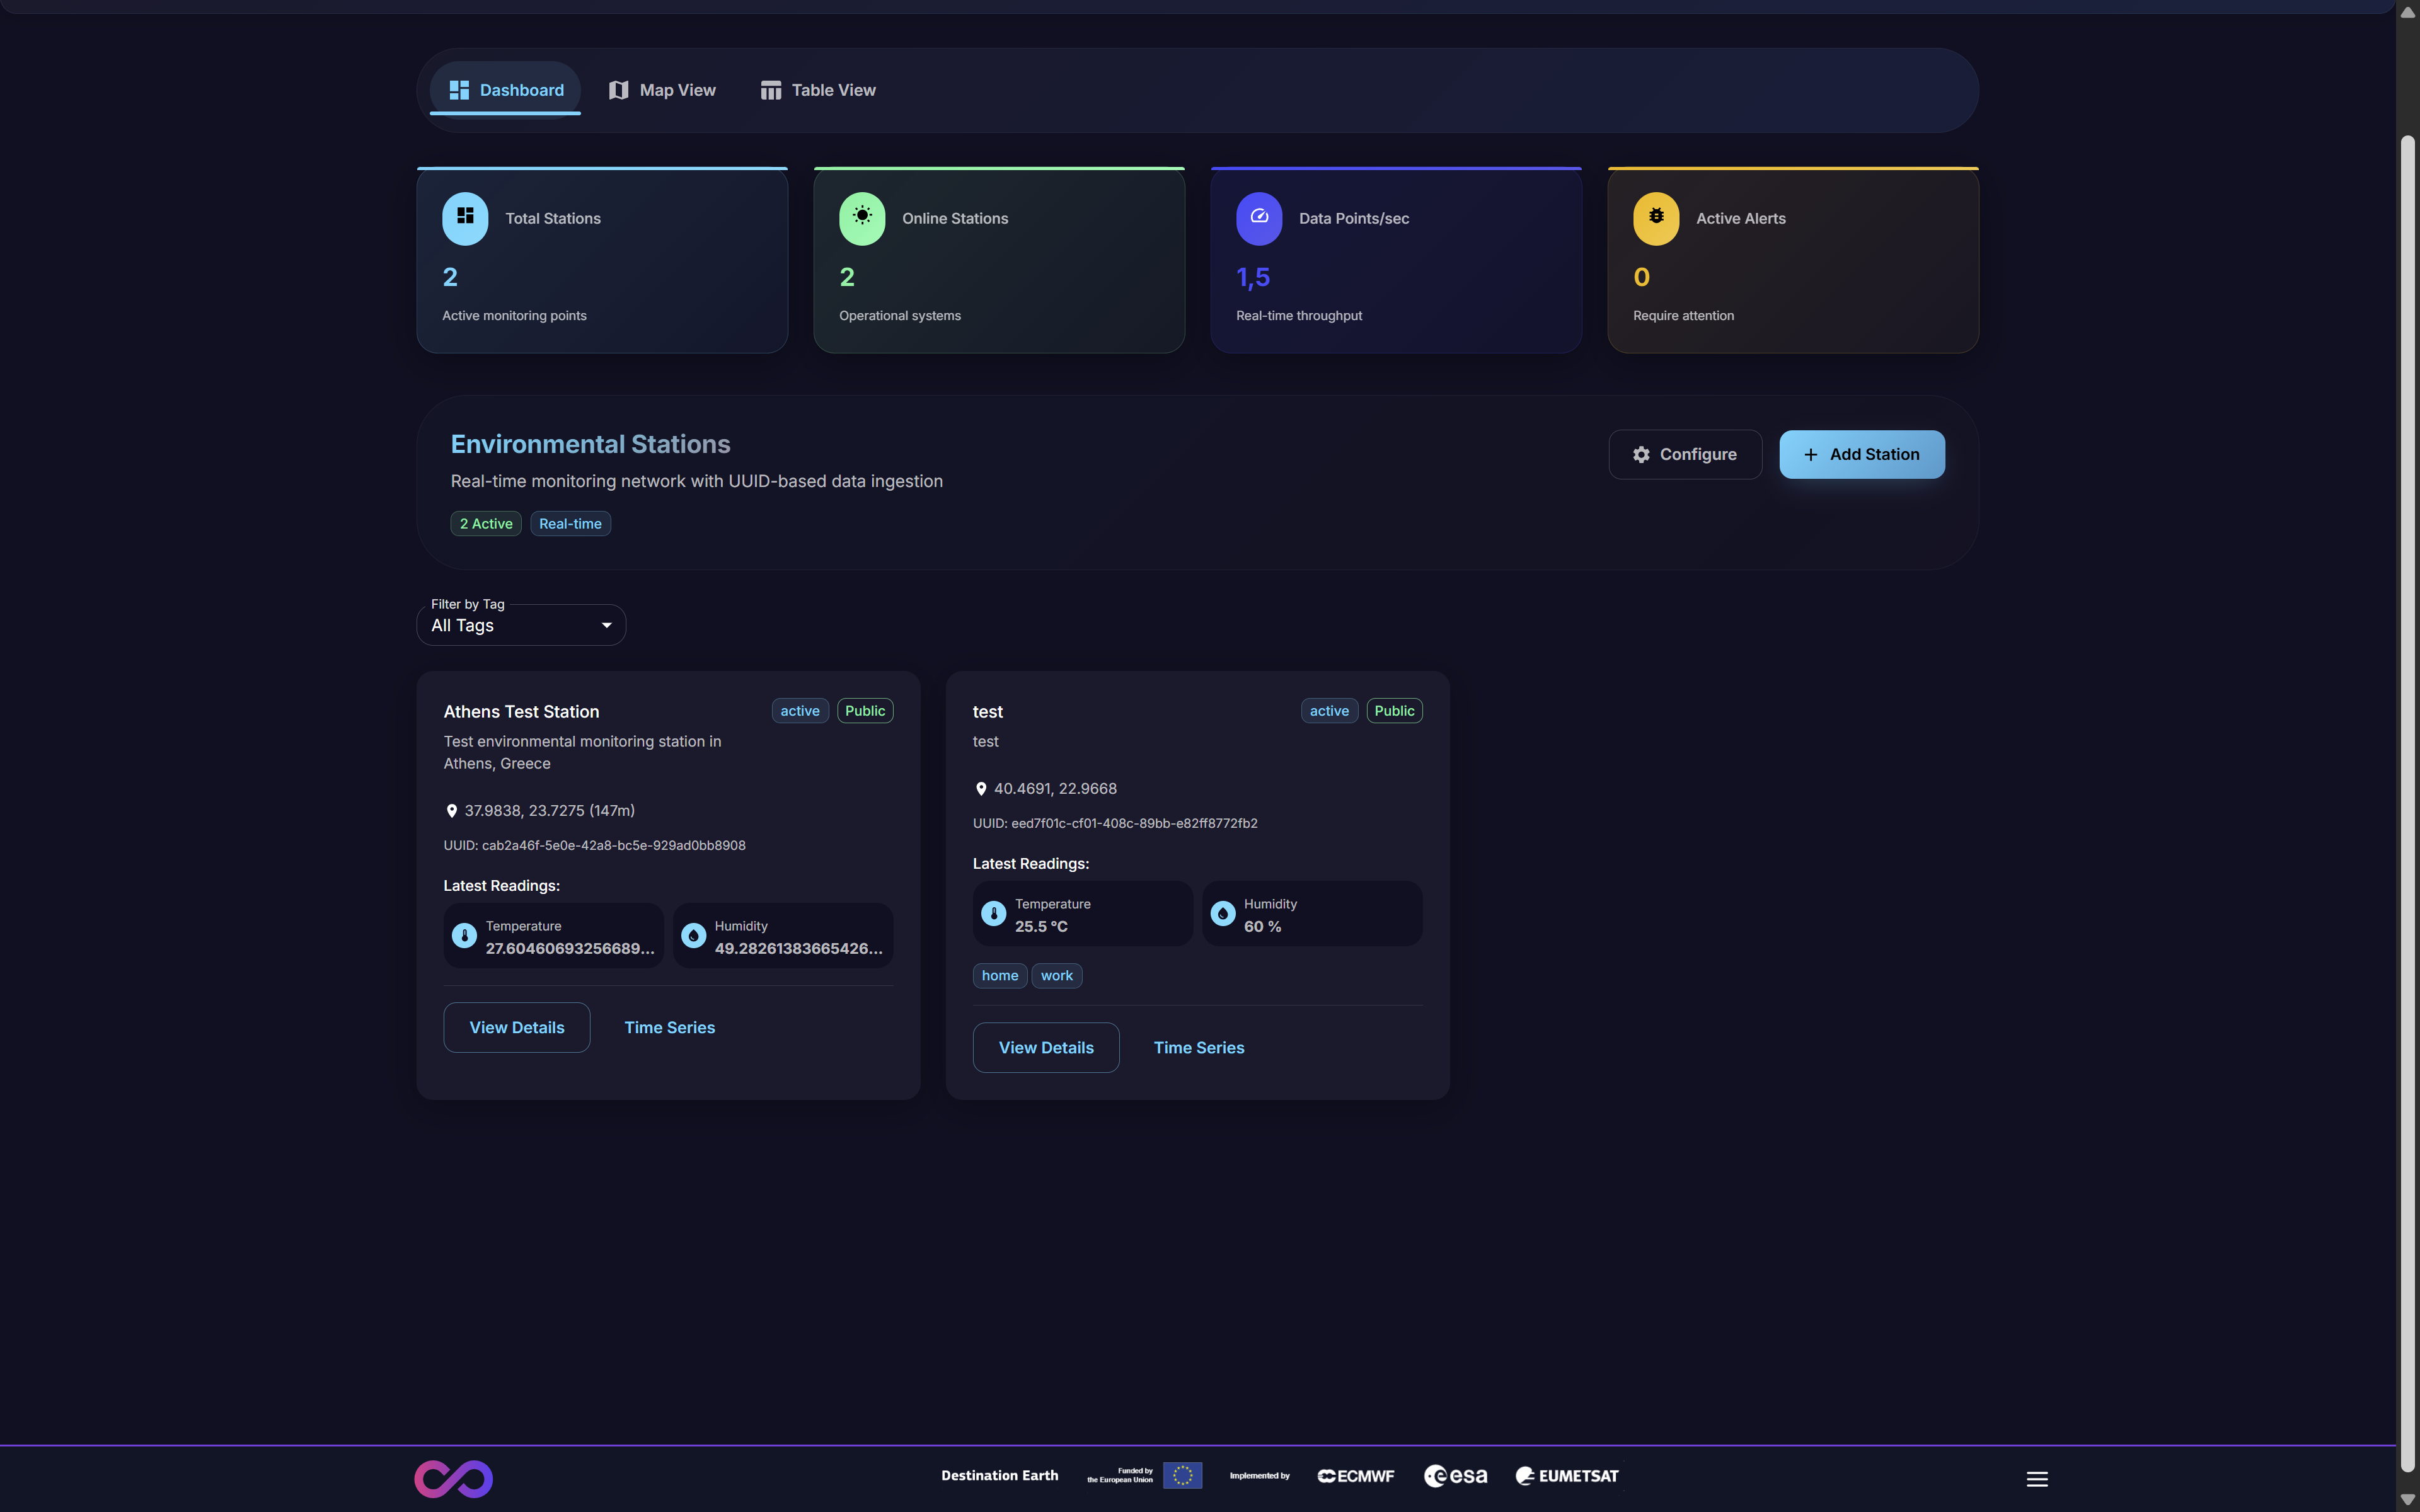
Figure 2: The SenCore Main Dashboard
- Metrics Bar
A persistent bar at the top of the interface displays four key real-time metrics for a high-level operational overview:
Total Stations: The total number of monitoring stations registered to the account.
Online Stations: The subset of stations currently active and successfully transmitting data.
Data Points/sec: The real-time data ingestion throughput, indicating the volume of data being processed by the platform.
Active Alerts: The number of stations or data points that are triggering pre-defined alert conditions and may require attention.
- Environmental Stations List
The main body of the dashboard lists all registered monitoring stations as individual “cards.” Each card displays:
Station Name (e.g., “Athens Test Station”).
Status tags (e.g., “active,” “public”).
A brief description and the station’s unique UUID.
Latest Readings: A snapshot of the most recent data received (e.g., Temperature, Humidity).
Action buttons, including View Details and Time Series.
2.2. Geospatial Map View
The Map View tab provides a geospatial representation of all registered monitoring stations, which is essential for visualizing the spatial distribution and density of the sensor network.
As shown in Figure 3, the map interface displays pins at the precise geographic coordinates of each station.
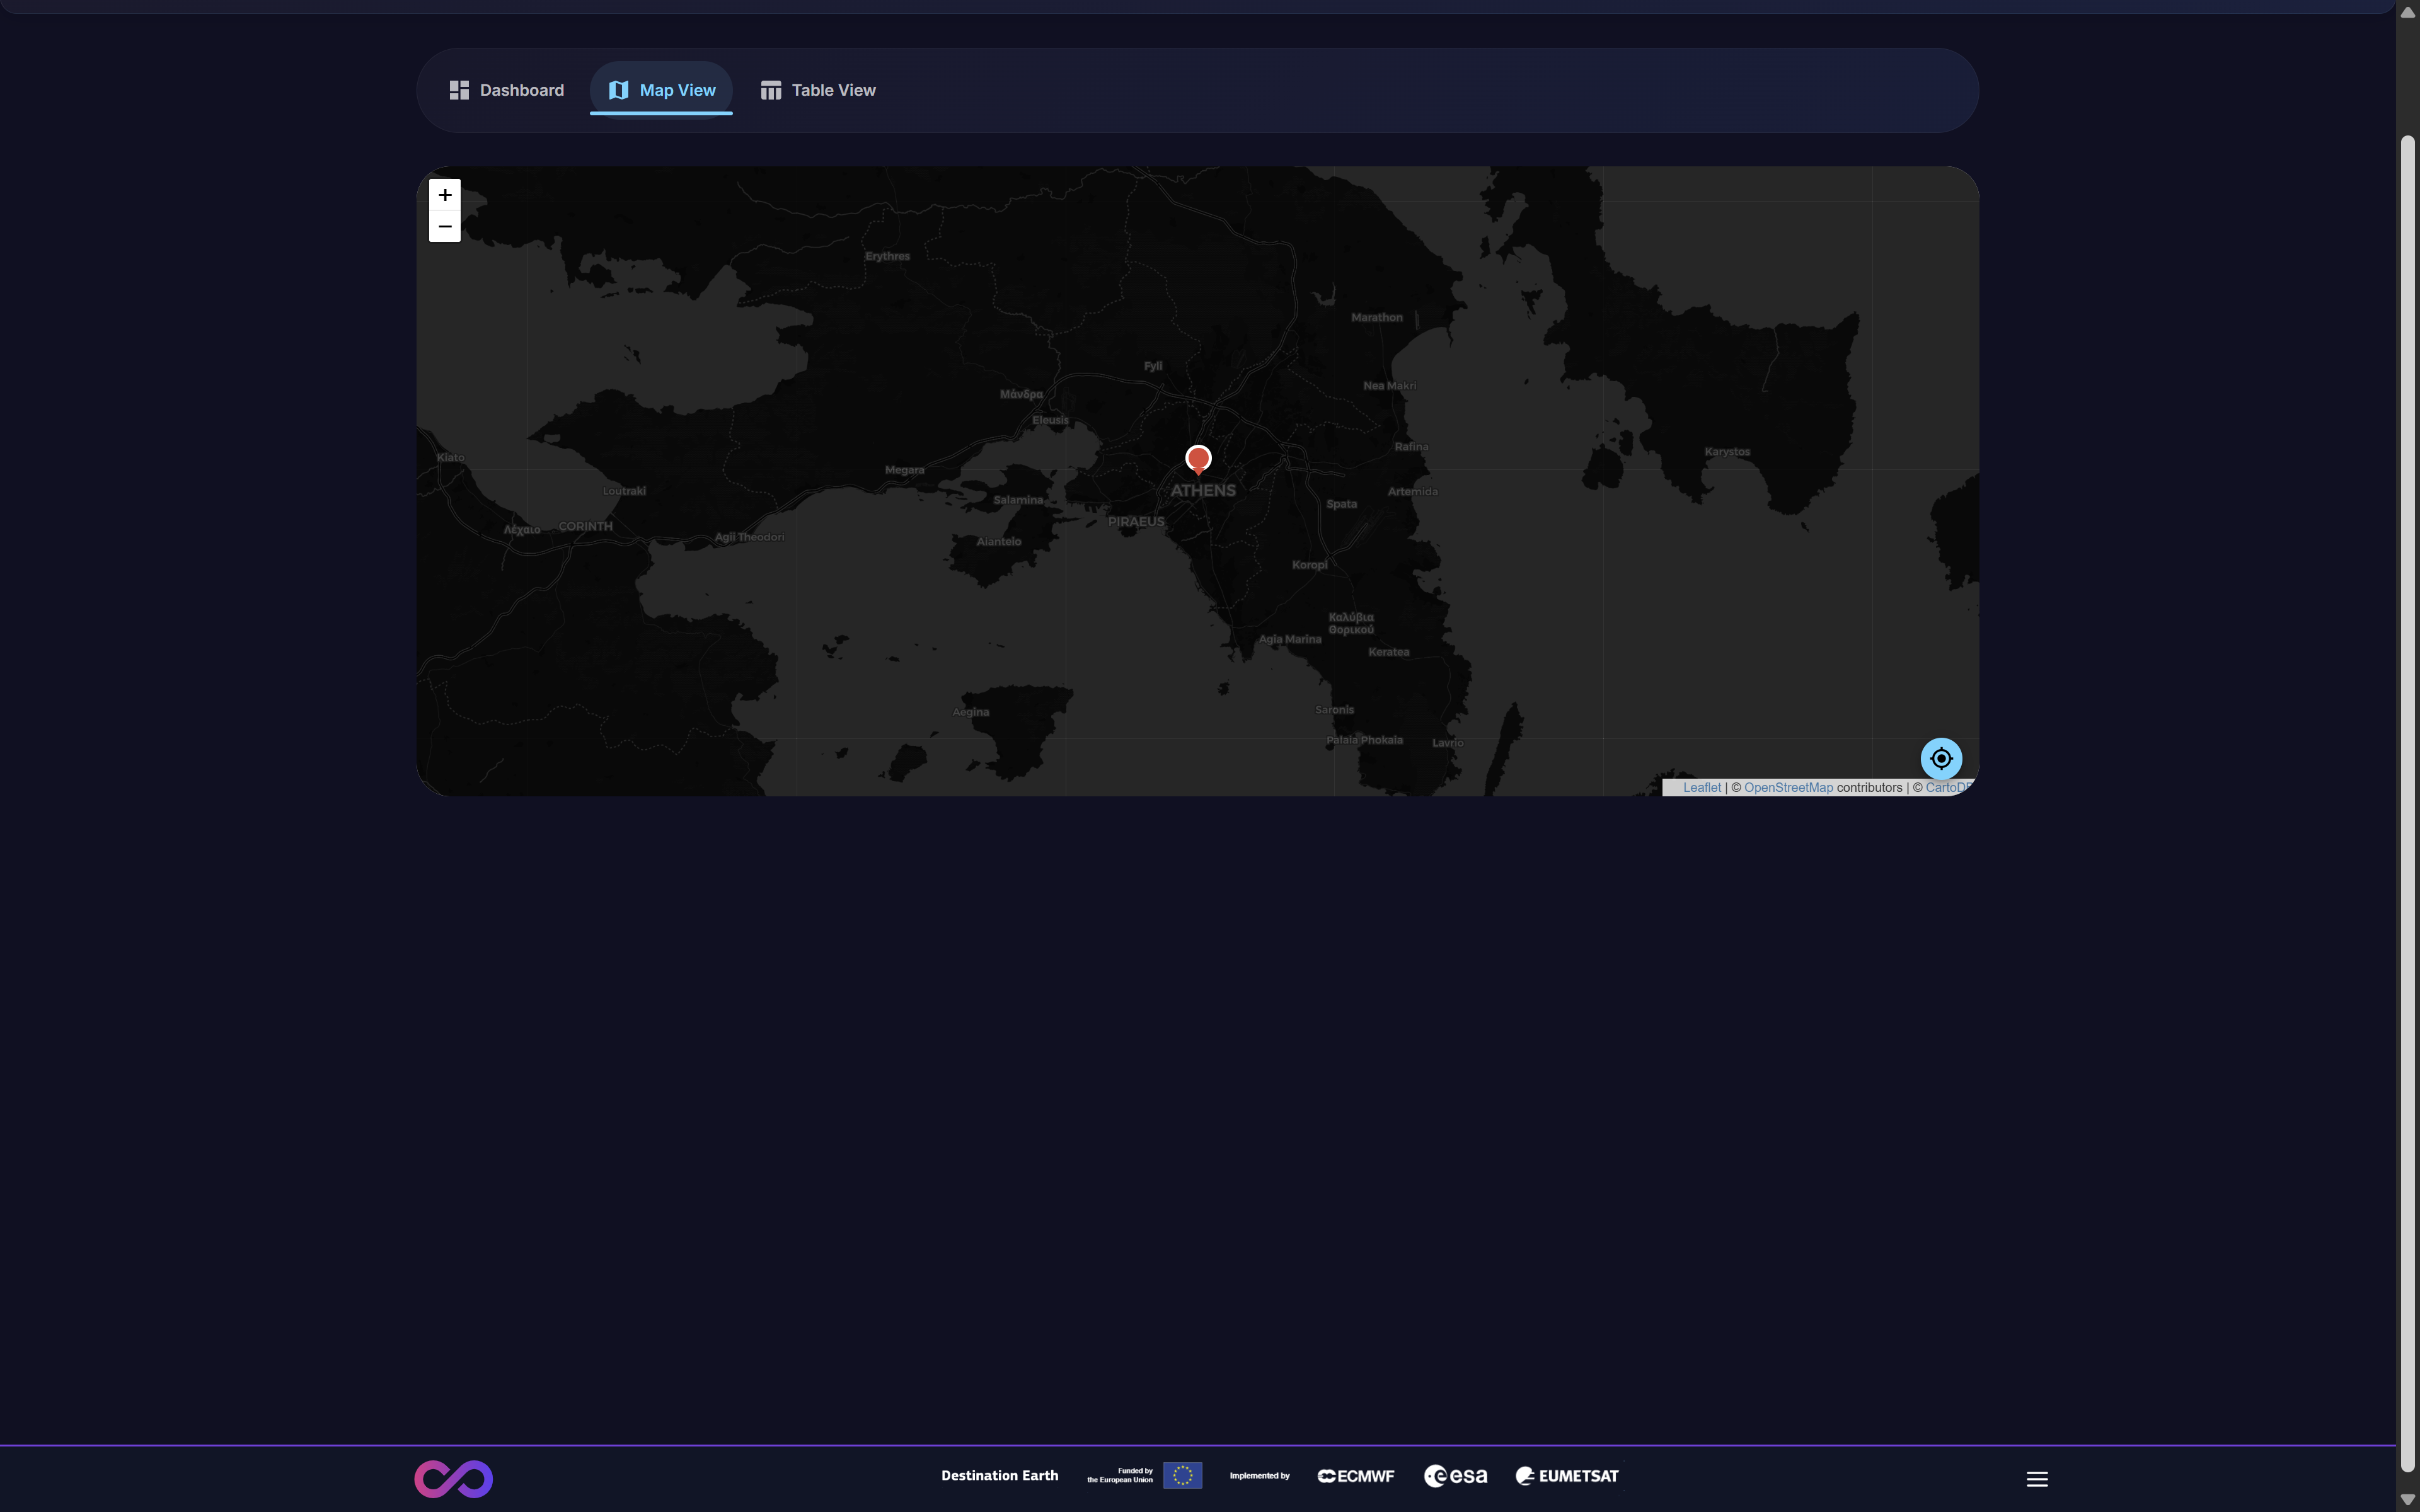
Figure 3: Geospatial Map View of registered stations
Clicking a station pin on the map will open a summary pop-up card (Figure 4). This card displays key information, including the Station Name, Description, Owner, and Latest Readings. It also provides a View Full Details button, which serves as a shortcut to the detailed station modal (see Section 3.2).
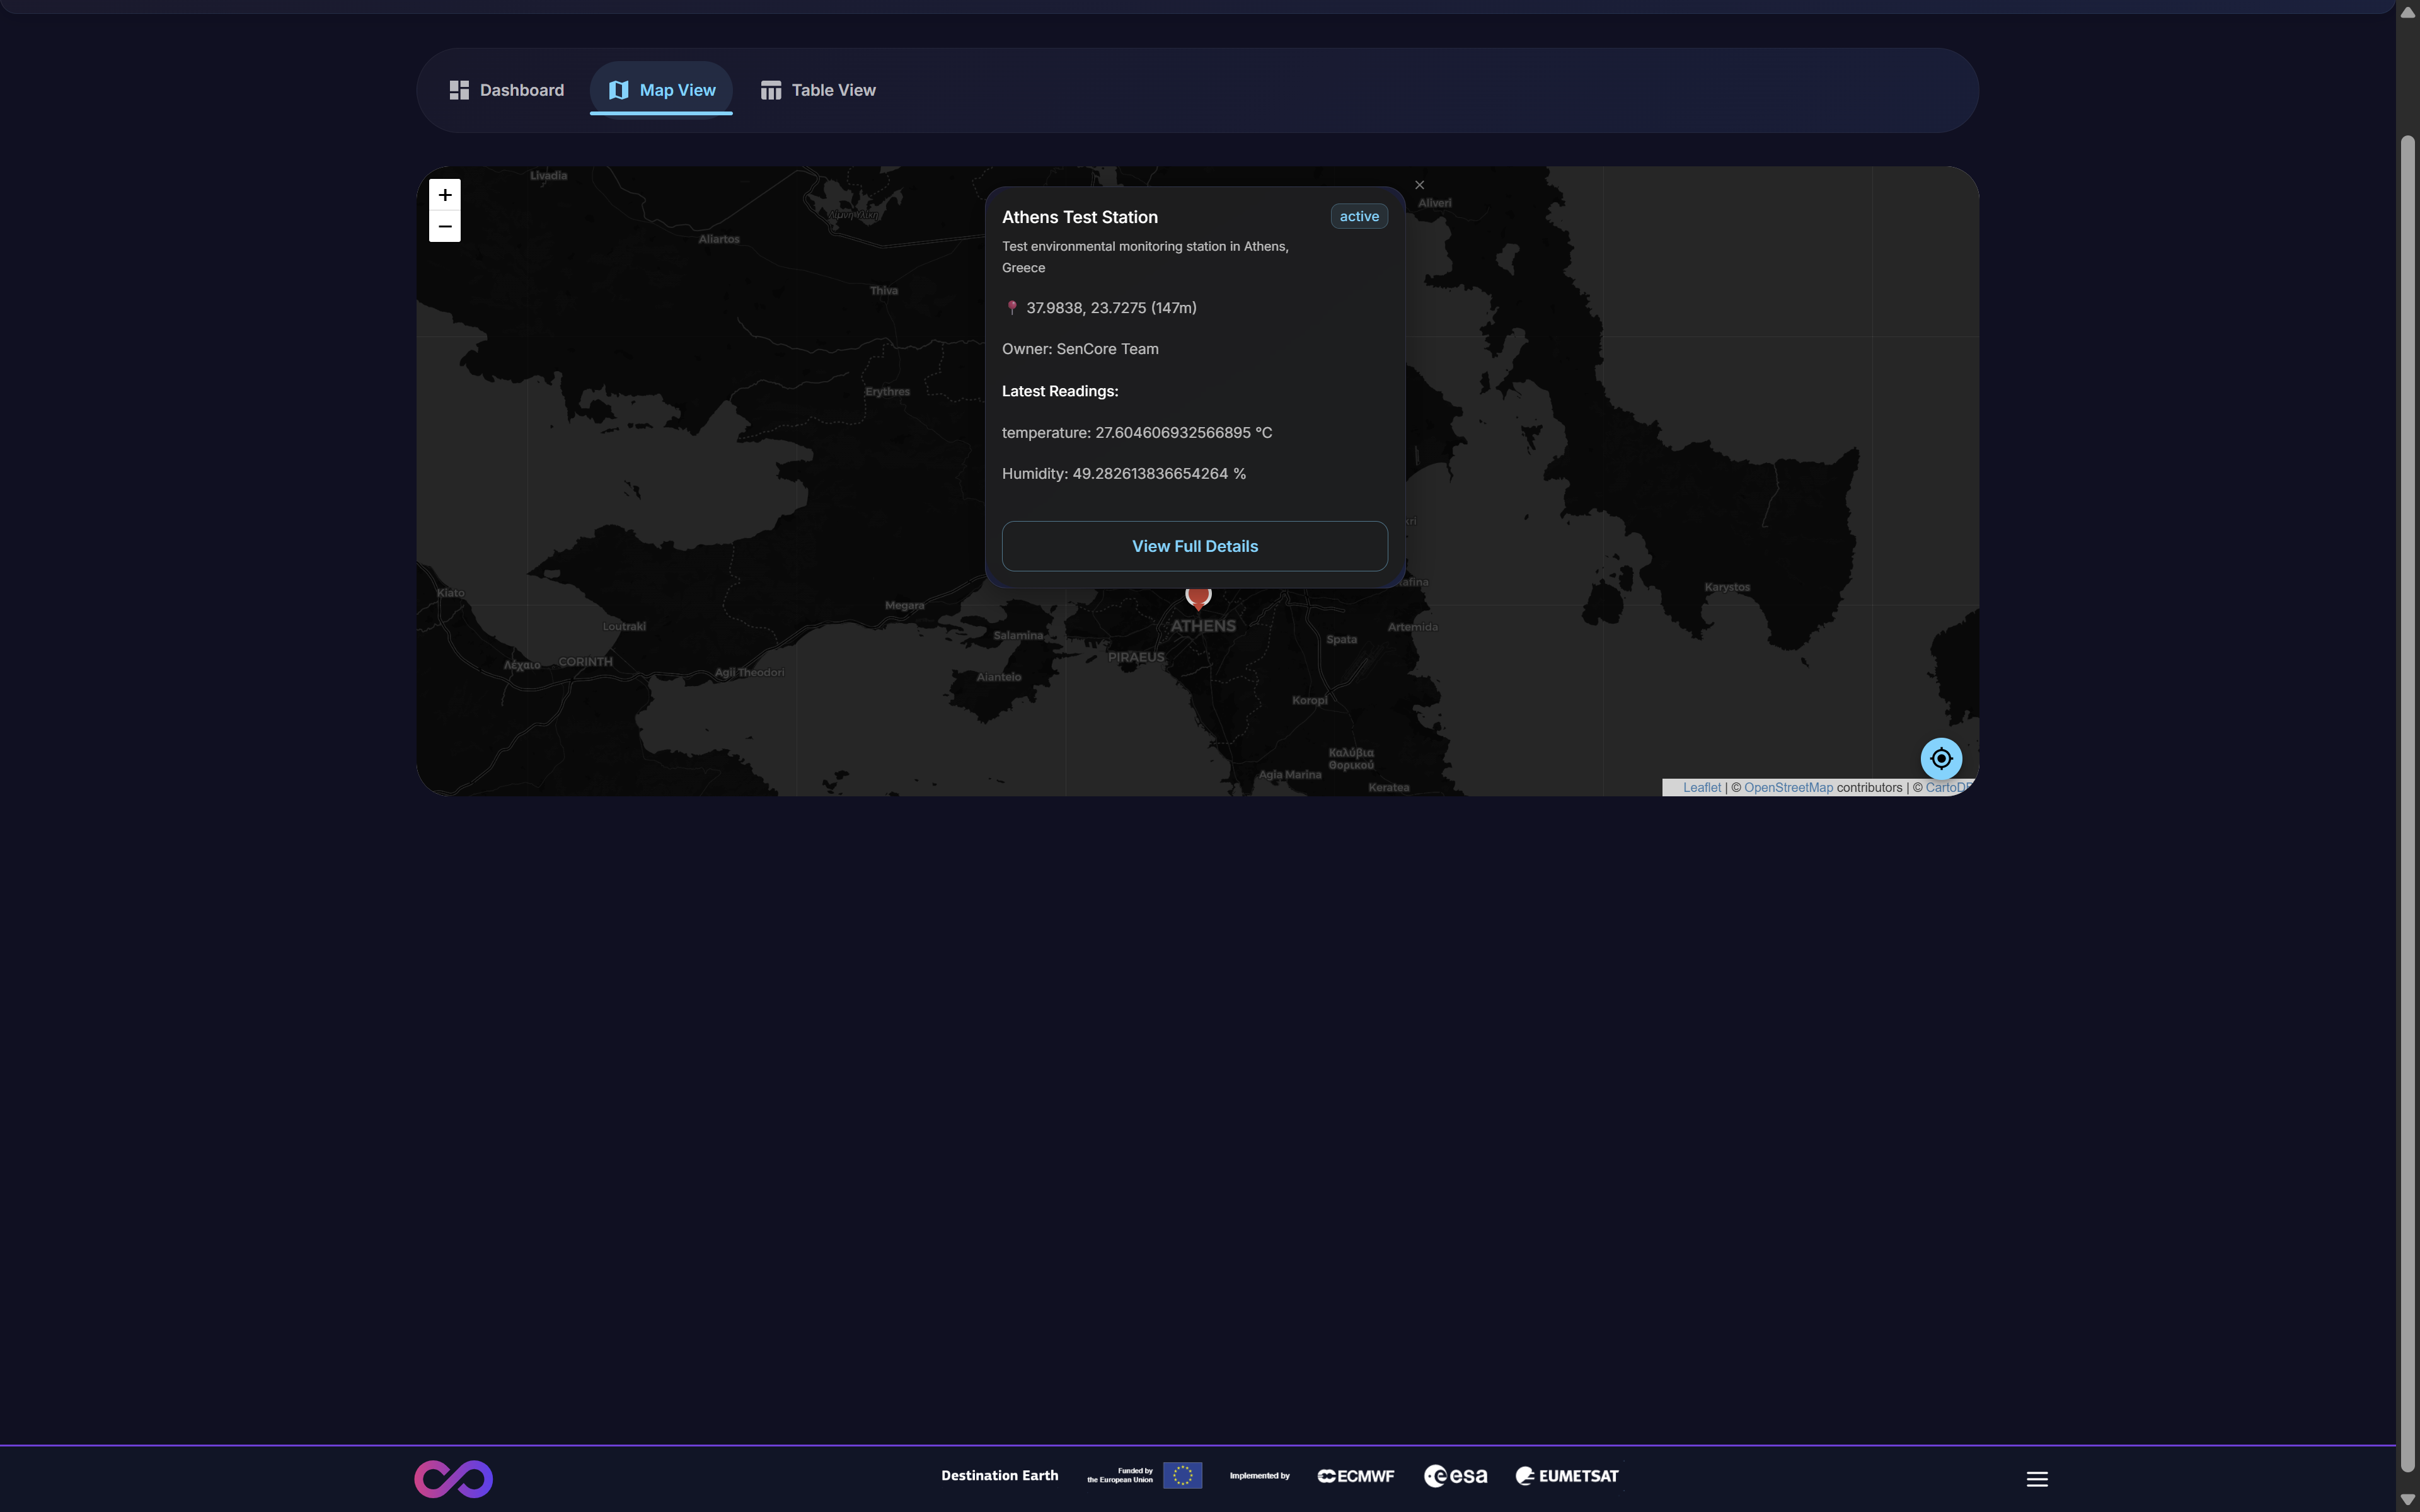
Figure 4: Station summary pop-up in Map View
2.2.1. Geospatial Radius Filter
The Map View includes a powerful geospatial filtering capability that allows users to query stations based on their proximity to a specific location. This feature leverages foundational geospatial indexing to support location-based queries, such as retrieving all stations within a given radius.
To use the radius filter:
Click on the map at the desired center point. A prompt will appear instructing you to “Click on the map to set filter center” (Figure 5).
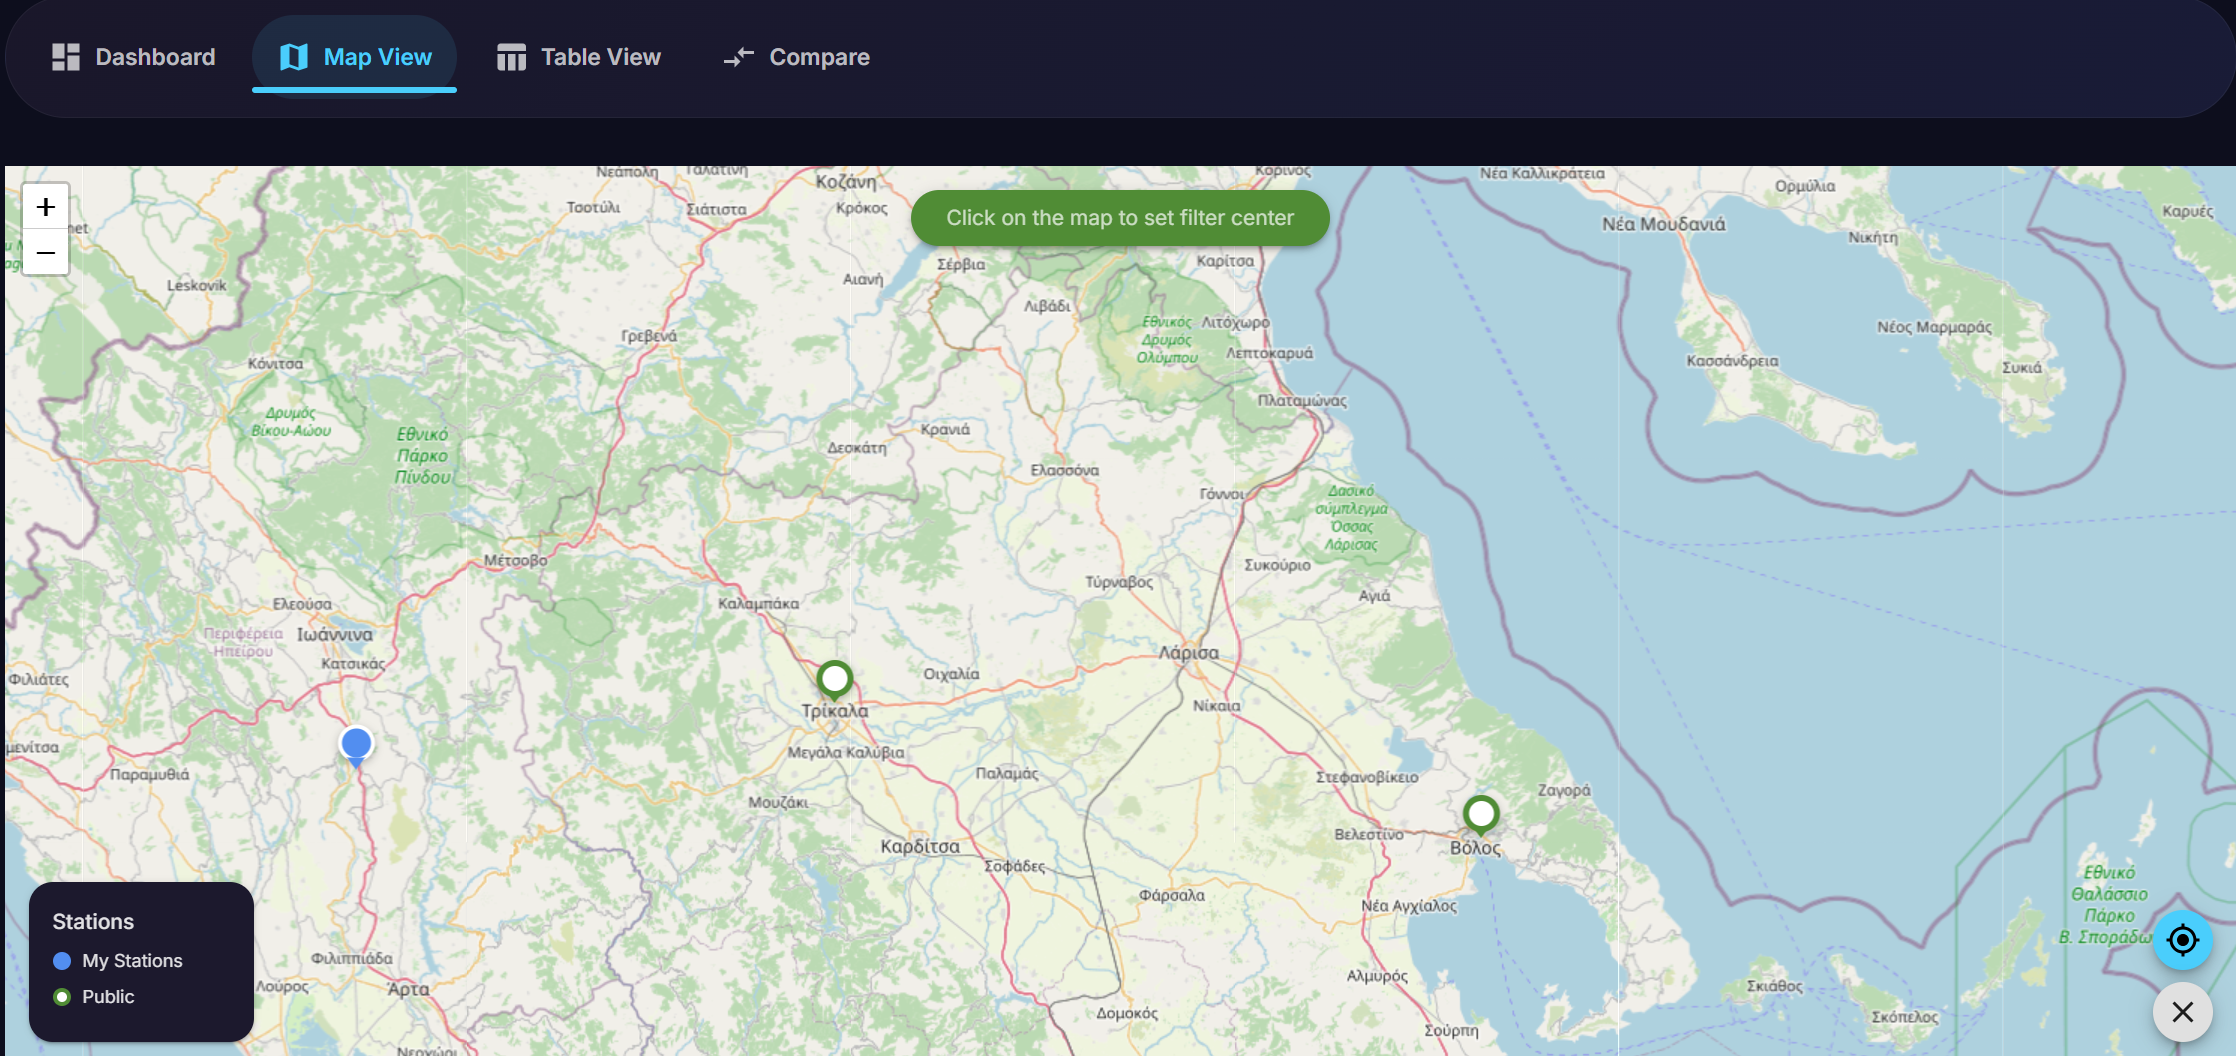
Figure 5: Initiating the radius filter by clicking on the map
After selecting the center point, a “Set Radius Filter” dialog appears. Enter the desired radius in kilometers (e.g., 20 km) and click Apply Filter (Figure 6).
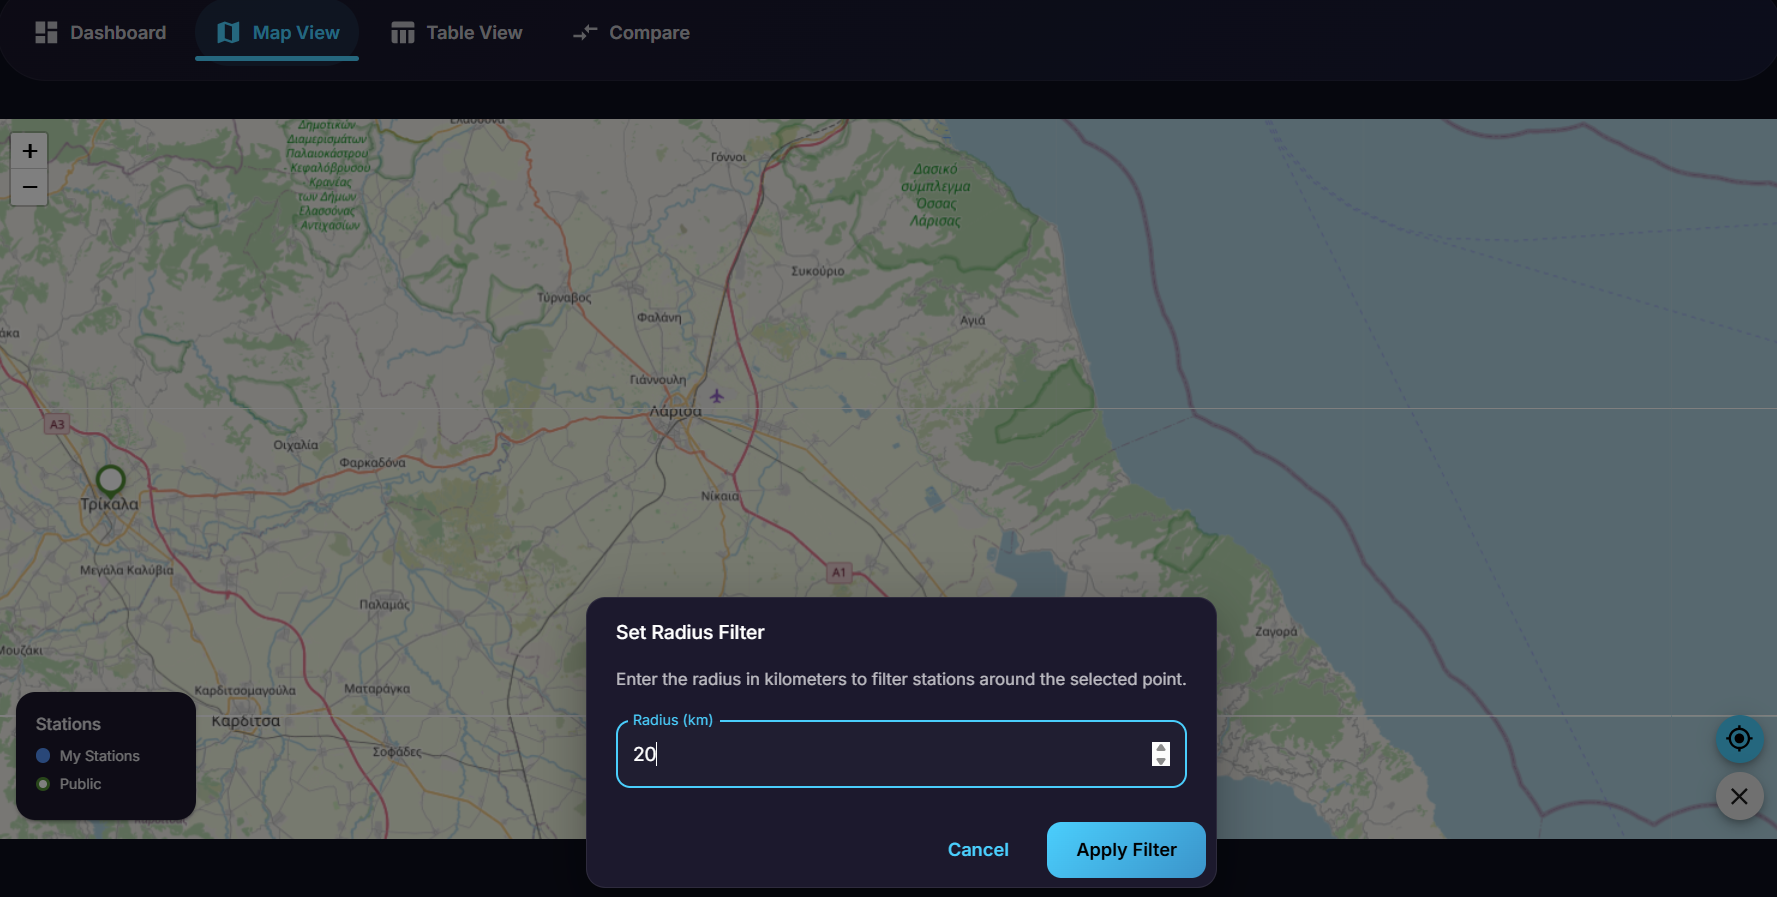
Figure 6: Setting the radius filter distance in kilometers
The map will update to display only the stations within the specified radius. A visual circle overlay indicates the filtered area, and an information box in the top-left corner confirms the active filter settings (e.g., “Radius Filter: 20 km, Stations: 1”) (Figure 7).
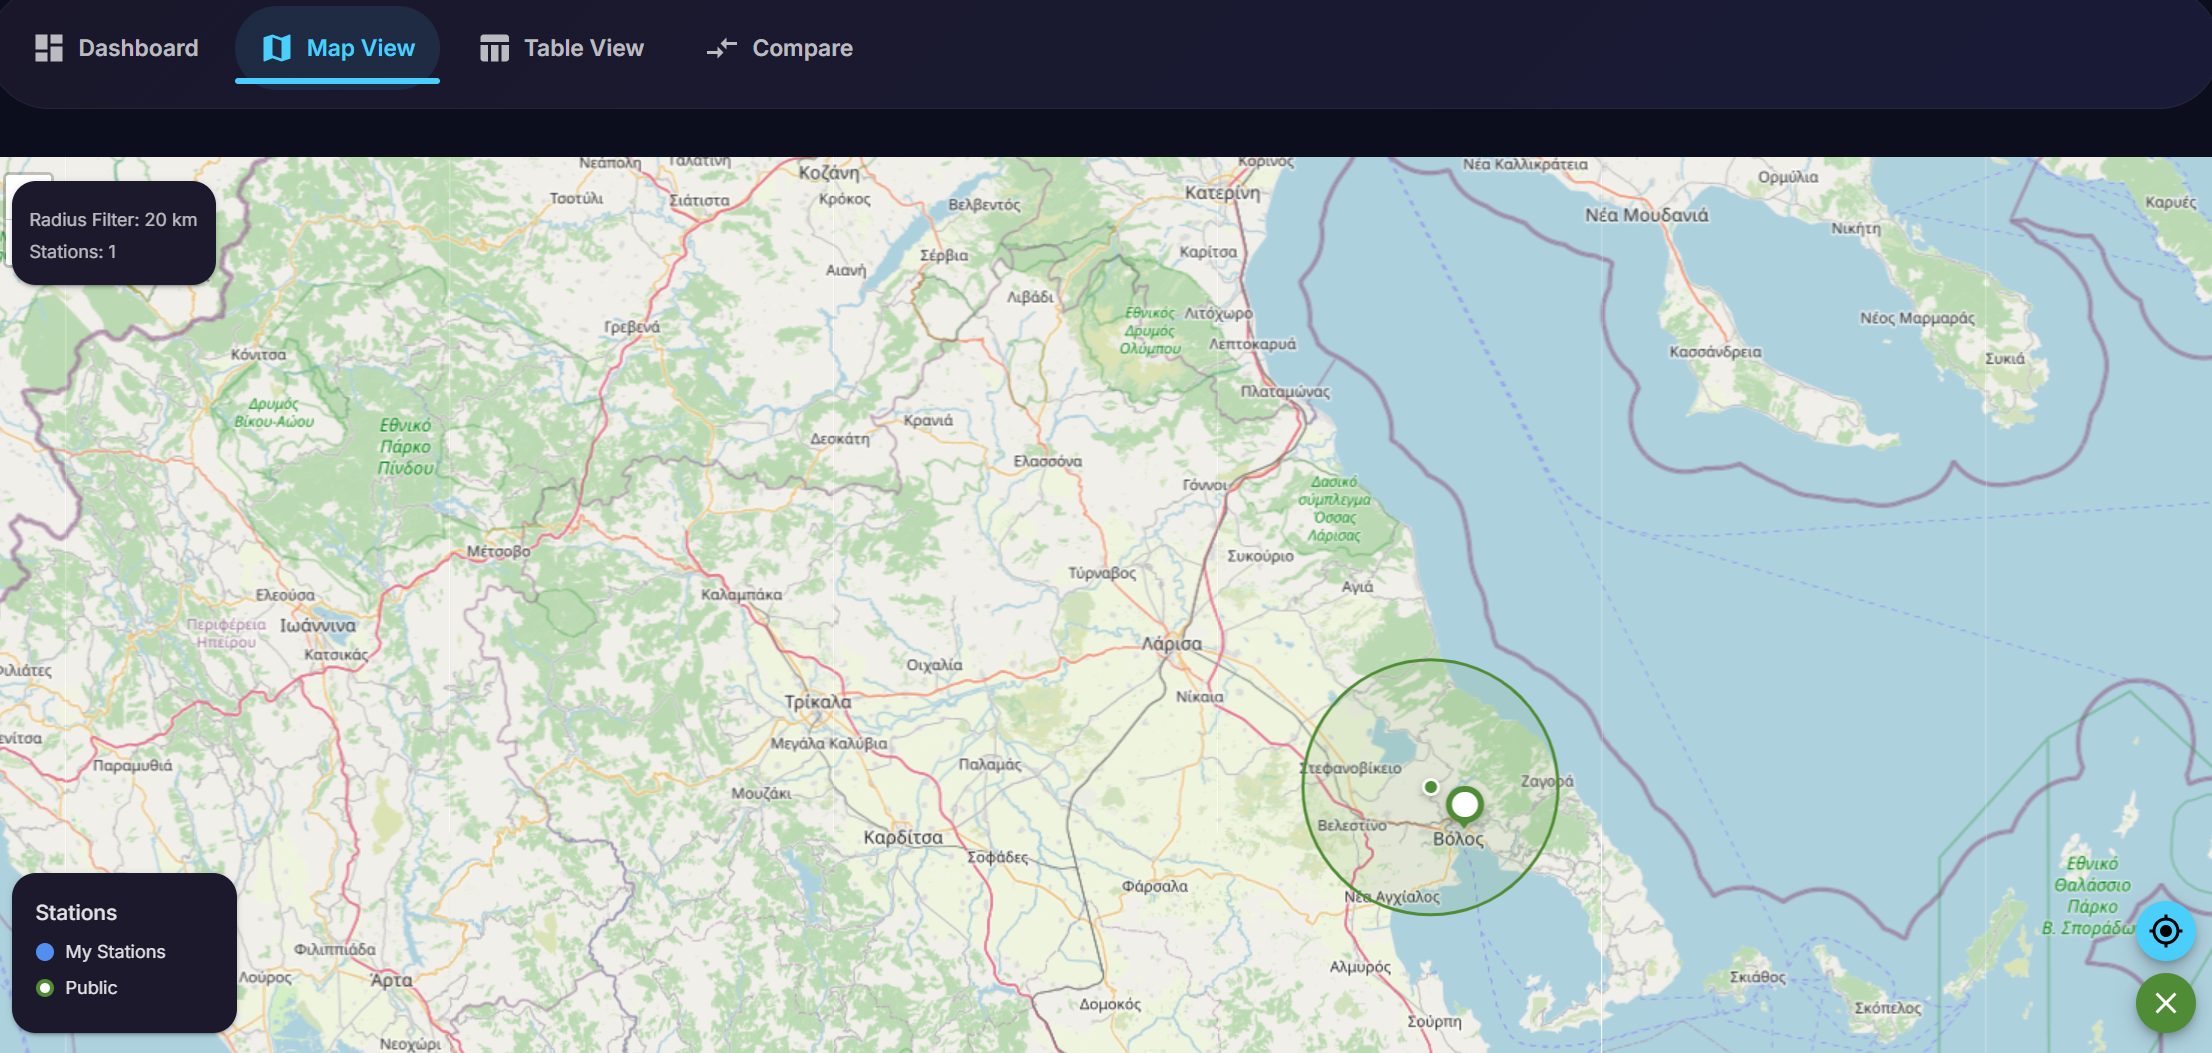
Figure 7: Map view with active radius filter showing filtered stations
This feature is essential for users who need to focus on stations within a specific geographic area, enabling efficient regional monitoring and analysis.
2.2.2. ESA-Approved GISCO Boundaries & EC Toponyms
In compliance with the European Commission’s cartographic guidelines as mandated by ESA, the Map View now incorporates official GISCO boundary layers and EC toponyms. This ensures that all map displays are consistent with the approved cartographic standards for all Destination Earth services.
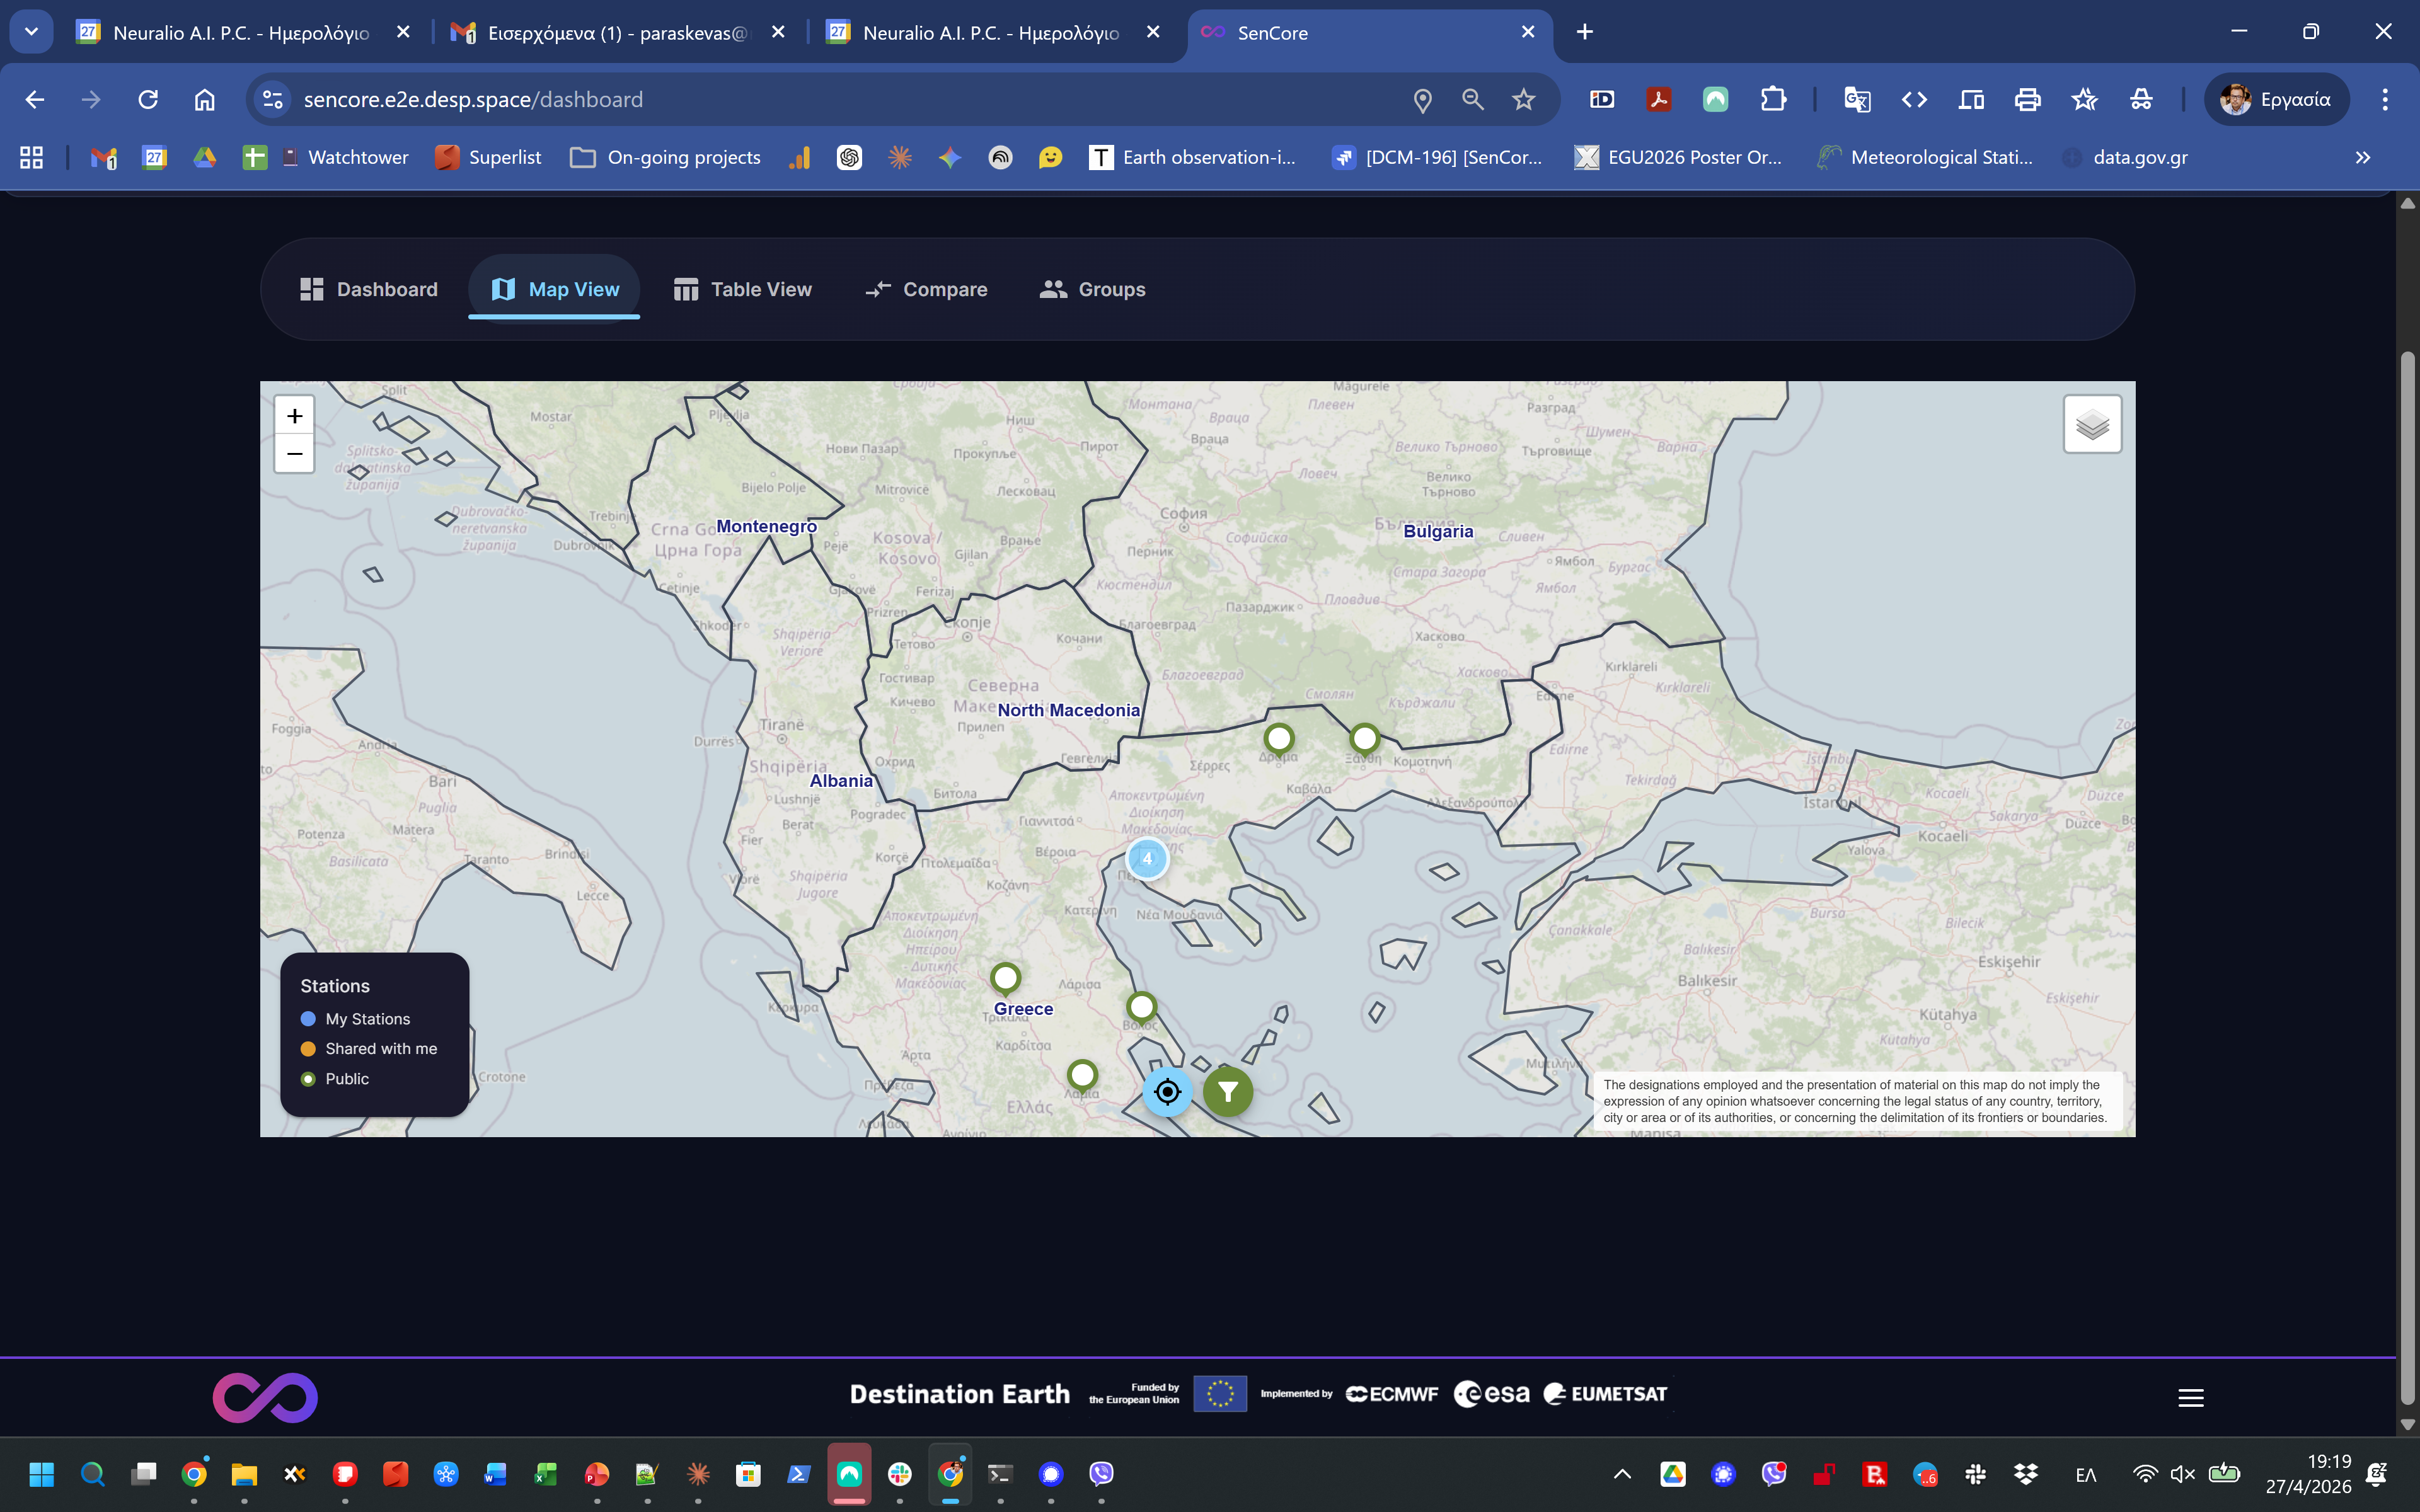
Figure 8: Map View with GISCO Boundaries and EC Toponyms overlay
The map implementation includes:
- GISCO Boundaries Layer
The official GISCO World Boundaries dataset (2024 release) is overlaid on the map as a static GeoJSON layer. This layer is active by default and serves as the primary boundary reference. When enabled, the underlying OpenStreetMap basemap is rendered at 50% opacity so that the GISCO boundaries take visual priority.
- Official EC Toponyms Layer
Country labels are sourced from the official GISCO Label Points dataset, using only the English naming convention (
NAME_ENGL). This layer is available as a toggleable overlay via the map’s layer switcher and is off by default. Native basemap labels are disabled when this layer is active to prevent label doubling.- Mandatory Disclaimer Annotation
A permanent map annotation is displayed in the bottom-right corner of the map view with the following text: “The designations employed and the presentation of material on this map do not imply the expression of any opinion whatsoever concerning the legal status of any country, territory, city or area or of its authorities, or concerning the delimitation of its frontiers or boundaries.”
The layer switcher allows users to toggle between base layers and overlay layers:
Base Layers: OpenStreetMap (default)
Overlays: GISCO Boundaries (on by default), Official EC Toponyms (off by default)
2.3. Platform-Wide Table View
The Table View tab provides a comprehensive, platform-wide, and filterable database of all individual data points ingested from all registered stations. This view is the primary tool for raw data analysis and batch filtering across the entire network.
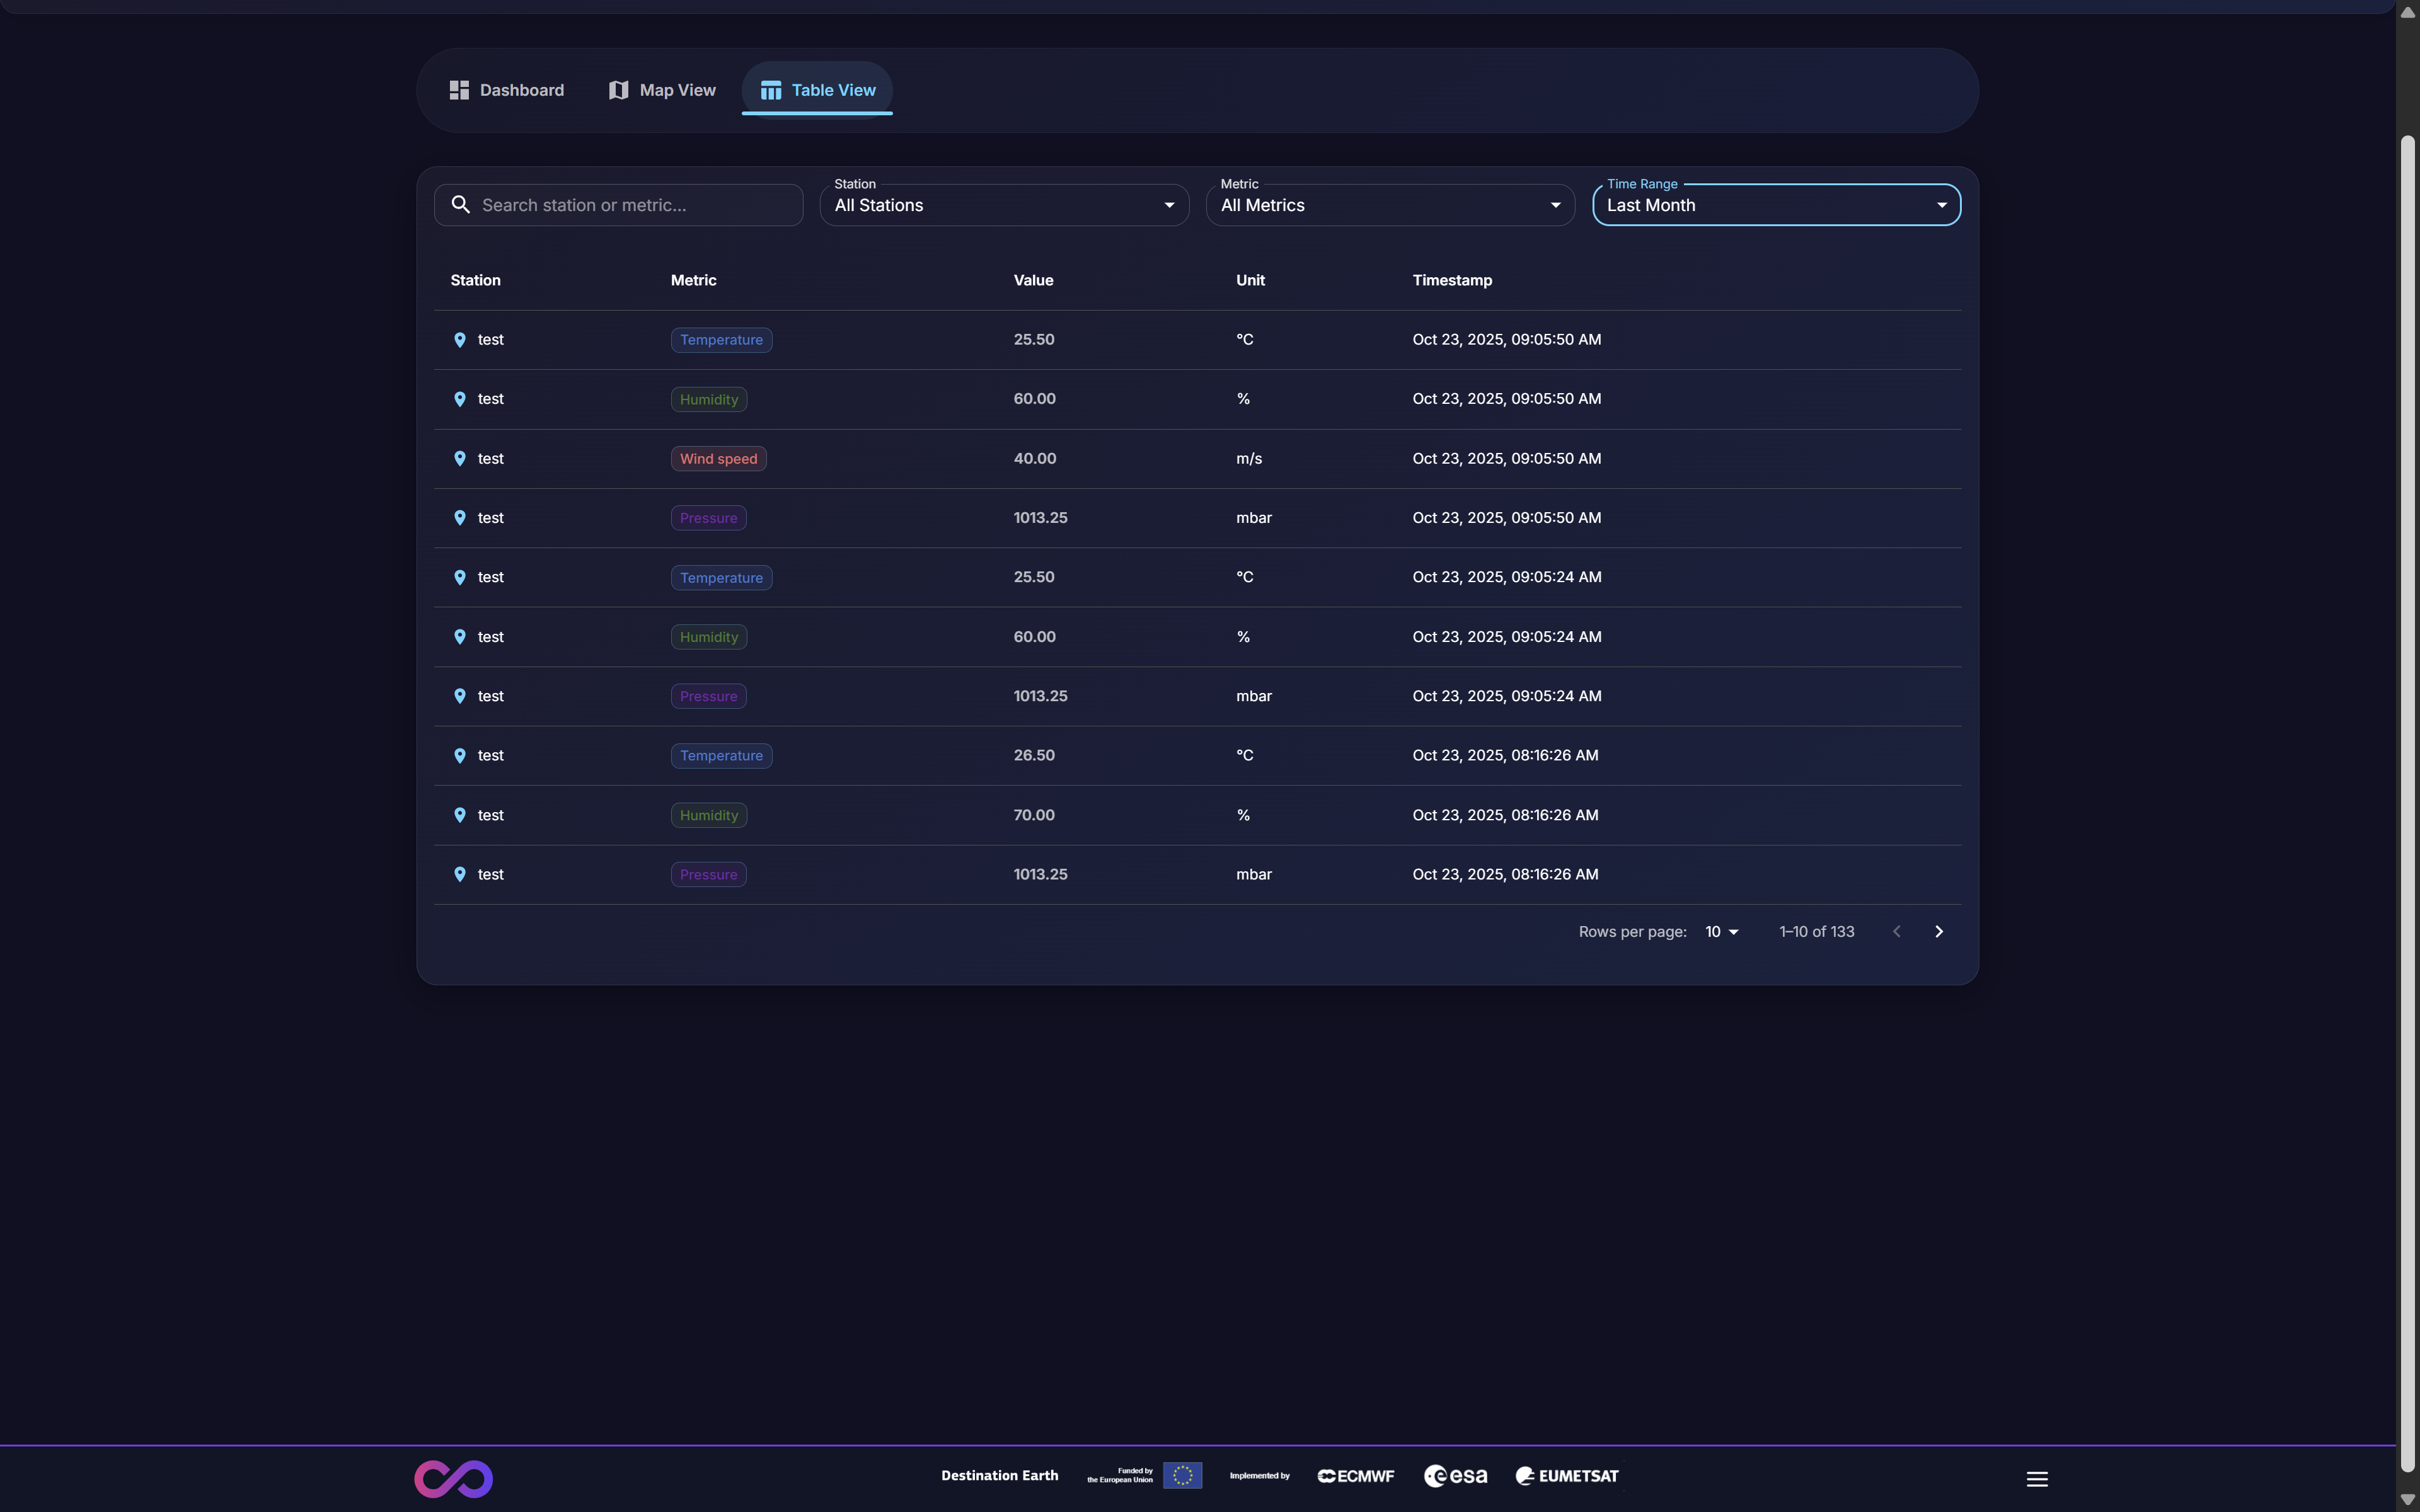
Figure 9: Platform-wide data Table View with filtering
As shown in Figure 9, this interface includes several powerful features:
- Data Columns
The table organizes all ingested data by Station, Metric (e.g., Temperature, Humidity, Pressure), Value, Unit, and an exact Timestamp.
- Basic Filtering
The view provides multiple filtering tools to query the dataset:
Search: A free-text search bar for station or metric names.
Station Filter: A dropdown menu to isolate data from one or more specific stations.
Metric Filter: A dropdown menu to isolate specific types of data (e.g., view only “Temperature” readings from all stations).
Time Range: A date/time picker to select a specific time range (e.g., “Last Month,” “Last 24 Hours,” or a custom range).
- Pagination
The interface includes standard pagination controls (Rows per page, page navigation) to efficiently manage and navigate large datasets.
2.3.1. Advanced Data Querying & Filtering
The Table View includes an enhanced querying engine that supports powerful and flexible multi-parameter queries. This feature allows users to combine multiple filters simultaneously, enabling complex data analysis scenarios.
To access advanced filtering, click the Advanced toggle button in the top-right corner of the filter bar. This expands the Advanced Filters panel (Figure 10).
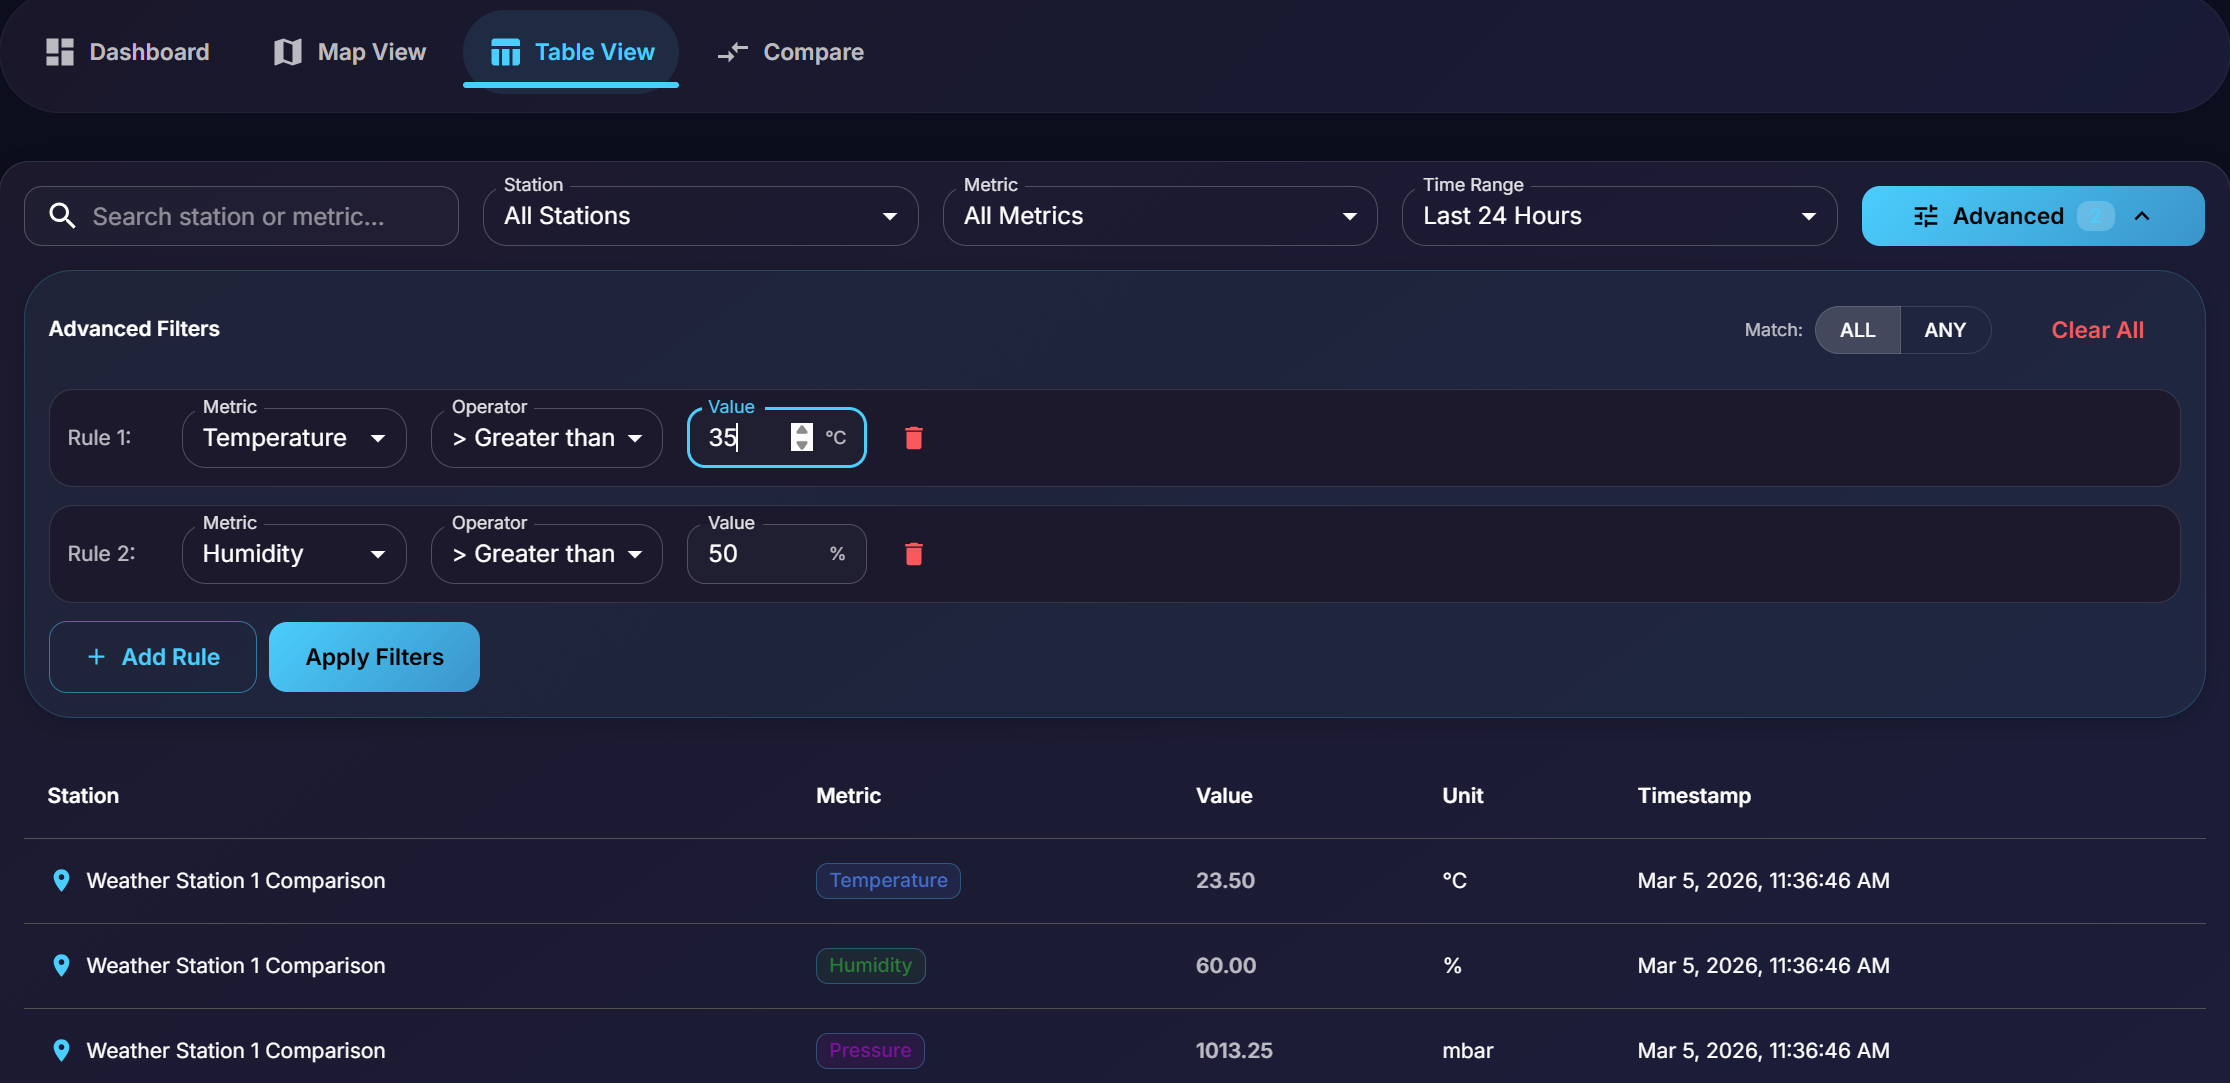
Figure 10: Advanced Data Querying interface with multiple filter rules
The Advanced Filters panel provides the following capabilities:
- Multiple Filter Rules
Users can define multiple filter rules, each consisting of:
Metric: Select the measurement type to filter (e.g., Temperature, Humidity, Pressure).
Operator: Choose a comparison operator (e.g., “Greater than,” “Less than,” “Equal to”).
Value: Specify the threshold value with the appropriate unit.
- Logical Operators
The Match toggle allows users to specify how multiple rules are combined:
ALL: Data points must satisfy all defined rules (logical AND).
ANY: Data points must satisfy at least one rule (logical OR).
- Rule Management
Click + Add Rule to add additional filter conditions.
Click the delete icon (trash) to remove a specific rule.
Click Clear All to reset all filter rules.
Click Apply Filters to execute the query.
This feature is particularly useful for identifying specific environmental conditions, such as finding all data points where temperature exceeds 35°C AND humidity is above 50%.
2.4. Station Comparison View
The Compare tab provides a dedicated interface for side-by-side analysis of data from multiple monitoring stations. This feature is essential for identifying regional variations, validating sensor accuracy, and conducting comparative environmental studies.
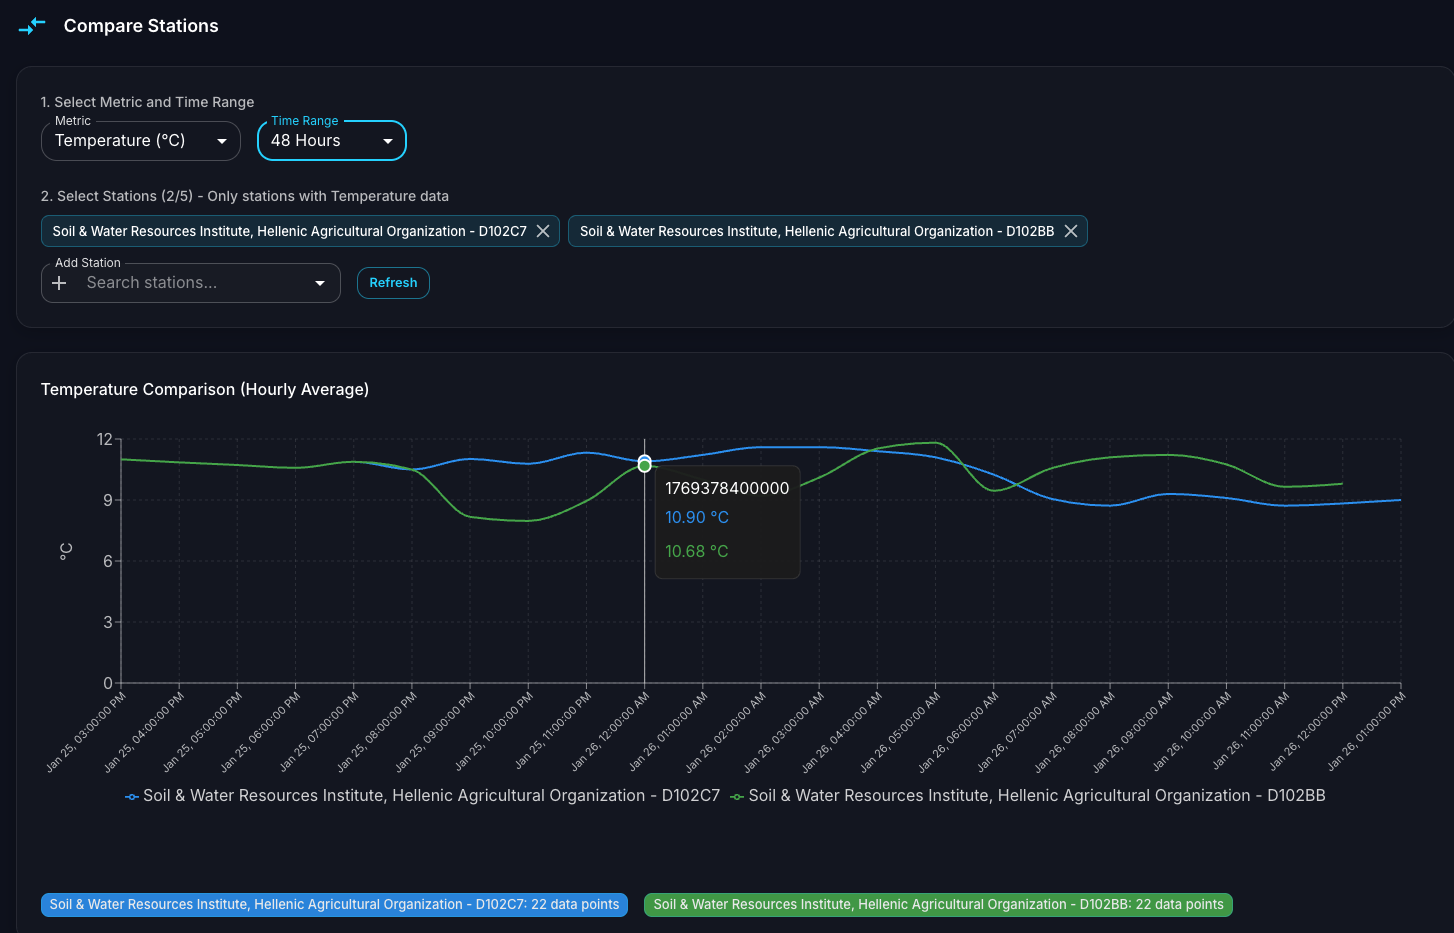
Figure 11: Station Comparison view with multi-station time series chart
The Comparison interface is organized into two main sections:
- Selection Panel
Located at the top of the view, this panel allows users to configure the comparison:
Select Metric and Time Range: Choose the metric to compare (e.g., Temperature) and the time period (e.g., “48 Hours,” “Last Week,” or a custom range).
Select Stations: Add multiple stations to the comparison by searching and selecting from the dropdown. Selected stations appear as tags that can be removed individually. The interface indicates how many stations are selected and limits selection to stations that have data for the chosen metric.
Refresh: Click the Refresh button to update the chart with the latest data.
- Comparison Chart
The main visualization displays overlaid time series data from all selected stations:
Each station’s data is rendered as a distinct colored line for easy differentiation.
Hovering over the chart displays a tooltip with exact values from all stations at that timestamp.
The legend at the bottom identifies each station by name and color.
Summary tags below the chart show the total number of data points for each station.
This feature enables users to quickly identify correlations, discrepancies, or anomalies between stations monitoring similar environmental conditions.
2.5. Station Categories: My Stations, Shared with Me & Public
In v3.0.0, the platform distinguishes between three categories of stations, visible as a legend across the Map View and Dashboard:
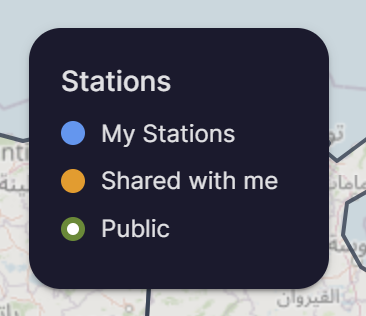
Figure 12: Station categories legend showing My Stations, Shared with me, and Public
My Stations (blue): Stations owned and registered by the current user.
Shared with me (orange): Stations shared with the user through the Group Management system (see Section 4). These stations are owned by other users who have shared them via a group.
Public (green): Stations marked as publicly accessible by their owners, visible to all platform users.
Shared and public stations provide the same analytical experience as owned stations. Clicking on any station — regardless of category — opens the full detail and time-series interface, allowing users to:
View station details, latest readings, and full time-series history
Access the same analytical tools (Time Series, Table View, etc.)
Export station data to CSV
This categorization is central to the collaborative workflow introduced in v3.0.0, enabling teams to monitor shared environmental assets without duplicating station registrations. For details on setting up groups and sharing stations, see Section 4.