3. Station Management
This chapter details the core administrative workflows for managing individual environmental stations, from creation and registration to detailed data inspection.
3.1. Registering a New Station
To begin collecting sensor data, a new station must first be registered within the SenCore platform. This process is initiated by clicking the + Add Station button from the Main Dashboard (visible in Figure 2).
This action opens the “Add New Station” modal, as shown in Figure 13. The user must complete the following metadata fields to define the station:
Station Name & Description: A human-readable identifier.
Location: The precise Latitude and Longitude of the station. This can be entered manually, set automatically via the “Use Current Location” button, or selected by clicking a point on the interactive map.
Metadata: Additional fields for comprehensive records, including Elevation (meters), Timezone, Owner, and Notes.
Tags: Keywords that can be added to group, categorize, and filter stations.
Configuration: Toggles to set the station as a “Public Station” (making its data publicly accessible) or to enable “Debug Mode” for diagnostics.
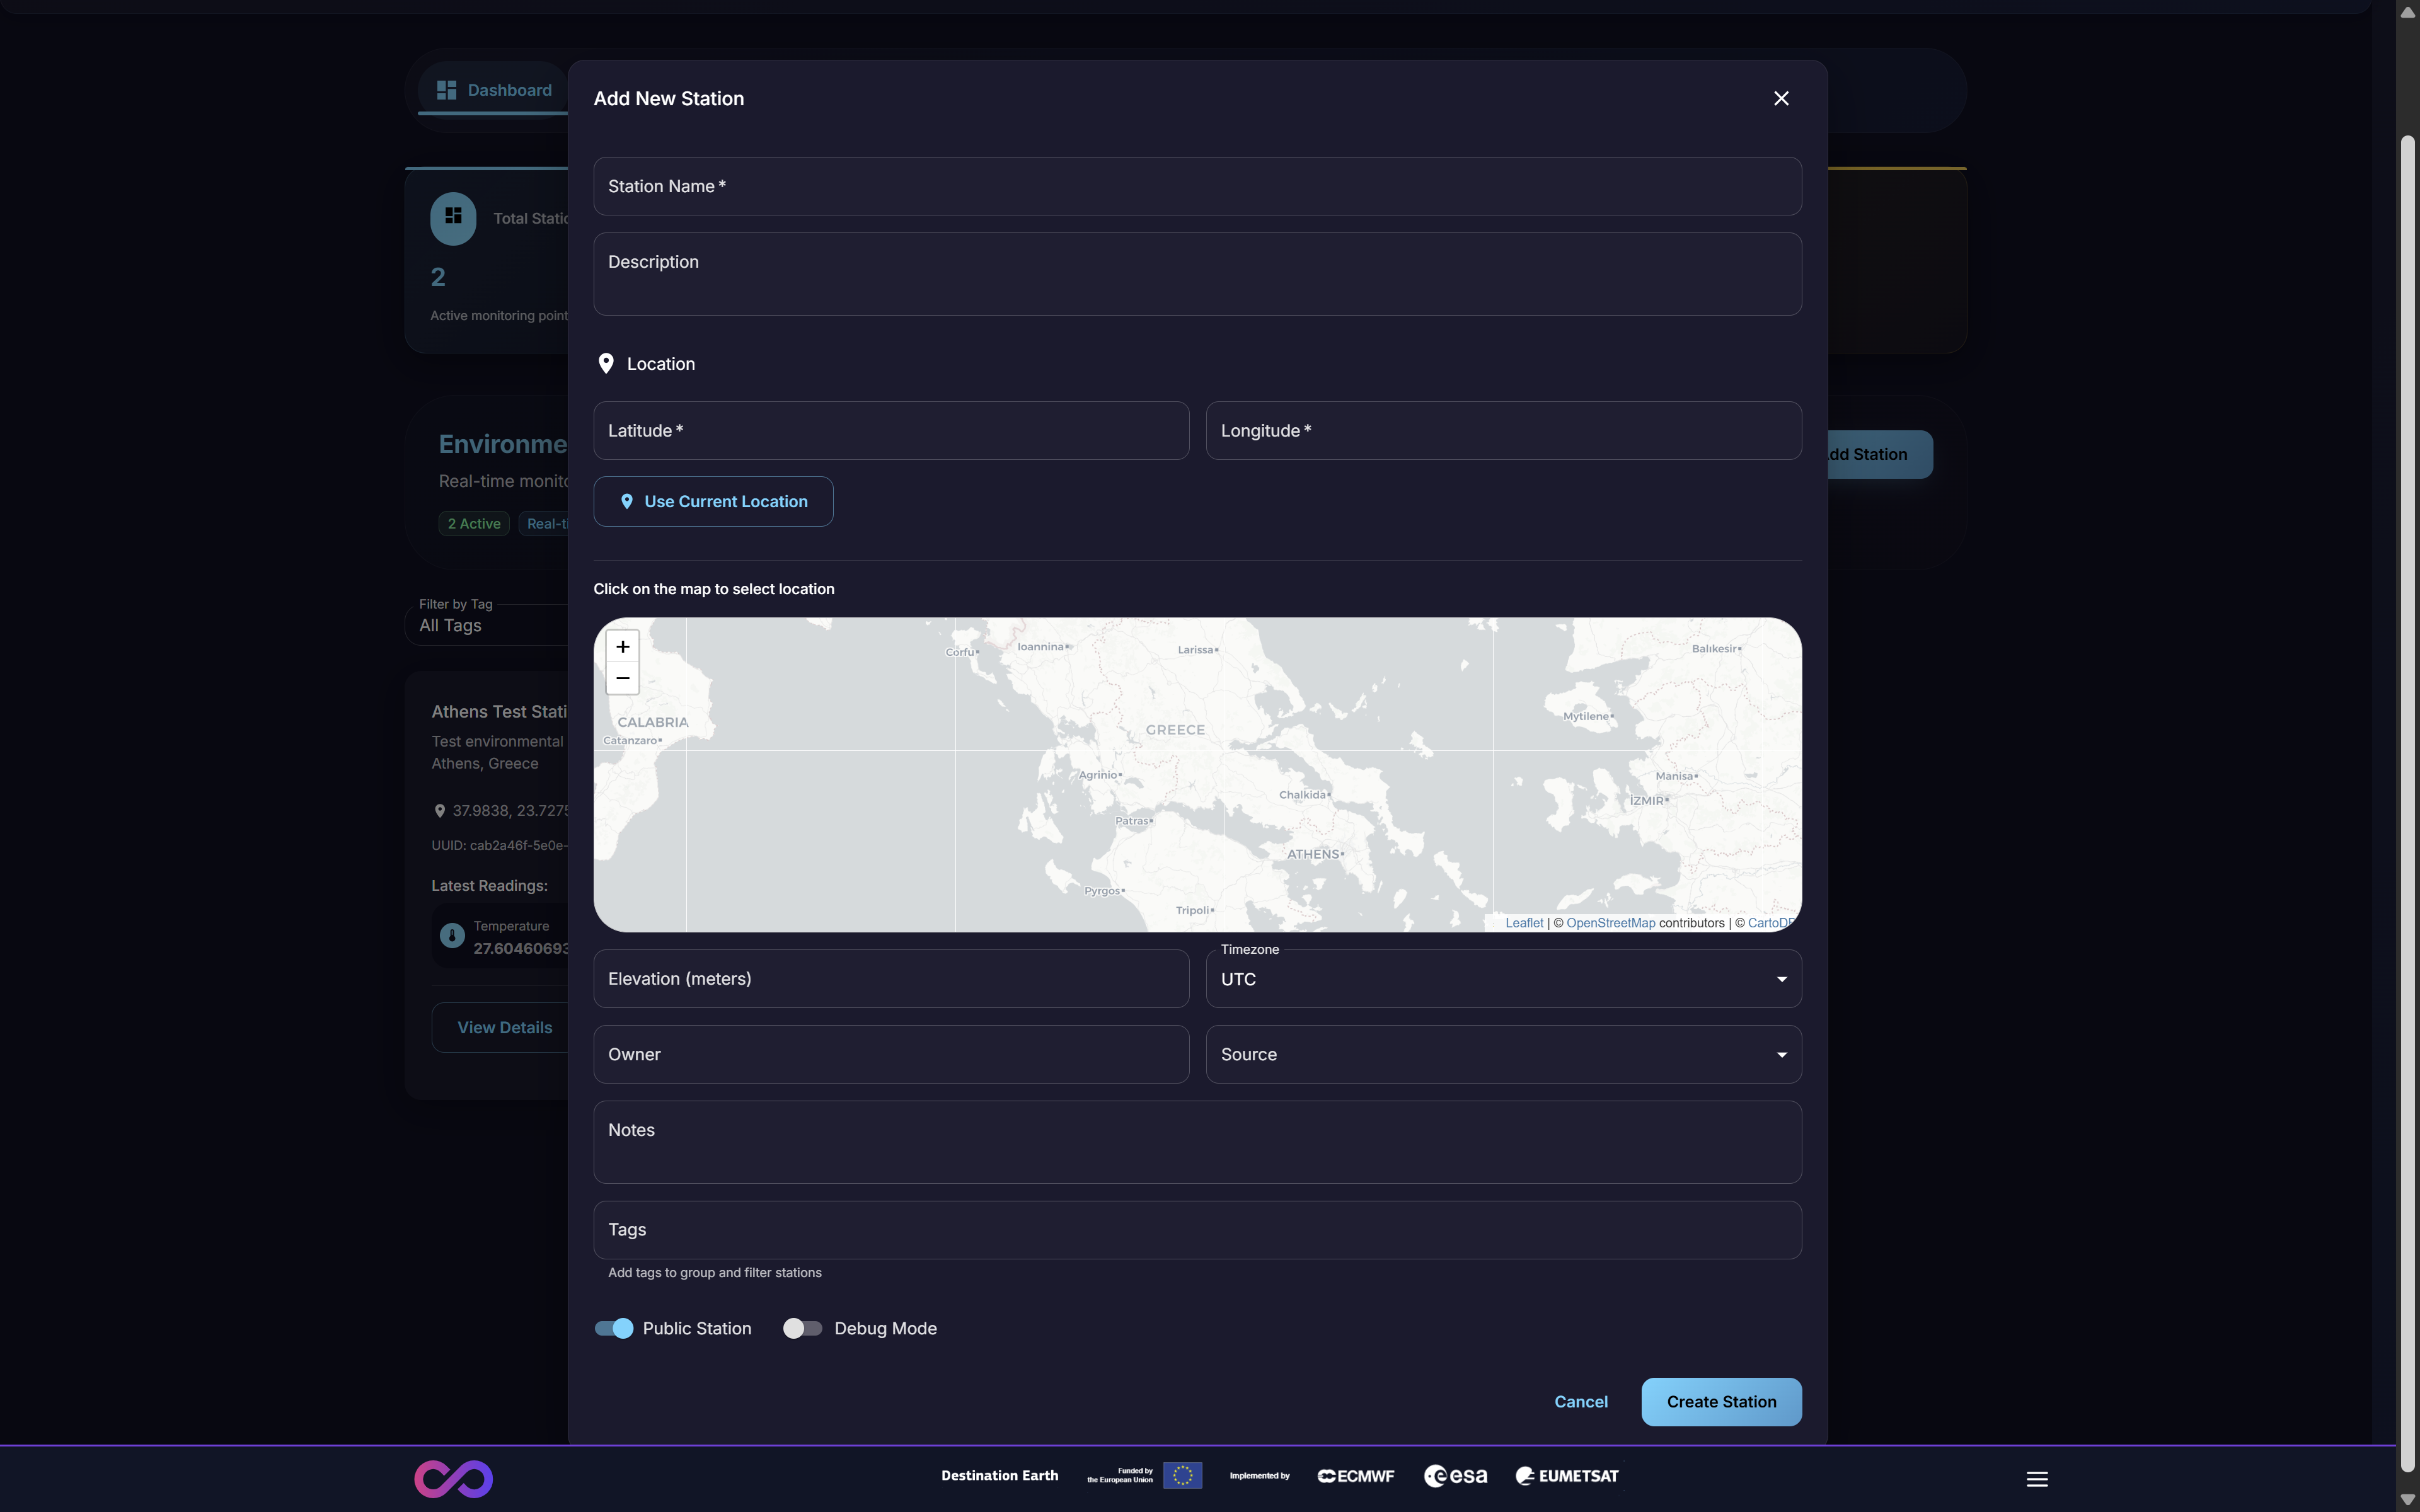
Figure 13: The ‘Add New Station’ modal
A critical step in station registration is selecting the Source (Figure 14). This dropdown menu defines the data ingestion protocol the station will use to communicate with SenCore.
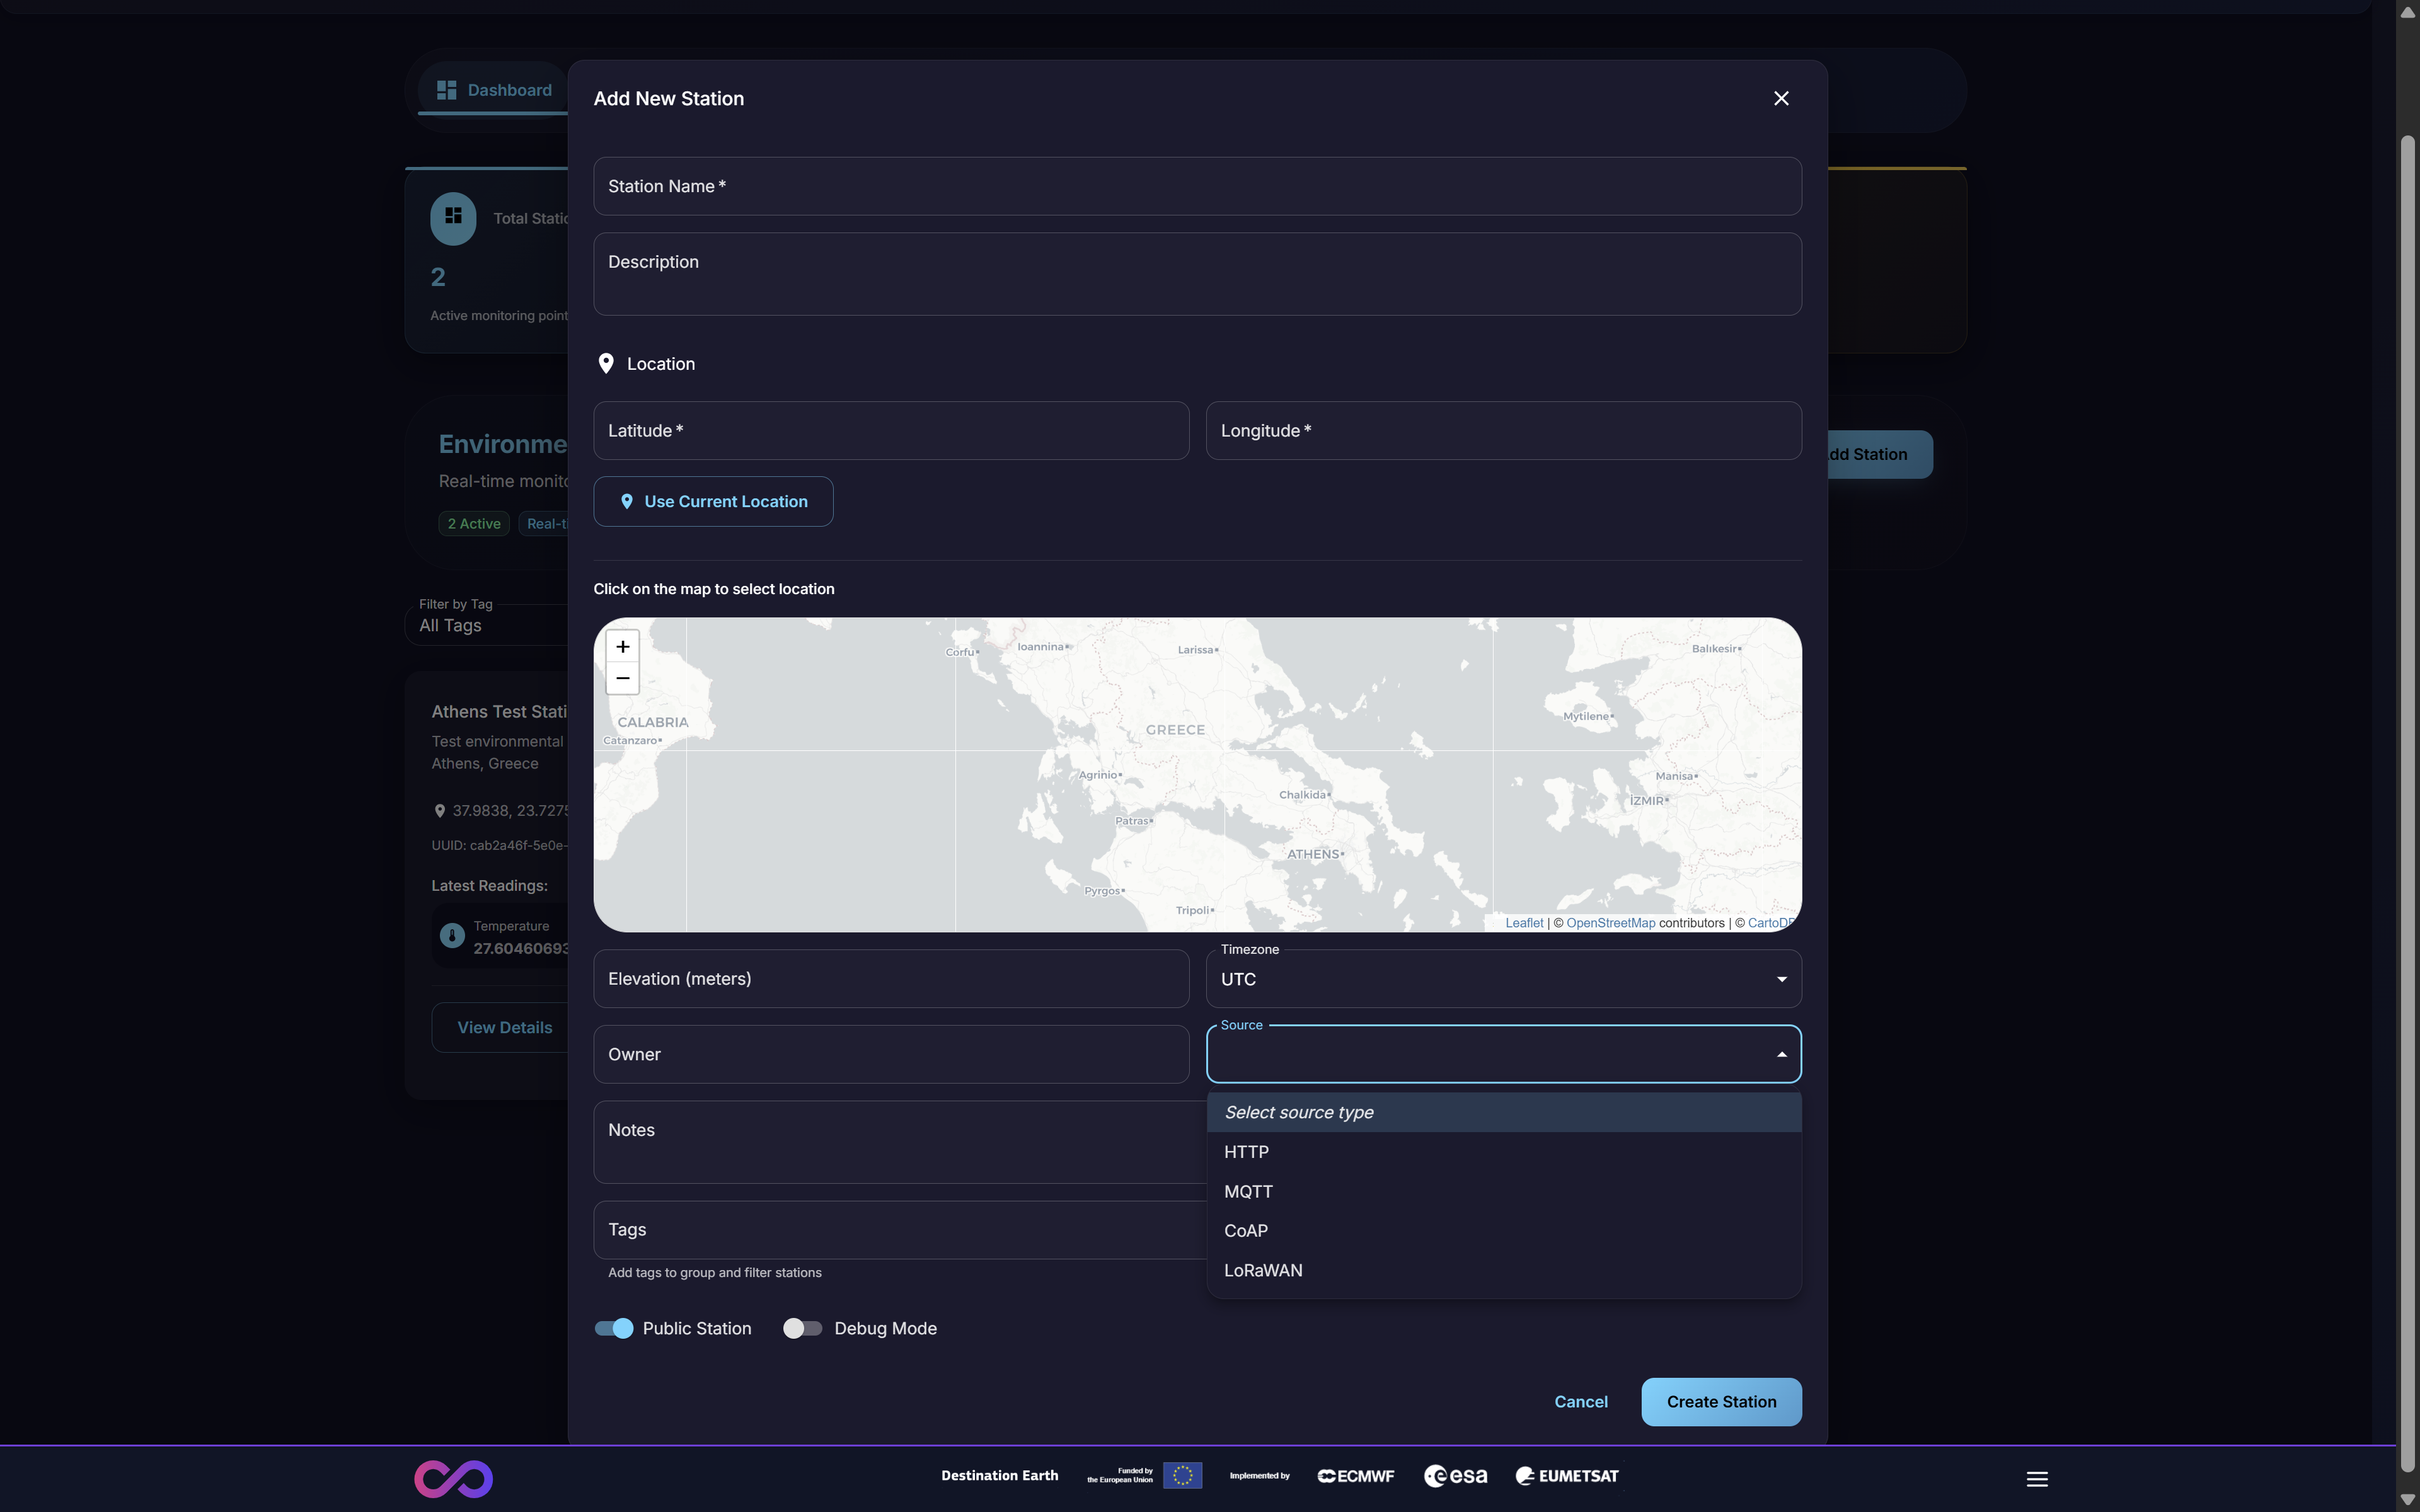
Figure 14: Selecting the ‘Source’ data ingestion protocol
The available protocols are designed for different hardware and network capabilities:
HTTP: Standard web protocol for RESTful API integration
MQTT: Lightweight messaging protocol for IoT devices
FTP: File Transfer Protocol supporting both push-based and pull-based data transmission models via FTP servers
LoRaWAN: Long-range, low-power protocol for wide-area networks
OGC SensorThings: Open standard API for IoT sensor data interoperability (see Section 3.2.5.1)
After all fields are completed, clicking Create Station will finalize registration and provision the station in the system.
3.1.1. Custom Field Mapping & Unit Conversion
After a station is created, users can configure how measurements are displayed and stored via the custom field mapping and unit conversion interface. This is accessible from the station details and allows users to choose the preferred display units for each metric category.
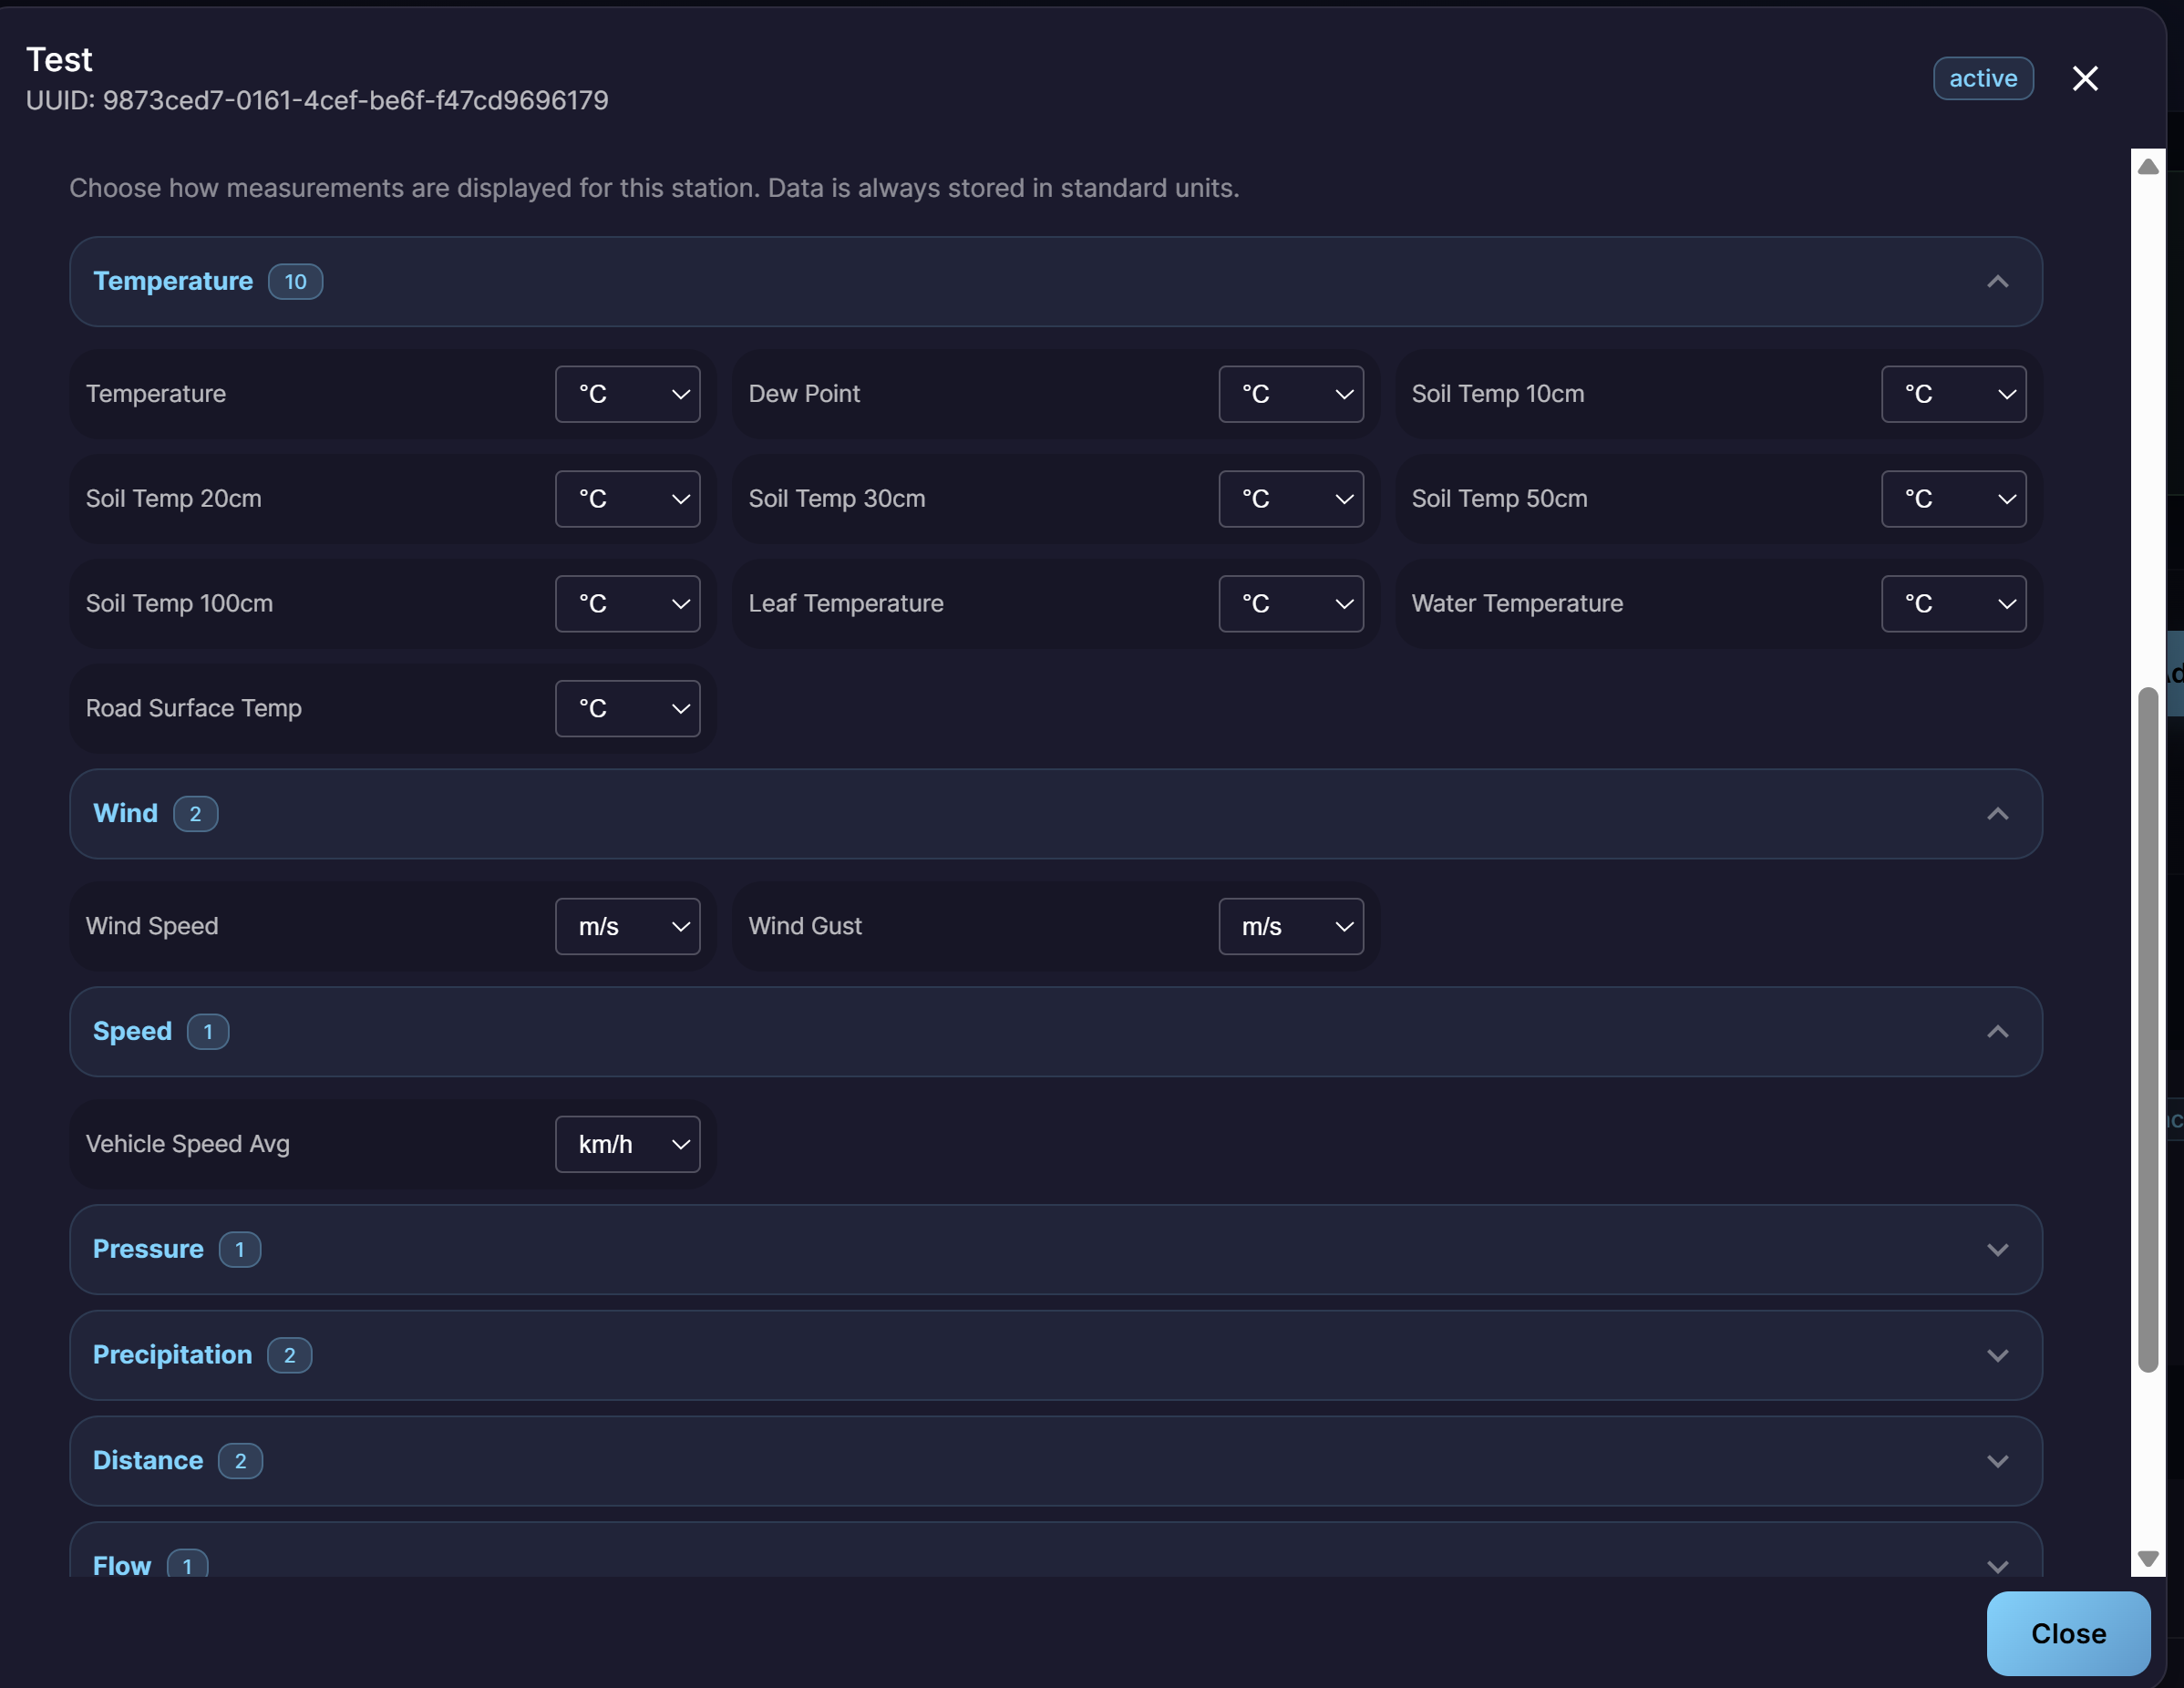
Figure 15: Custom field mapping and unit conversion configuration
The interface is organized by metric categories (e.g., Temperature, Wind, Speed, Pressure, Precipitation, Distance, Flow), each expandable to reveal the individual metrics and their unit conversion dropdowns. Data is always stored in standard units internally, but users can select their preferred display units per metric:
Temperature (10 metrics): Choose between °C, °F, or K for metrics such as Temperature, Dew Point, Soil Temperature at various depths, Leaf Temperature, Water Temperature, and Road Surface Temperature.
Wind (2 metrics): Choose between m/s, km/h, or mph for Wind Speed and Wind Gust.
Speed (1 metric): Choose the display unit for Vehicle Speed Average (e.g., km/h).
Pressure (1 metric): Choose between Pa, hPa, mbar, or bar.
Precipitation (2 metrics): Choose between mm, cm, or inches.
Distance (2 metrics): Choose between m, km, or miles.
Flow (1 metric): Choose the display unit for flow measurements.
This ensures that data from heterogeneous sensor hardware is normalized and displayed in a consistent, user-preferred format across the platform.
3.1.2. Data Transformation & Validation Rules
SenCore v3.0.0 introduces an advanced data transformation and validation engine that enables complex data processing workflows upon ingestion. Administrators can define and enforce sophisticated rules to ensure data quality, integrity, and consistency.
The engine supports:
- Multi-Step Transformations
Define sequential processing steps that incoming data passes through, including scripted and conditional transformations.
- Validation Rules
Configure rules that check for:
Outlier Detection: Flag or reject values that fall outside expected ranges for a given metric.
Missing Values: Identify and handle records with missing or null data fields.
Logical Constraints: Enforce cross-field consistency checks (e.g., dew point cannot exceed temperature).
- Processing Actions
For each validation rule, specify whether non-conforming records should be:
Rejected: Discarded entirely and not stored in the platform.
Flagged: Stored but marked with a quality flag for review.
Only validated data that passes all configured rules is stored in the platform, ensuring the integrity of the analytical dataset.
3.2. Viewing Station Details
From the Main Dashboard (Figure 2), clicking the View Details button on any station card opens a multi-tabbed modal (Figure 16). This interface provides comprehensive information and analytical tools for that specific station.
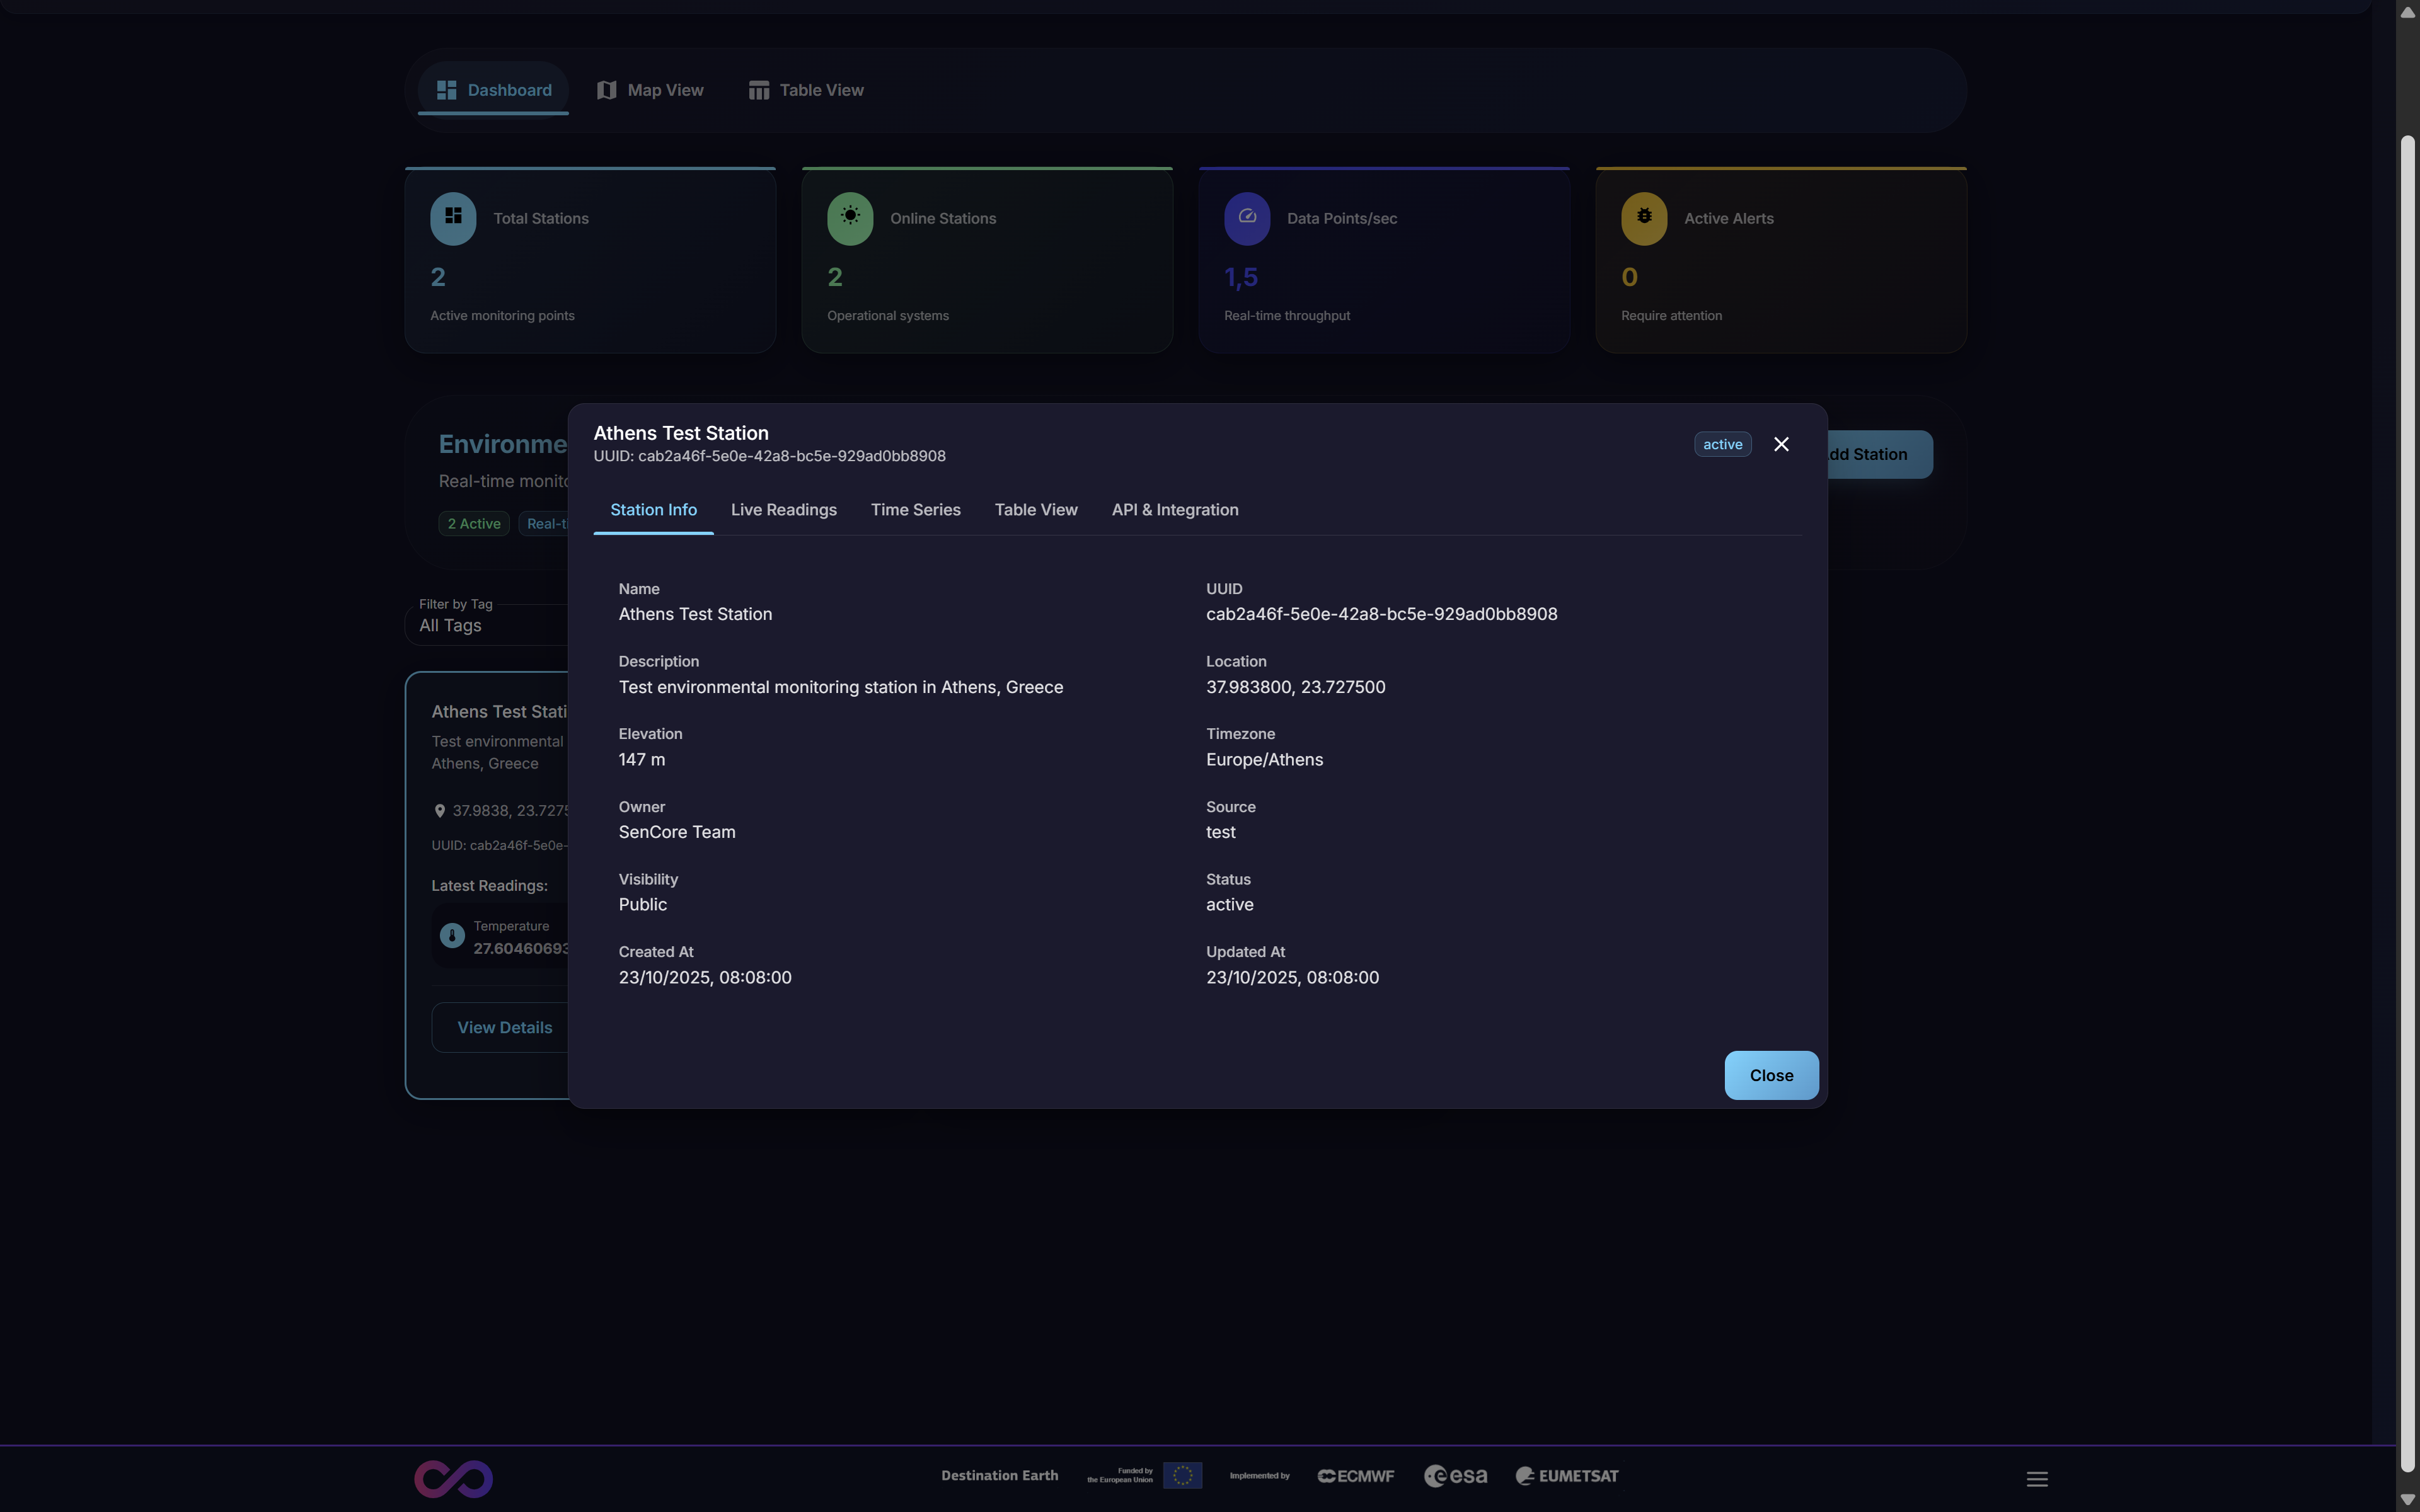
Figure 16: The ‘Station Details’ modal, showing the ‘Station Info’ tab
This modal is organized into seven distinct tabs: Station Info, Live Readings, Time Series, Table View, API & Integration, Rules & Alerts, and AI Analysis.
3.2.1. Station Info Tab
This tab is active by default (Figure 16) and displays the station’s static, identifying information and metadata. This includes:
Identifiers: Name, UUID, Description
Geospatial: Location (coordinates), Elevation, Timezone
Ownership: Owner, Source (e.g., “test”)
Status: Current Status (e.g., “active”), Visibility (e.g., “Public”)
Timestamps: Created At, Updated At
3.2.2. Live Readings Tab
This tab provides a real-time data feed of the most current sensor readings being transmitted by the station. This view is primarily used for immediate diagnostics, such as confirming that a newly registered station is online and transmitting data as expected.
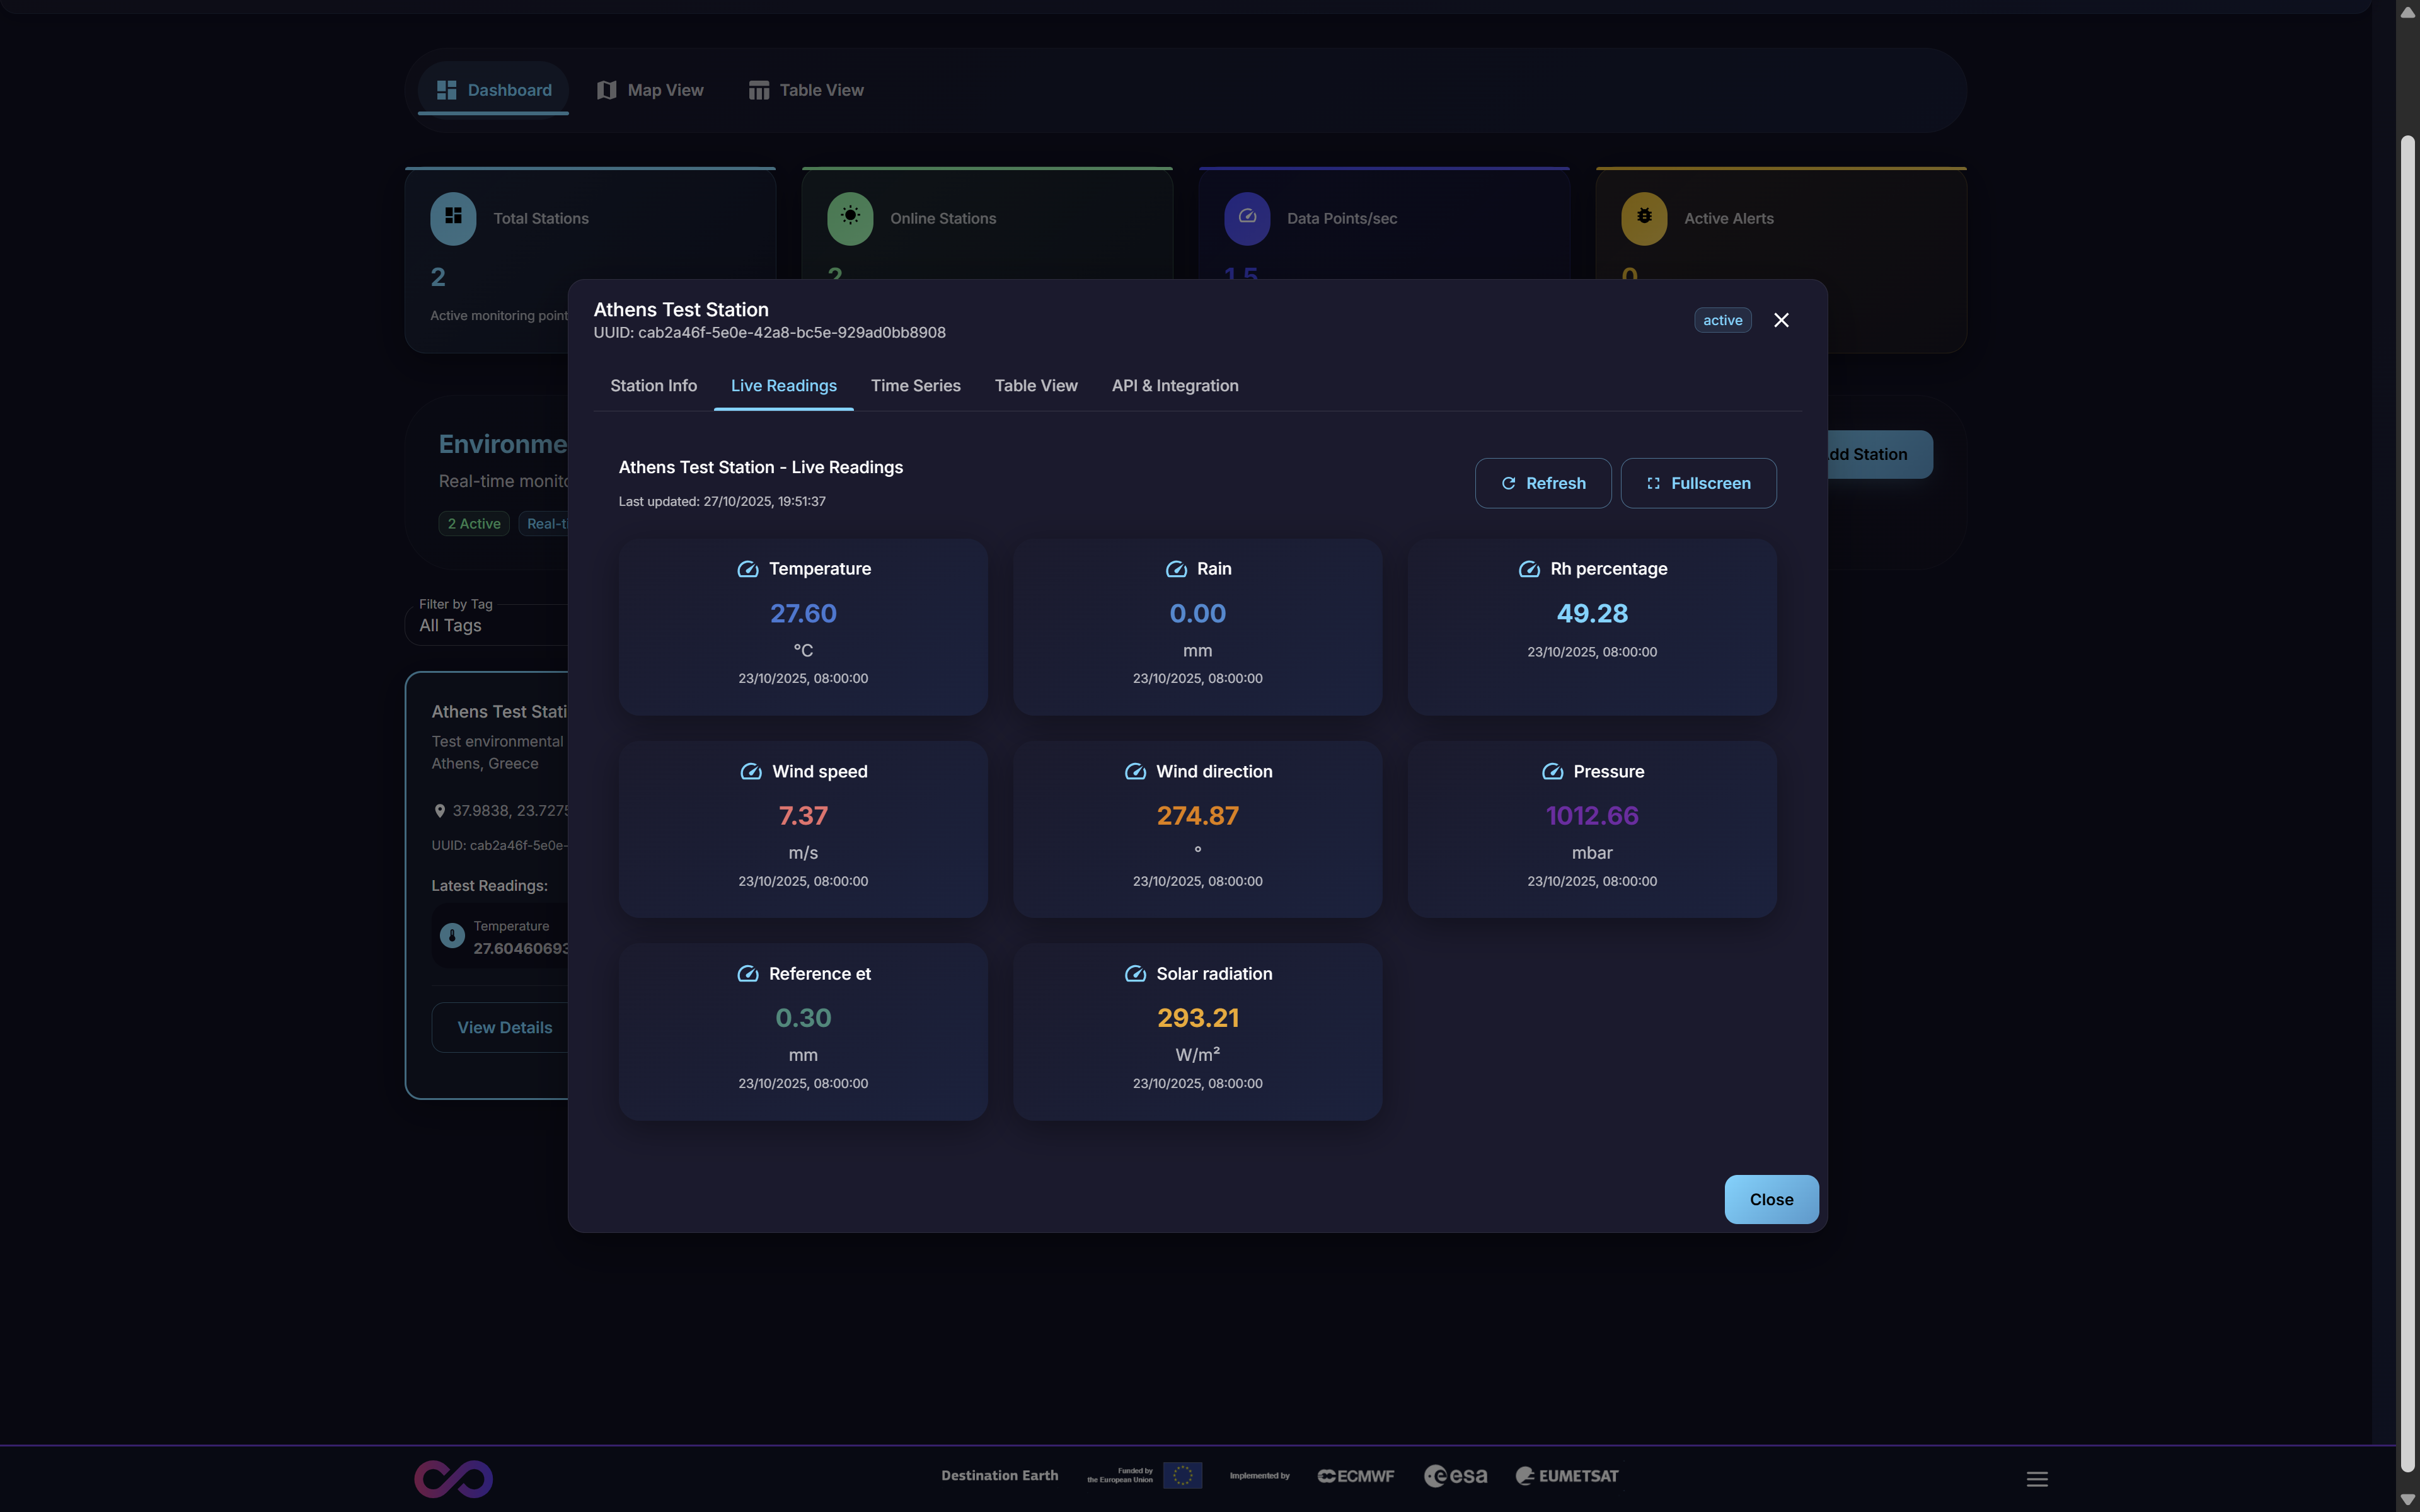
Figure 17: Live Readings Tab showing real-time sensor data
3.2.3. Time Series Tab
This tab opens an interface for plotting and analyzing the station’s historical data trends. Users can select one or more metrics (e.g., Temperature, Humidity) and a specific time range to generate interactive graphs. This is the primary tool for visual analysis of a single station’s past performance and for identifying trends or anomalies over time.
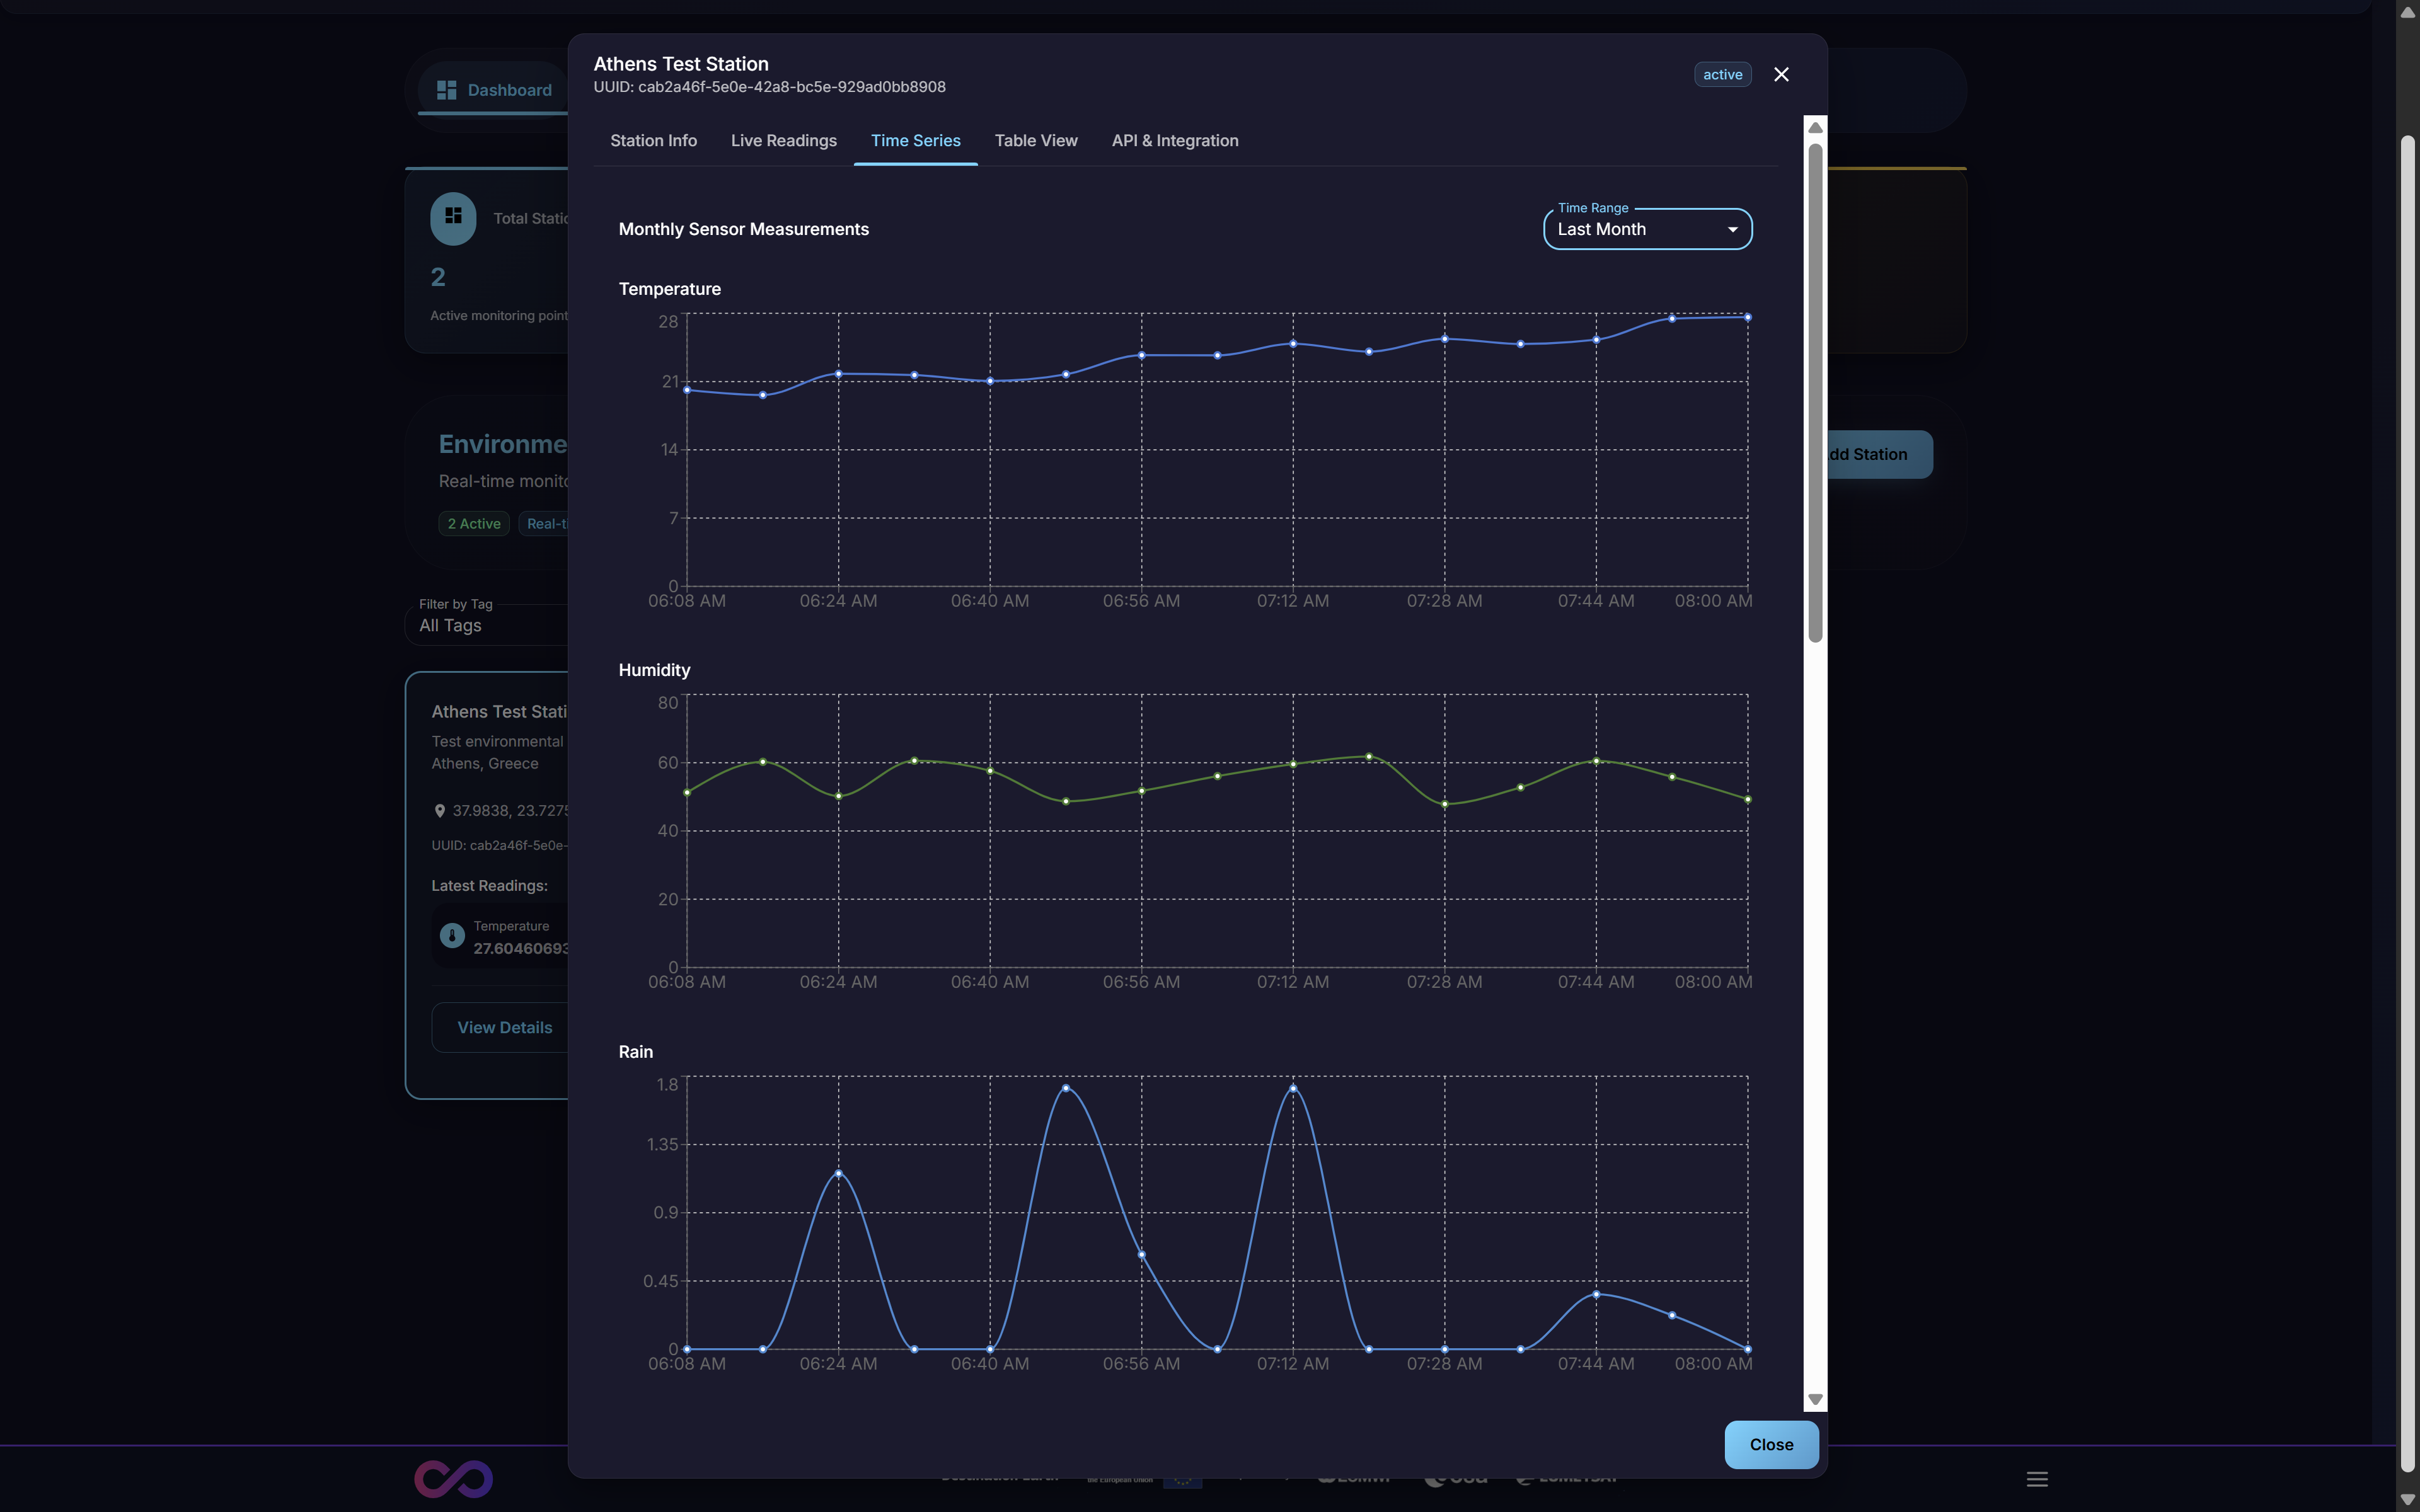
Figure 18: Time Series Tab with historical data visualization
3.2.4. Table View Tab
This tab provides the same tabular data interface as the platform-wide Table View (Section 2.3) but is pre-filtered to show historical data only for the currently selected station. This allows a user to easily view, filter, and search the entire data history for one specific station without the noise of the global dataset, streamlining single-device analysis.
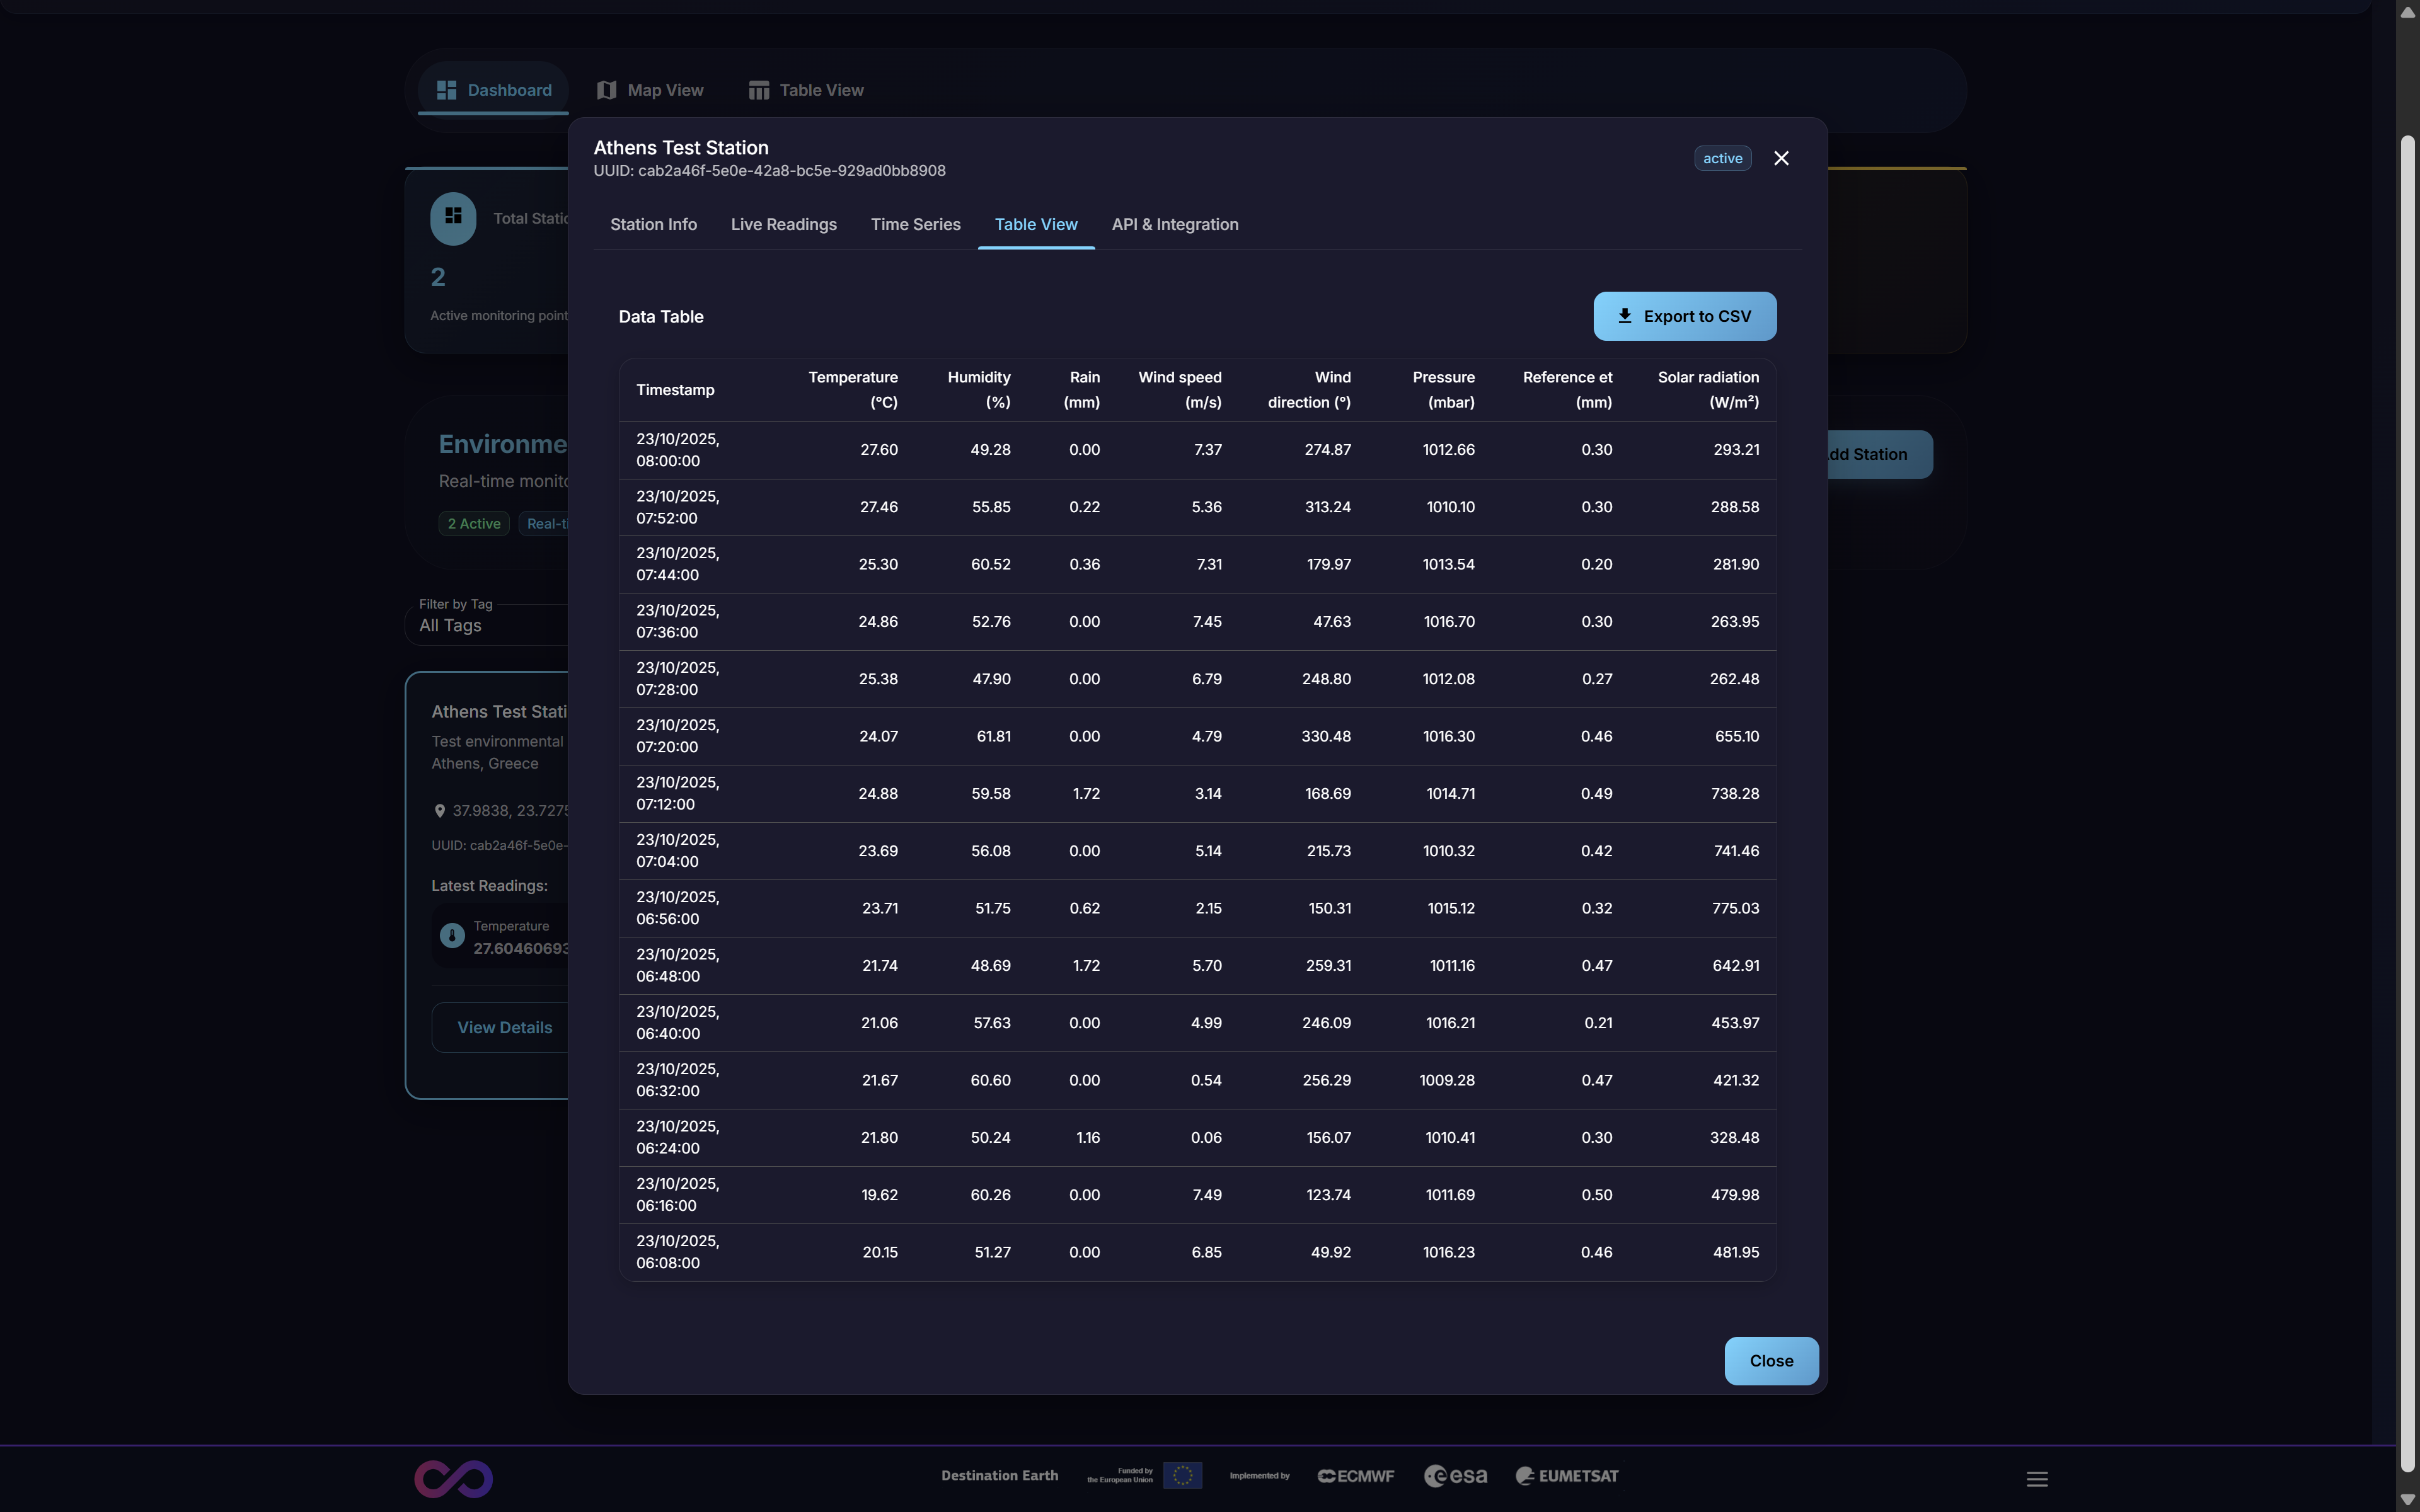
Figure 19: Table View Tab showing station-specific data
3.2.5. API and Integration Tab
This developer-focused tab provides all necessary information for programmatic interaction with the specific station. It is the practical “how-to” guide for implementing the “Multi-Protocol Support” and “RESTful API” features, connecting the abstract “Source” setting (Figure 14) to a concrete integration pathway.
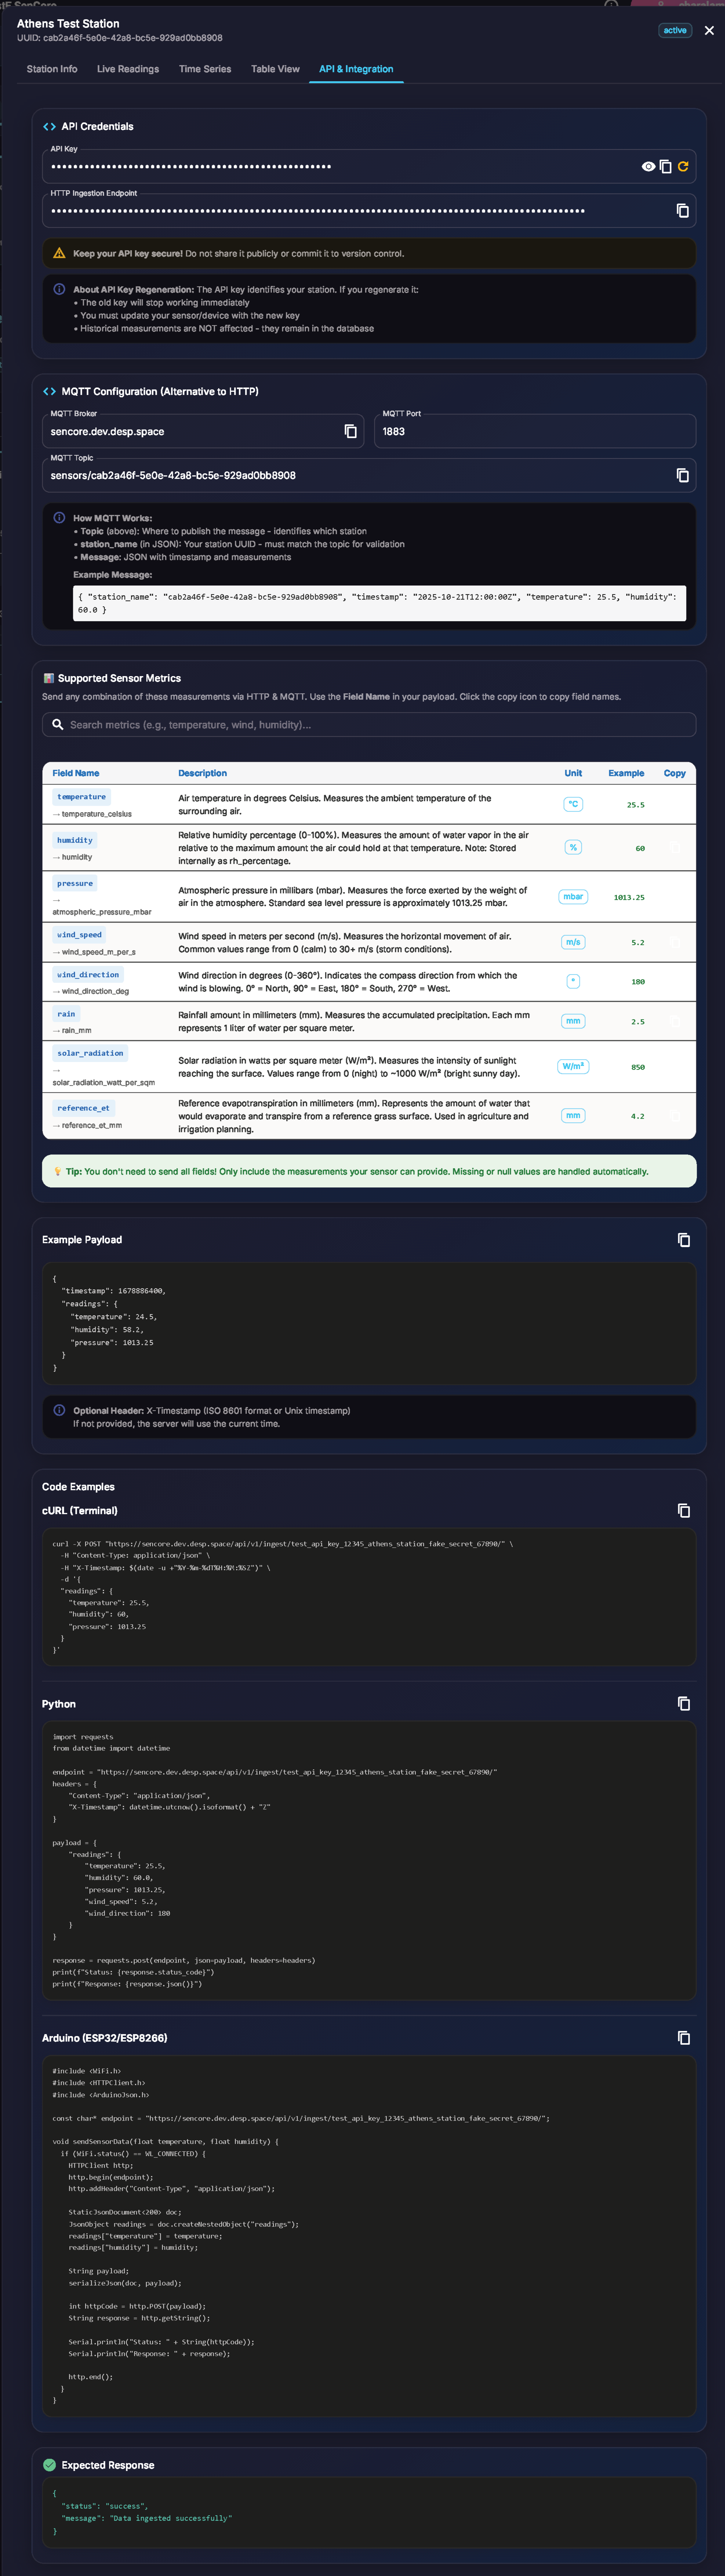
Figure 20: API & Integration Tab with credentials and code examples
This tab provides:
API Credentials: Station-specific authentication tokens or API keys required for secure data submission and retrieval.
Ingestion Endpoints: The specific URL (for HTTP), Topic (for MQTT), FTP server details (for FTP), or other endpoint information required to send data to this specific station.
Code Snippets: Example code (e.g., cURL, Python) demonstrating how to format and submit data to the endpoint.
Supported Sensor Metrics: A table showing all available measurements with descriptions and units.
API Documentation Link: A direct link to the platform’s full RESTful API documentation (see Appendix).
3.2.5.1. OGC SensorThings API Integration
In addition to the standard HTTP and MQTT protocols, SenCore supports the OGC SensorThings API v1.1, an open standard for IoT sensor data interoperability. This protocol enables seamless integration with other OGC-compliant systems and applications.
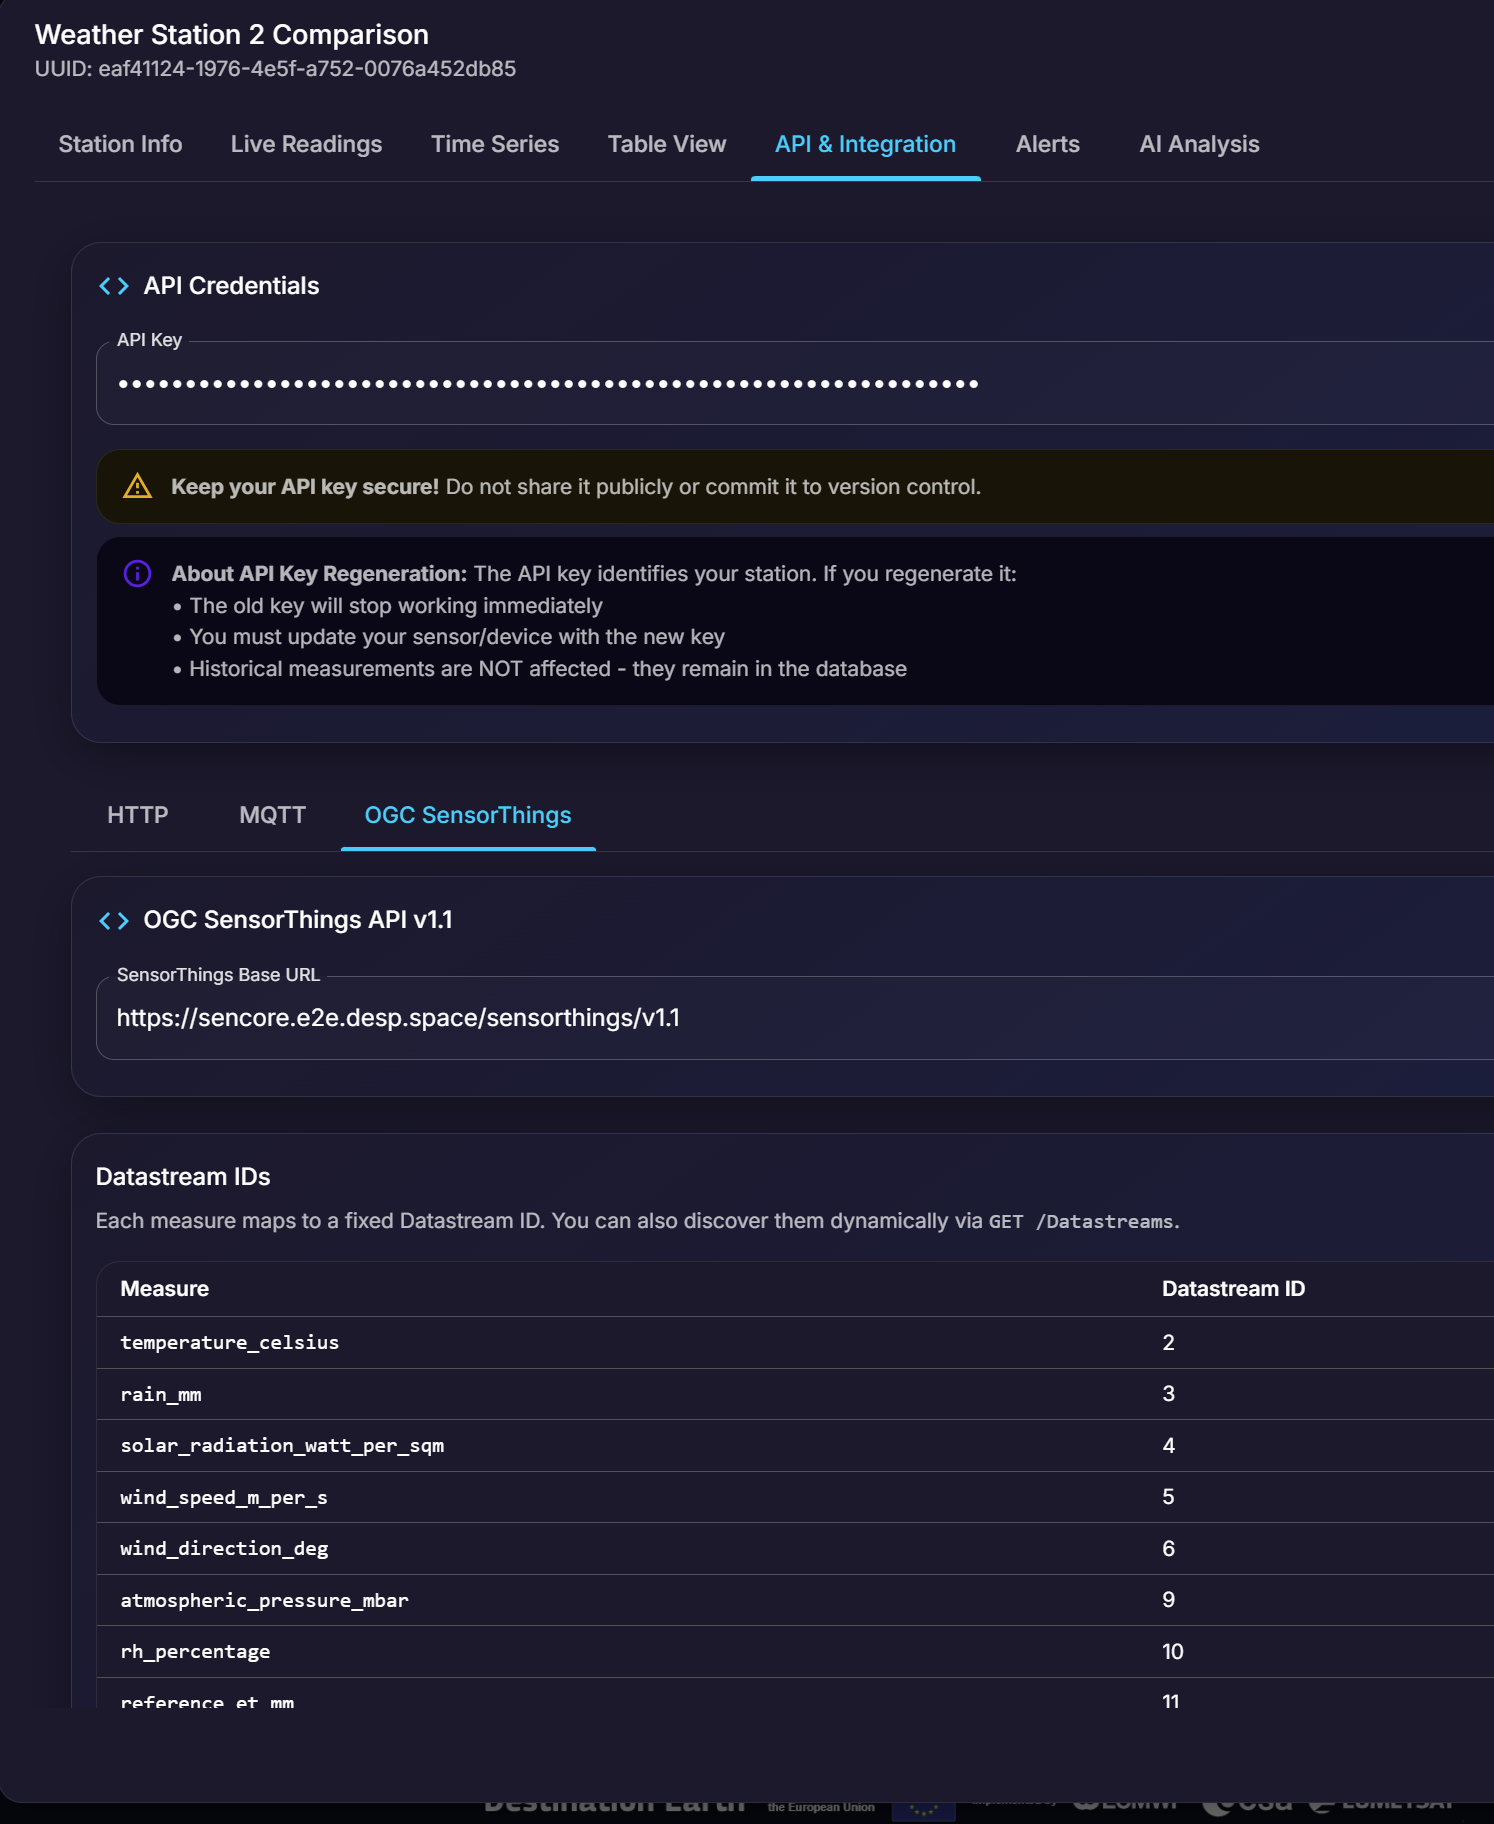
Figure 21: OGC SensorThings API integration tab showing endpoint and datastream mappings
The OGC SensorThings tab within the API & Integration section provides:
- SensorThings Base URL
The base endpoint URL for accessing station data via the SensorThings API (e.g.,
https://sencore.e2e.desp.space/sensorthings/v1.1).- Datastream IDs
A mapping table that shows how each sensor measurement corresponds to a specific Datastream ID in the SensorThings model. Each measure (e.g.,
temperature_celsius,rain_mm,wind_speed_m_per_s) is assigned a unique Datastream ID for programmatic access.Available datastreams include:
temperature_celsius- Temperature readingsrain_mm- Precipitation measurementssolar_radiation_watt_per_sqm- Solar radiation datawind_speed_m_per_s- Wind speed measurementswind_direction_deg- Wind direction in degreesatmospheric_pressure_mbar- Atmospheric pressure readingsrh_percentage- Relative humidity percentagereference_et_mm- Reference evapotranspiration
Users can discover all available datastreams dynamically via the GET /Datastreams endpoint.
3.2.5.2. Semantic Data Interoperability & Vocabularies API
SenCore provides a standardized vocabulary system for semantic data interoperability. The platform maps proprietary sensor outputs to canonical vocabularies and ontologies, enabling unified querying and integration across disparate data sources.
The Vocabularies API endpoint (GET /api/v1/vocabularies/) returns the full standardized metric vocabulary comprising 54 metrics across 6 domains, with internal field names, display names, units, and categories.
This enables:
Standardized Naming: Proprietary sensor field names are mapped to canonical representations (e.g.,
temp_c→temperature_celsius).Cross-Source Querying: Data from different sensor manufacturers can be queried using the same standardized metric names.
Interoperability: Integration with external systems using standardized schemas for data exchange.
3.2.6. Rules & Alerts Tab
The Rules & Alerts tab provides a comprehensive rules engine that combines data validation with an alerting system. Users can define rules based on logical conditions that determine how incoming data is handled and when notifications are triggered.
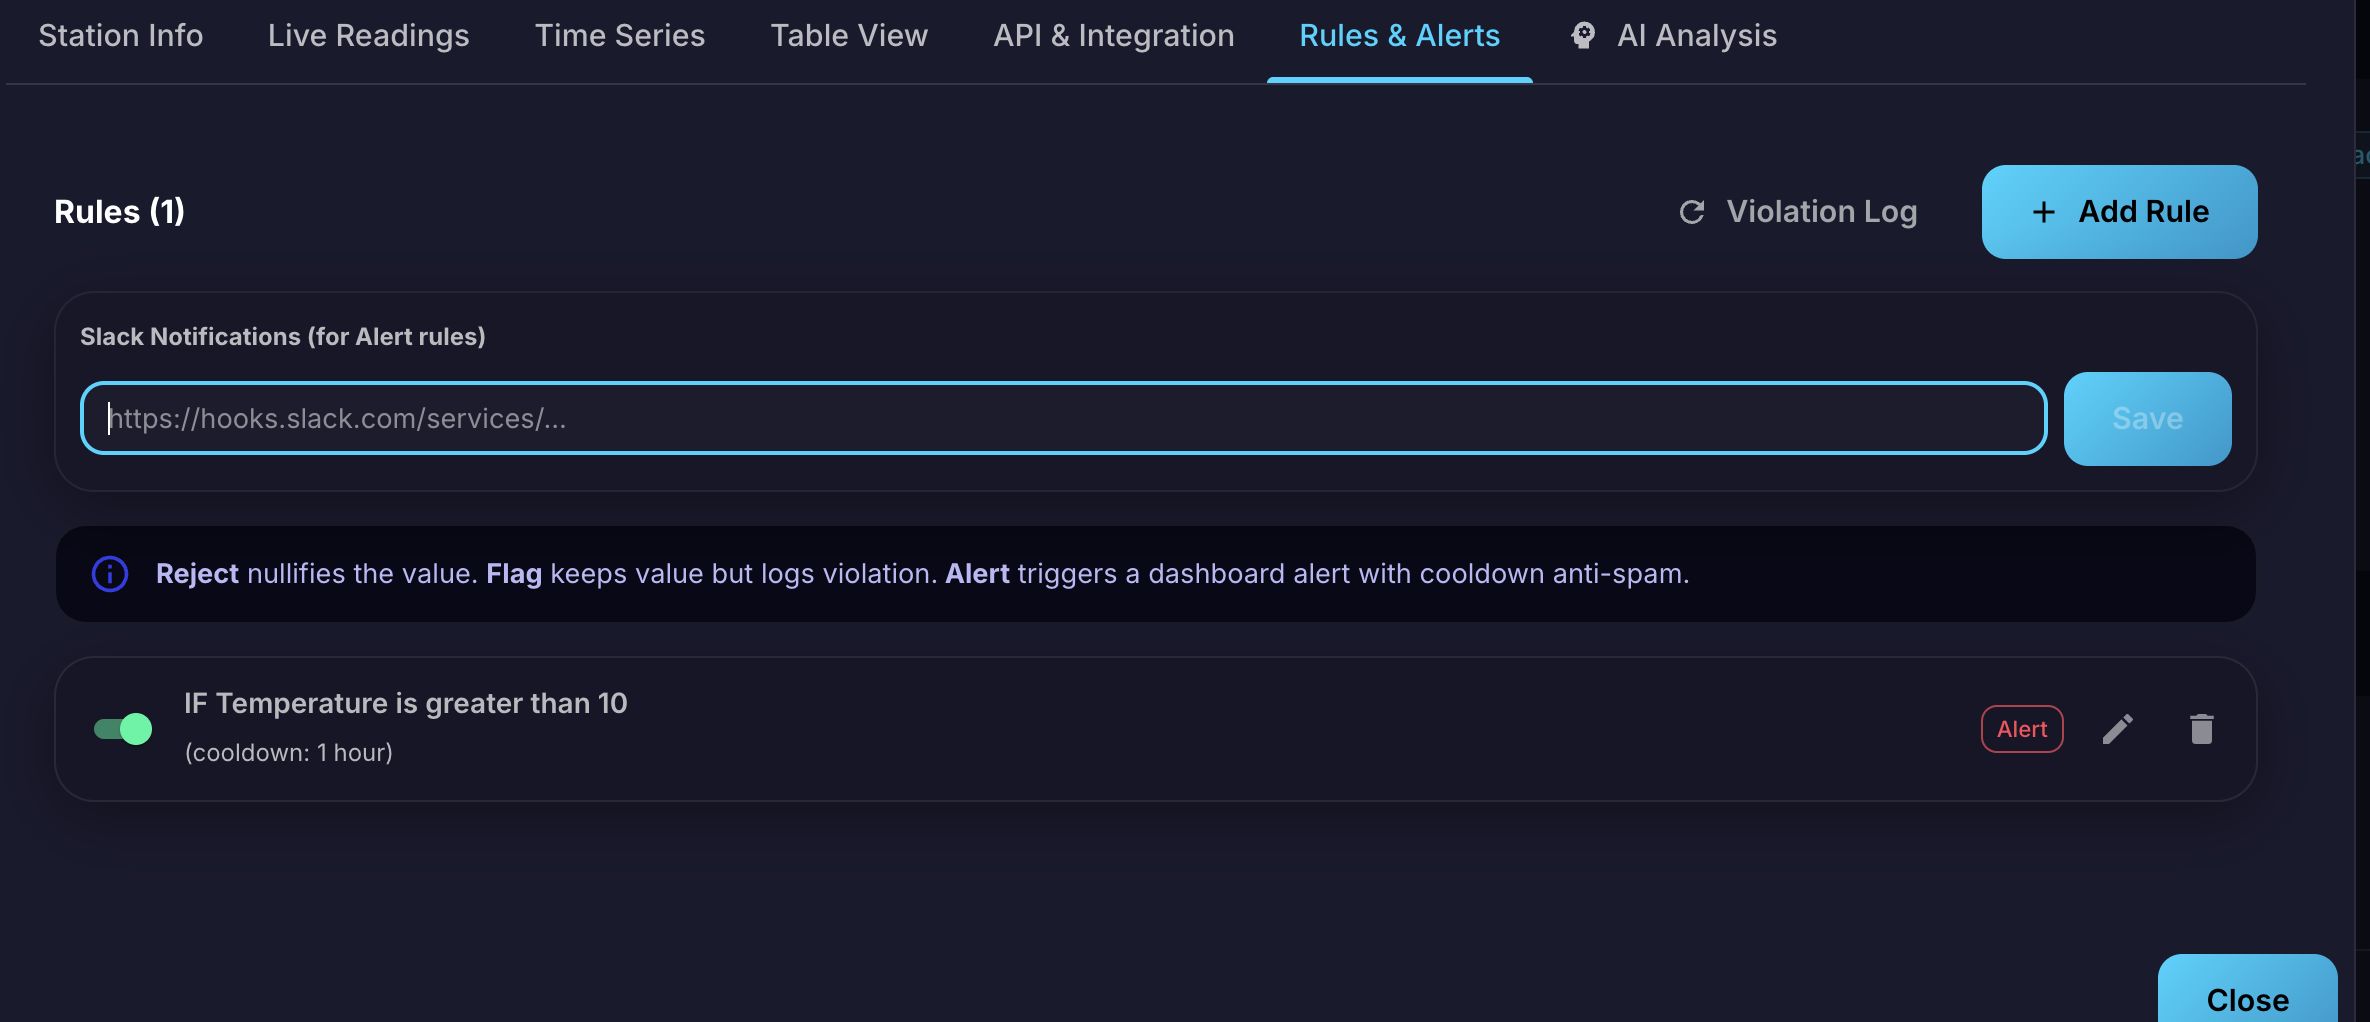
Figure 22: Rules & Alerts Tab showing Slack configuration, rule actions, and configured rules
Creating Rules
To create a new rule, click the + Add Rule button. The rule configuration includes:
Metric: The measurement type to monitor (e.g., Temperature, Humidity, Pressure).
Condition: The logical operator for comparison (e.g., “Greater than (>)”, “Less than (<)”, “Equal to (=)”).
Threshold: The value that triggers the rule.
Cooldown: A time interval (e.g., 1 hour) to prevent repeated triggering of the same rule in rapid succession.
Rule Actions
Each rule can be assigned one of three actions, determining how the system handles data that matches the condition:
Reject: Nullifies the value — the incoming data point is discarded and not stored.
Flag: Keeps the value but logs a violation for review.
Alert: Triggers a dashboard alert with cooldown anti-spam protection.
Managing Rules
Once created, rules appear in the Rules list. Each rule displays:
The rule condition summary (e.g., “IF Temperature is greater than 10”)
The cooldown interval
The assigned action tag (Reject, Flag, or Alert)
A toggle switch to enable or disable the rule
Edit and delete action buttons
Violation Log
The Violation Log button provides access to a history of all rule violations, allowing users to review flagged data points, rejected submissions, and triggered alerts.
Slack Notification Integration
At the top of the Rules & Alerts tab, a Slack Notifications section allows users to configure a Slack Webhook URL for the station. When an Alert-type rule is triggered, the system sends a real-time notification to the configured Slack channel.
To set up Slack notifications:
Create a Slack channel dedicated to receiving SenCore alerts.
Configure an Incoming Webhook for the channel (see Slack documentation).
Paste the webhook URL into the Slack Notifications field and click Save.
When a critical measurement breaches an Alert-type rule, the system sends a notification to the specified Slack channel containing the rule details, the triggering value, and the station name.
3.2.7. AI Analysis Tab
The AI Analysis tab provides access to an AI-powered anomaly detection engine that automatically analyzes station measurements and generates human-readable contextual reports. The AI model is fully self-hosted on EU infrastructure — no data is transferred to any third-party AI provider.
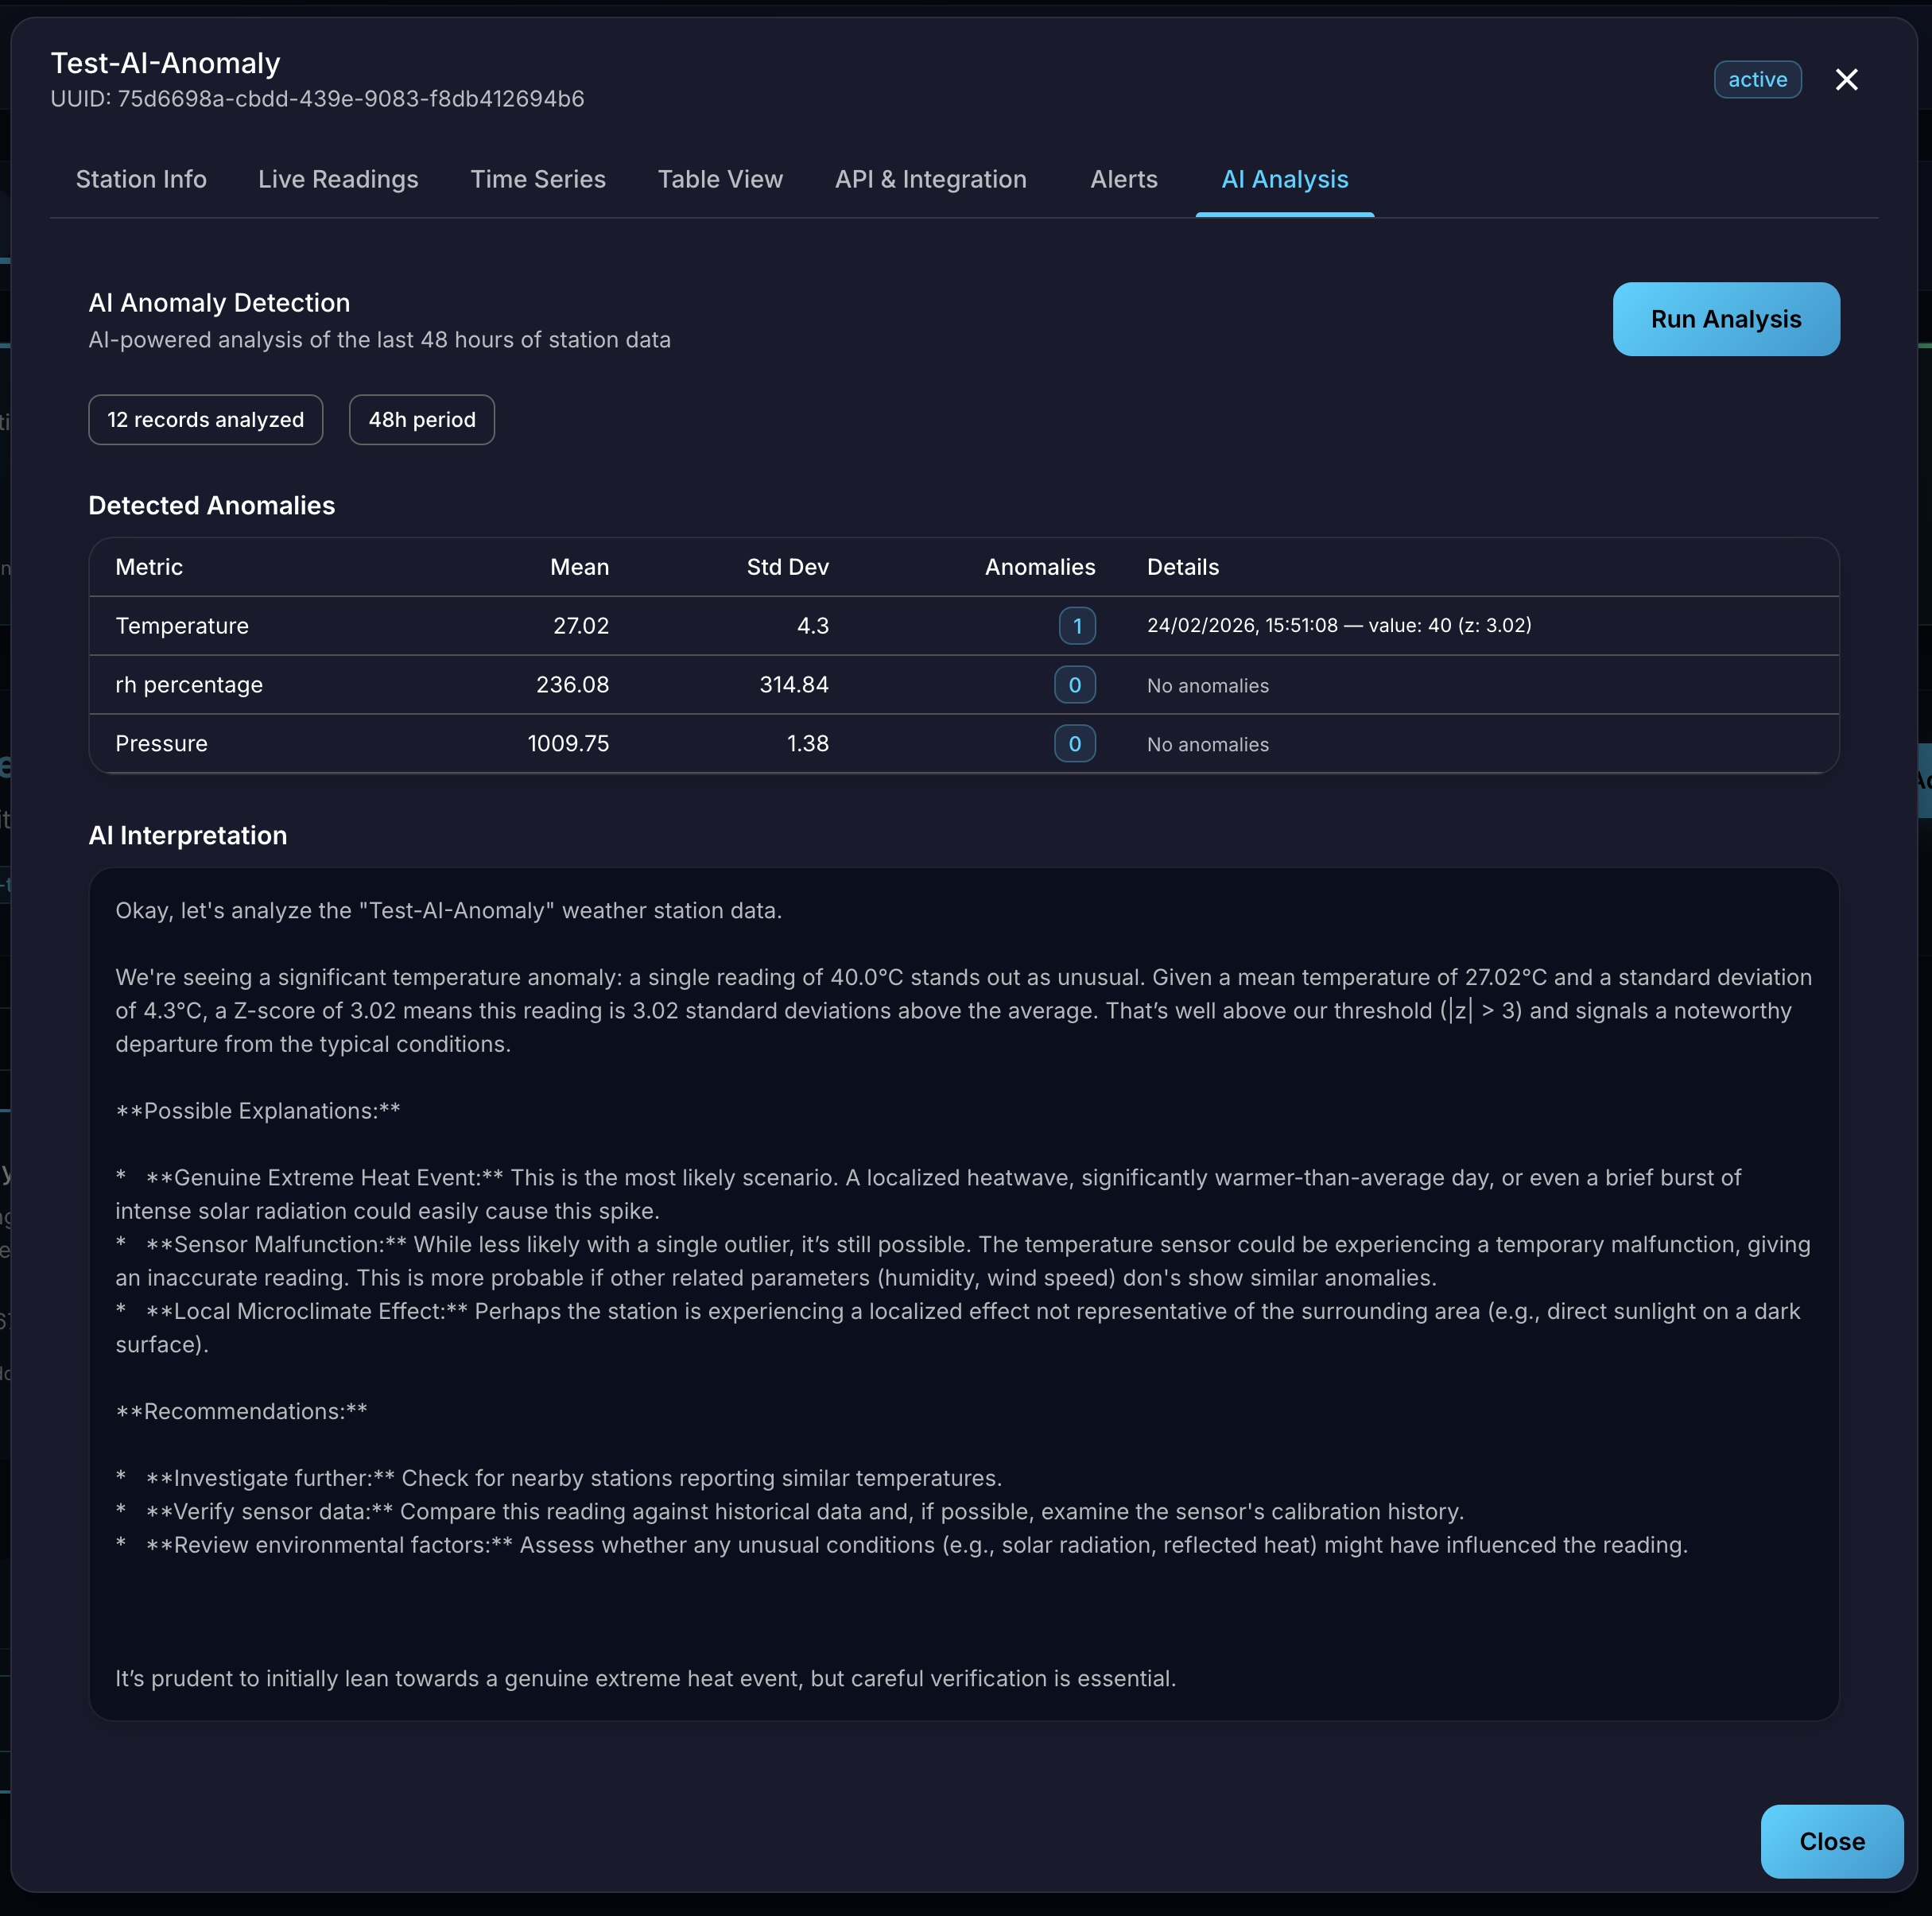
Figure 23: AI Analysis Tab showing anomaly detection report
Running an Analysis
To generate an AI analysis report, navigate to the AI Analysis tab within a station’s details modal and click the Run Analysis button. The system analyzes the station’s measurements from the last 48 hours and produces a comprehensive report. A summary bar indicates the number of records analyzed and the analysis period.
Detected Anomalies Table
The report presents a statistical summary table for each monitored metric:
Metric: The measurement type (e.g., Temperature, rh percentage, Pressure).
Mean: The average value over the analysis period.
Std Dev: The standard deviation, indicating data variability.
Anomalies: The number of detected anomalies for the metric. A count of
0indicates no anomalies were found.Details: For detected anomalies, the exact timestamp, triggering value, and Z-score are displayed (e.g., “value: 40 (z: 3.02)”).
AI Interpretation
Below the statistical table, the AI engine provides a natural language interpretation of the findings:
Analysis Summary: A human-readable explanation of the detected anomaly, including why the value is considered unusual, its Z-score significance, and deviation from the mean.
Possible Explanations: The AI generates multiple hypotheses for the anomaly, such as genuine extreme weather events, sensor malfunctions, or localized microclimate effects.
Recommendations: Actionable suggestions including investigating further, verifying sensor data against historical records, checking nearby stations, and reviewing environmental factors.
This contextual interpretation transforms raw statistical alerts into a practical decision-support tool, helping users understand not just what was detected but why it matters and what to do next.