The Destination Earth Climate Change Adaptation Digital Twin provides high-resolution, globally consistent climate information to support climate adaptation.
A new set of simulations is now available, building on upgraded climate models, and impact-sector applications.
This page guides you step by step through all relevant information, including how to access and use the Digital Twin simulations.
Simulations run at 5–10 km resolution in the atmosphere and ocean capturing local extremes, urban heat islands, and fine-scale ocean dynamics to simulate climate change at the local scale.
Continuous simulations from 1990–2049 covering the historical period for model evaluation and future projections for adaptation planning.
Storyline simulations replay weather events from the recent past (2017–2025), for example storms and heatwaves, across past, present-day, and +2°C climates to assess how extreme events can unfold in different climate conditions.
ICON, IFS-FESOM, and IFS-NEMO provide a multi-model ensemble, with output harmonized onto a common HEALPix grid for fast and convenient data access.
Climate model output is transformed directly into actionable climate impact information for sectors including renewable energy, hydrology, and wildfire risk.
Simulations are continuously evaluated using the AQUA framework, through comparison with observations, reanalysis and existing climate simulations.
Welcome to your
Climate DT journey

Understanding the Climate DT
The Destination Earth Climate Change Adaptation Digital Twin (Climate DT) sets up an operational simulation framework providing globally consistent high-resolution climate and impact-sector information, at spatial scales where many of the impacts of climate change and extreme events are observed.
The Climate DT combines global climate models, observations, and sector-specific applications, to deliver actionable insights from global and local scale, supporting applications in areas such as energy, hydrology, and wildfire risk.
Two types of simulations are being produced: global multi-decadal simulations describing the climate evolution under a specific future scenario for the period 1990-2049 and global storyline simulations that explore how extreme events, that occurred across the world during the period 2017-2025, would unfold in different climates.
Multi-decadal climate simulations
The Climate DT Generation 2 multi-decadal global simulations are produced with three state-of-the-art coupled Earth-system models developed by leading European institutions. Each uses different representations for the earth-system components, such as atmosphere, land, ocean and sea-ice. The simulations cover the period 1990–2049, at resolutions comprised between 5 and 10 km across earth-system components, following the SSP3-7.0 scenario. The output is harmonized onto a common HEALPix grid for consistent data access and is available with an hourly temporal resolution.
Multi-decadal climate simulations*information until 2049 will be available soon
More information on ICON
climate simulations

SIMULATIONS
Storyline Simulations
The global storyline simulations reproduce all recent weather events (2017–2025) across different climate conditions — a cooler past, the present conditions, and a warmer future. These global simulations use IFS-FESOM and spectral nudging techniques to maintain similar large-scale weather patterns while allowing fine-scale atmospheric dynamics, thermodynamic processes, the ocean, land surface and sea ice to respond to different climates. This allows to compare the same extreme event under different climate states, offering deeper insights into how global warming is modifying local weather extremes.
Comparison with observations, reanalysis
& existing climate simulations
The Climate DT simulations are continuously evaluated using the AQUA framework. They are compared with observational products and reanalysis datasets for the historical period (1990–2014), as well as with existing climate simulations like CMIP and CORDEX throughout the simulated period.
The second generation Climate DT simulations provide globally consistent climate information with local granularity, at scales where climate change and extreme events are observed. They show a good agreement in terms of global mean climate evolution with observational datasets and CMIP6 simulations. They also more accurately capture characteristics of extremes events at local scale, globally.
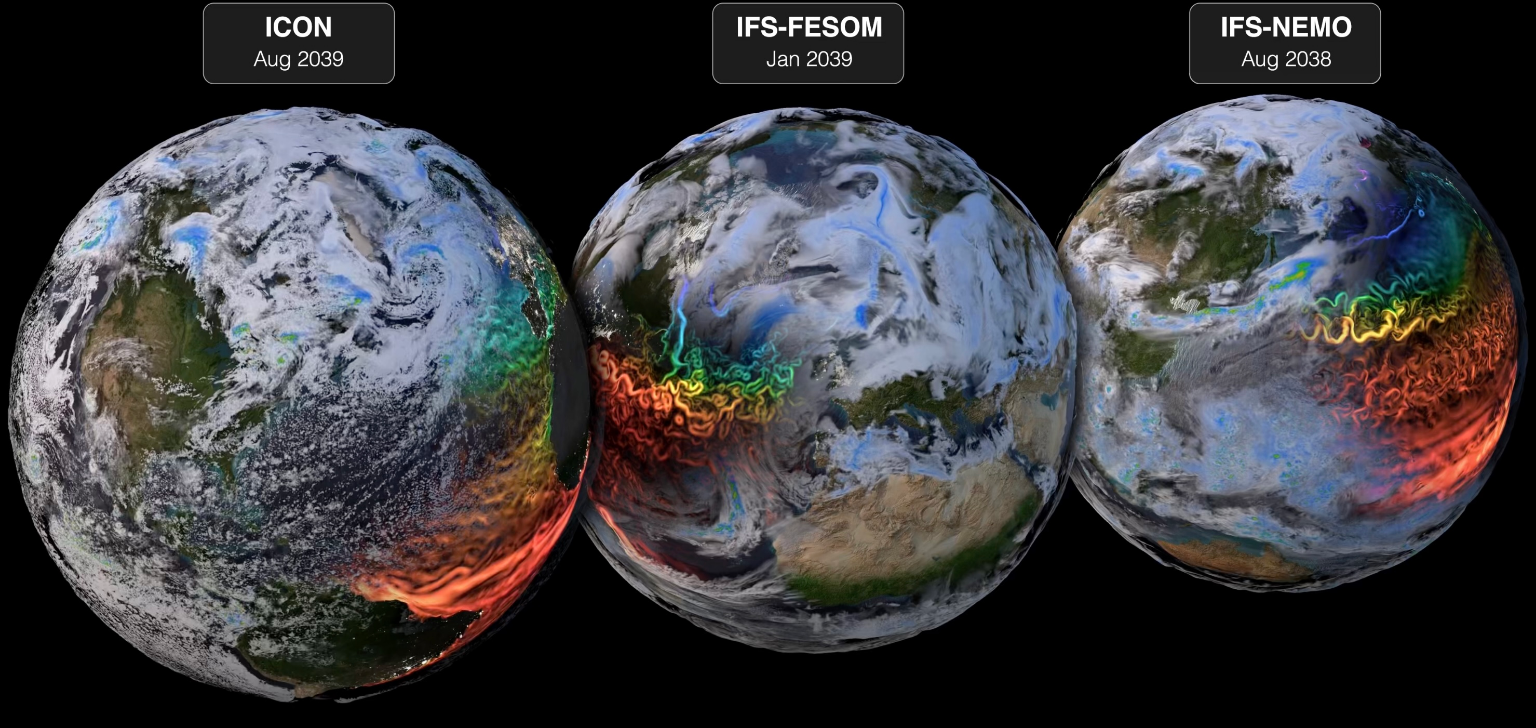
Snapshot of the multi-decadal climate simulations performed with the three climate models, at approximately 5km resolution. Credit: ECMWF
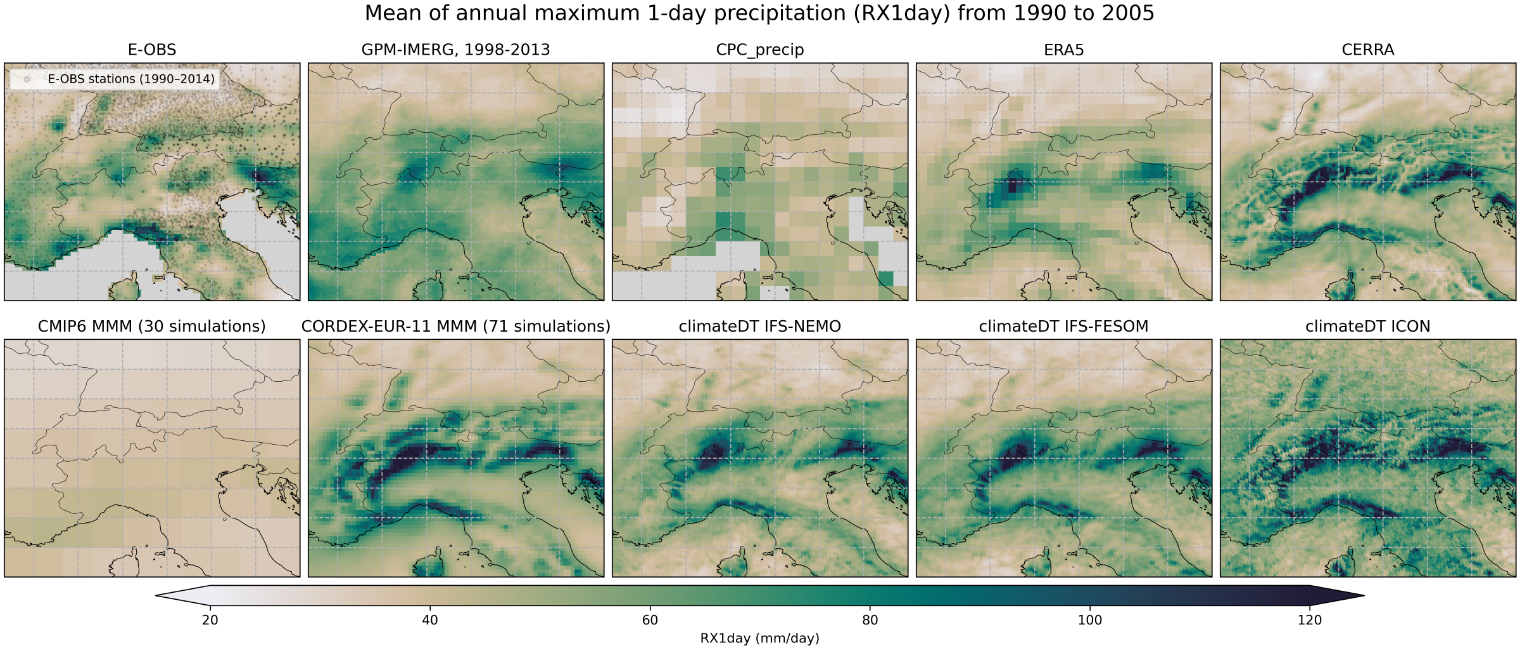
Mean of annual maximum 1-day precipitation (RX1day), over the Alpine region, averaged over the period 1990–2005.
Climate DT models (IFS-NEMO, IFS-FESOM, ICON) compared to observational products (E-OBS, GPM-IMERG, CPC), reanalyses (ERA5, CERRA) and multi-model ensembles (CMIP6 — 30 simulations, CORDEX-EUR-11 — 71 simulations). Computed on the HEALPix H1024 grid (~6.4 km). Credit: ECMWF.
The km-scale IFS-FESOM ensemble accurately reproduces the spatial structure and magnitude of observed extreme precipitation for this Central European flood event. The three-scenario comparison reveals how the thermodynamic response to warming amplifies precipitation, with the future +2 K scenario showing a clear intensification versus the past conditions.
The historical IFS-FESOM ensemble faithfully captures spatial gradients and peak temperatures of the observed event, including urban heat island and orographic contrasts invisible in coarser models. Under +2 K, the area exceeding 40 °C expands substantially into Germany and Benelux; in the past conditions, French peak temperatures remain below 35 °C.

EVALUATION

THE DATA
Register to access Climate DT data
Registration is free and quick. A DestinE account account gives you access to the platform service catalogue, documentation, and community resources.
EU institutions, agencies and bodies, public authorities of EU Member States and Digital Europe Programme Associated Countries.
Public academia and research teams from EU Member States or DEP (Digital Europe Programme) Associated Countries, provided that their domain of activity and intended usage are consistent with the objectives and scope of DestinE. On a case-by-case basis, this category may also include public academia and research teams from third countries, as long as their activities serve the same objectives and are not considered contrary to the Union's strategic assets, interests, autonomy, or security.
Private sector based in EU Member States or DEP (Digital Europe Programme) Associated Countries, provided that their domain of activity and intended usage are consistent with the objectives and scope of DestinE. On a case-by-case basis, this category may also include Private sector based in or controlled by entities from third countries, as long as their activities serve the same objectives and are not considered contrary to the Union's strategic assets, interests, autonomy, or security.
Selected third country public authorities following EU's international commitments. Selected public authorities of ESA member states Selected public authorities of ECMWF member states Selected public authorities of EUMETSAT member states Public authorities from countries who have signed a digital alliance or partnership or a similar agreement with the Union Other public sector entities authorised under the AI for Public Good Administrative Agreement
DestinE 3Es (ESA/ECMWF/EUMETSAT) contractor contributing or participating in the implementation and further development of DestinE.
Users can access Climate DT data in different ways depending on their needs.
The original datasets are available in HEALPix grid on the Data Lake, accessible through HDA or directly via Polytope.
Data regridded to a regular latitude-longitude grid and available in Zarr format for a selected set of variables — optimised for cloud-native and analysis-ready access through Earth Data Hub.
Lightweight compressed format delivered through the DestinE Streamer — suited for bandwidth-limited environments and quick exploration.
Explore examples of Climate DT data analysis using Polytope in the User Guide, or directly on the DestinE Platform through Insula notebooks for the Earth Data Hub. Additional notebook examples will be added soon. To integrate Climate DT data into your own workflows on the DestinE Platform, access DeltaTwin (coming soon).
Climate DT visualisations
Various DestinE services support non-expert users in the discovery and understanding of the Climate DT data and their added value. Below you can find a link to these services, and a preview of the storyline simulations viewer, Prismera.
Climate DT storyline simulations allow users to explore how all extreme events that occurred between 2017 and 2025 would have unfolded under different climate conditions: a 1950-like pre-industrial climate, present-day conditions, and a world 2°C warmer.
A dedicated storyline viewer supports interactive exploration of these simulations at kilometre-scale resolution, making it possible to compare the same event across climate states and assess how global warming is reshaping regional extremes.
The viewer shows 2 different events and new ones will be added regularly.

Ready to work with
Climate DT data?
Whether you have a technical question, need help getting started, or want to contribute — the DestinE team is here to help.
Learn more about the Climate DT simulations, underlying models, simulations quality, as well as how to access the data, including practical examples. The Climate DT user guide and the Learning Hub support developing your skills and using the Climate DT data effectively.
Let us know which features you are missing in DestinE to use the Climate DT for your activities. Check the roadmap if features under development could support your work.
Central entry point for any question or request. Whether you need technical help, or advice on adopting specific services, your query is handled directly or routed to the most relevant expert teams across the DestinE ecosystem — ensuring fast, accurate, and coordinated support.
A collaborative space where the community learns together. Discover tutorials, shared use cases, and hands-on training materials contributed by users and experts, and benefit from collective knowledge to accelerate your work with DestinE.
New to DestinE?
Register on the platform to get a free account — then apply for upgraded access to retrieve Climate DT simulation data.


