User interface
Prerequisites
Registration with a DestinE account is required to access the application. An unregistered user is automatically redirected to the authentication page.
Map view for 2D data
The landing page of the AQWALYTICS interface is centered on a map view, initially zoomed out to view the full European map. It displays available water bodies boundaries (in red) and associated vorteX-io in-situ micro-stations. The user can interact with the map to adjust on a region of interest (bounding box).
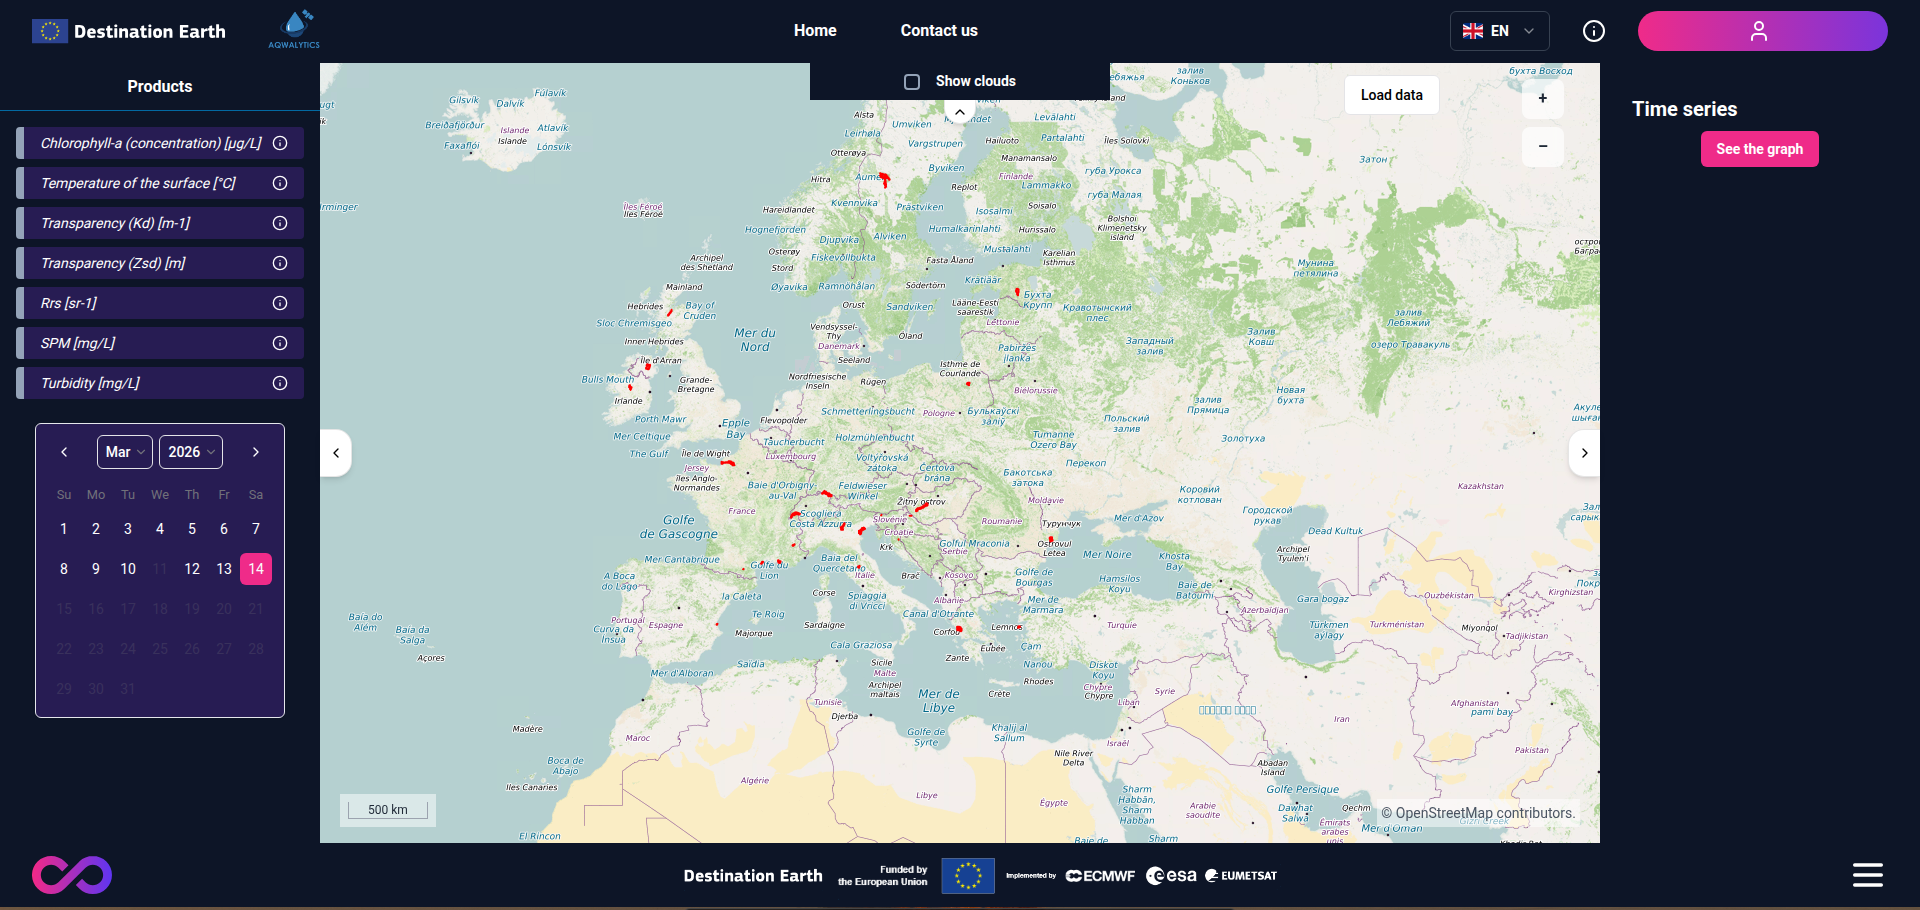
AQWALYTICS landing page
The left banner enables 2D data filtering:
Parameter filter: E.g. Temperature, Chlorophyll-a concentration, … (see Products). For each parameter, unit and short description are provided.
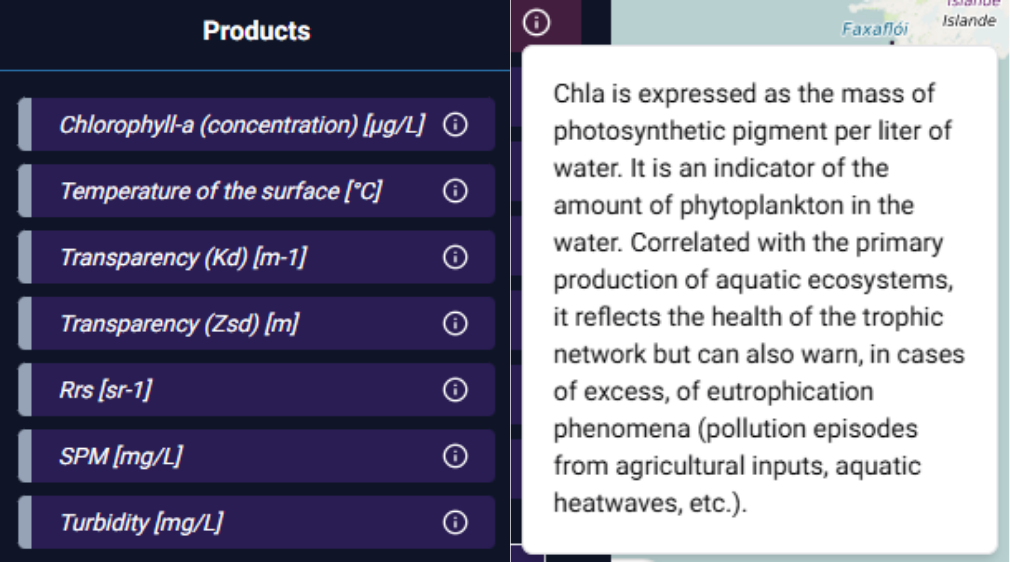
Parameter filter and tooltip
Date filter for 2D data: For the selected parameter and region (bounding box), the date filter highlights observations availability and enables selection through a calendar view. It is initially set to the last date where data has been produced. Availability depends on the swath of the sensor (Sentinel 2 / Landsat 8 or 9) used to retrieve the selected parameter.
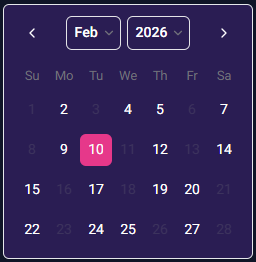
Date filter for 2D data
These functionalities allow the user to view a high resolution 2D map of a water quality parameter for the displayed water body(ies) for the selected date, by clicking on the “Load data” button.
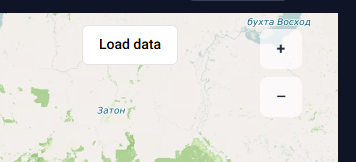
‘Load DATA’ button
In addition the user can display cloud coverage associated with the observation, as a support to understanding missing data. The following pictures illustrate the provided views.
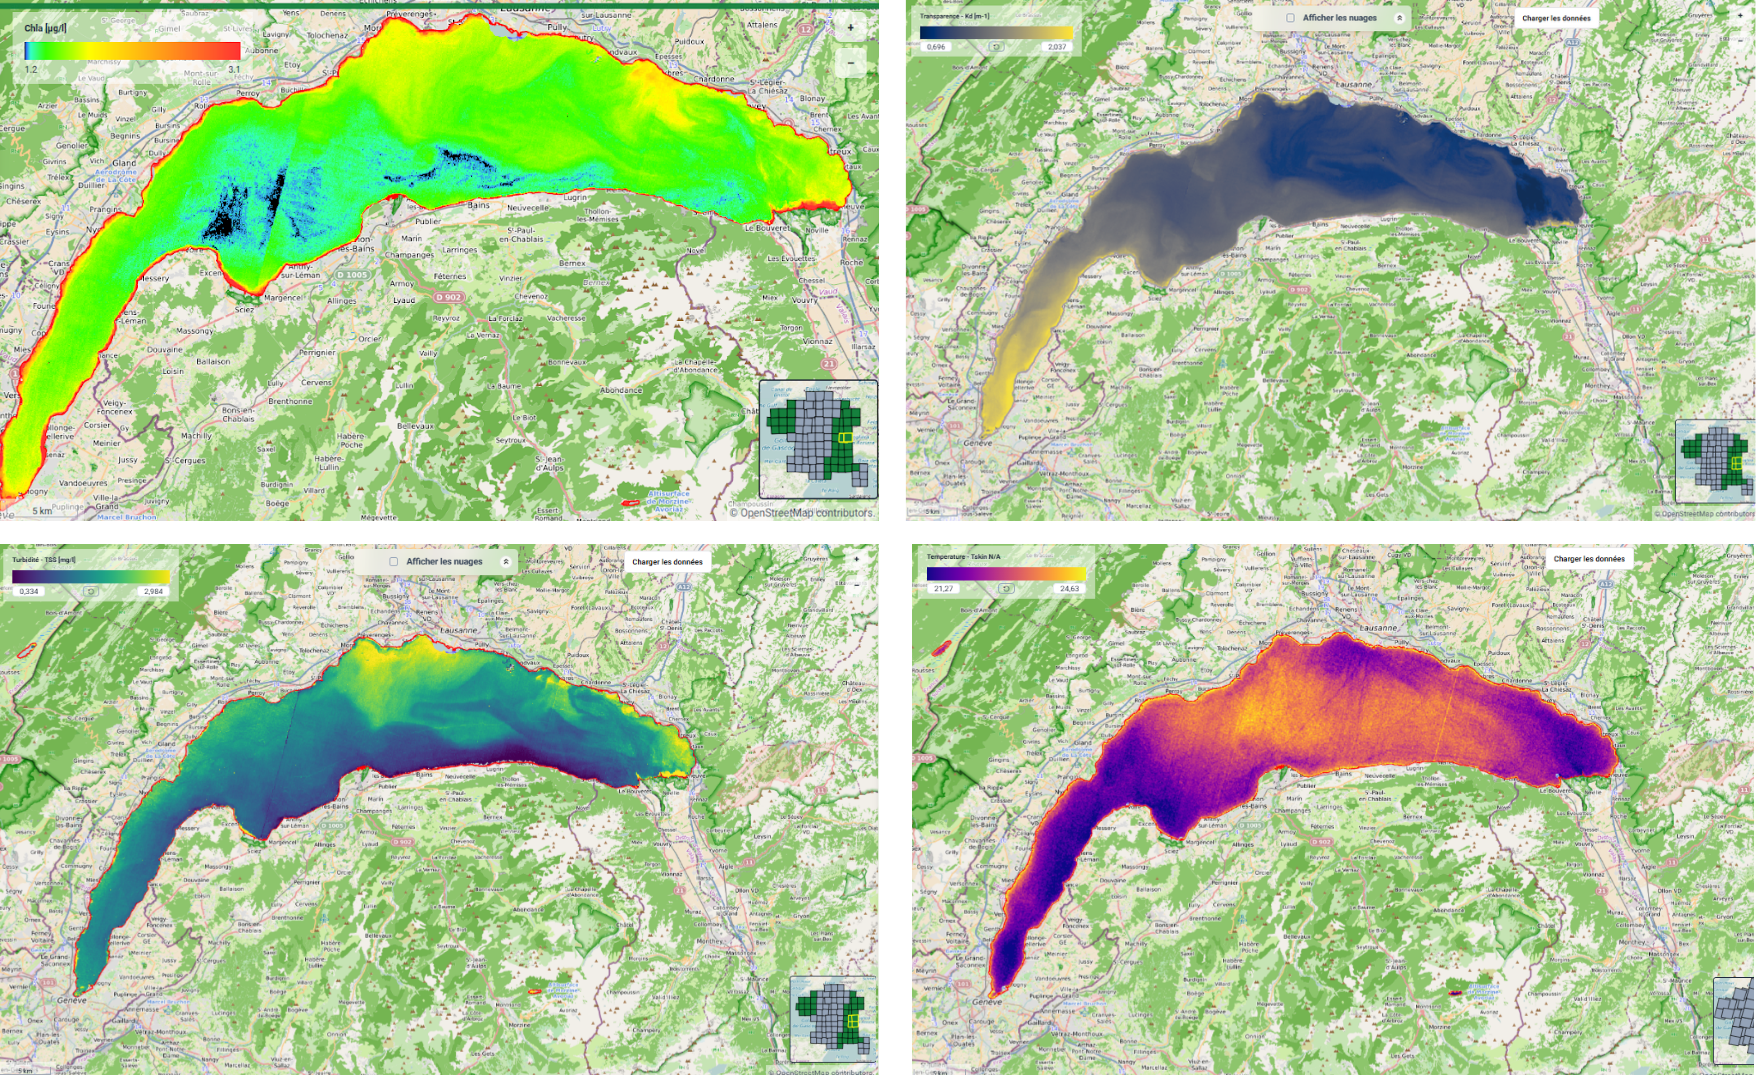
Visualisation of parameters in Lake Geneva. Chlorophyll-a concentration (top left), transparency (top right) and turbidity (bottom left) on 17 March 2024, and surface temperature (bottom right) on 20 March 2024
Consequently, the AQWALYTICS map view allows to follow the evolution of a lake as illustrated below:
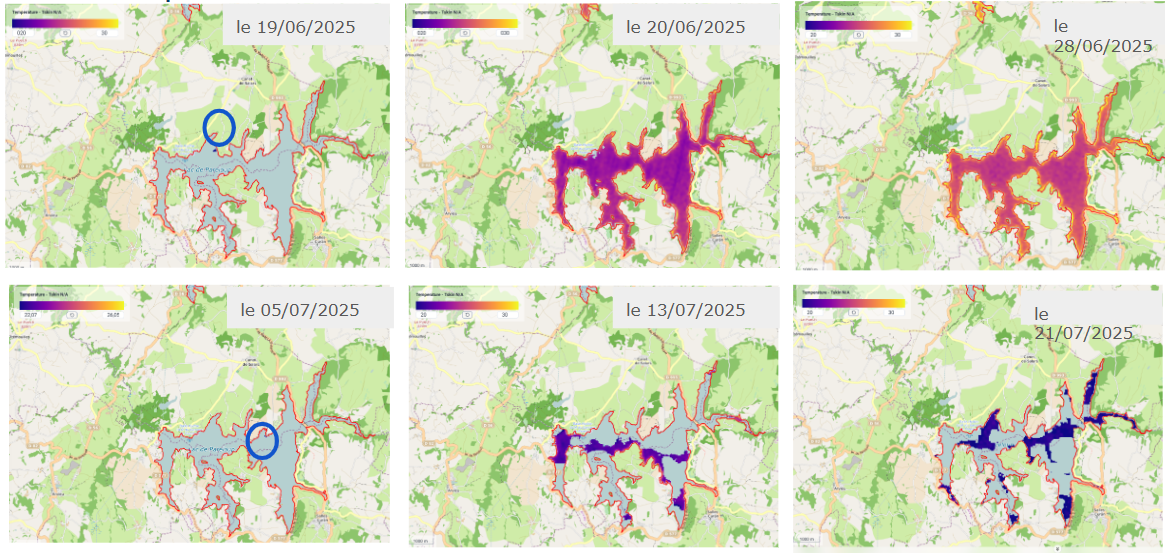
Temperature for Lake Pareloup in June and July 2025
The parameter color palette associated with each parameter is calculated automatically.
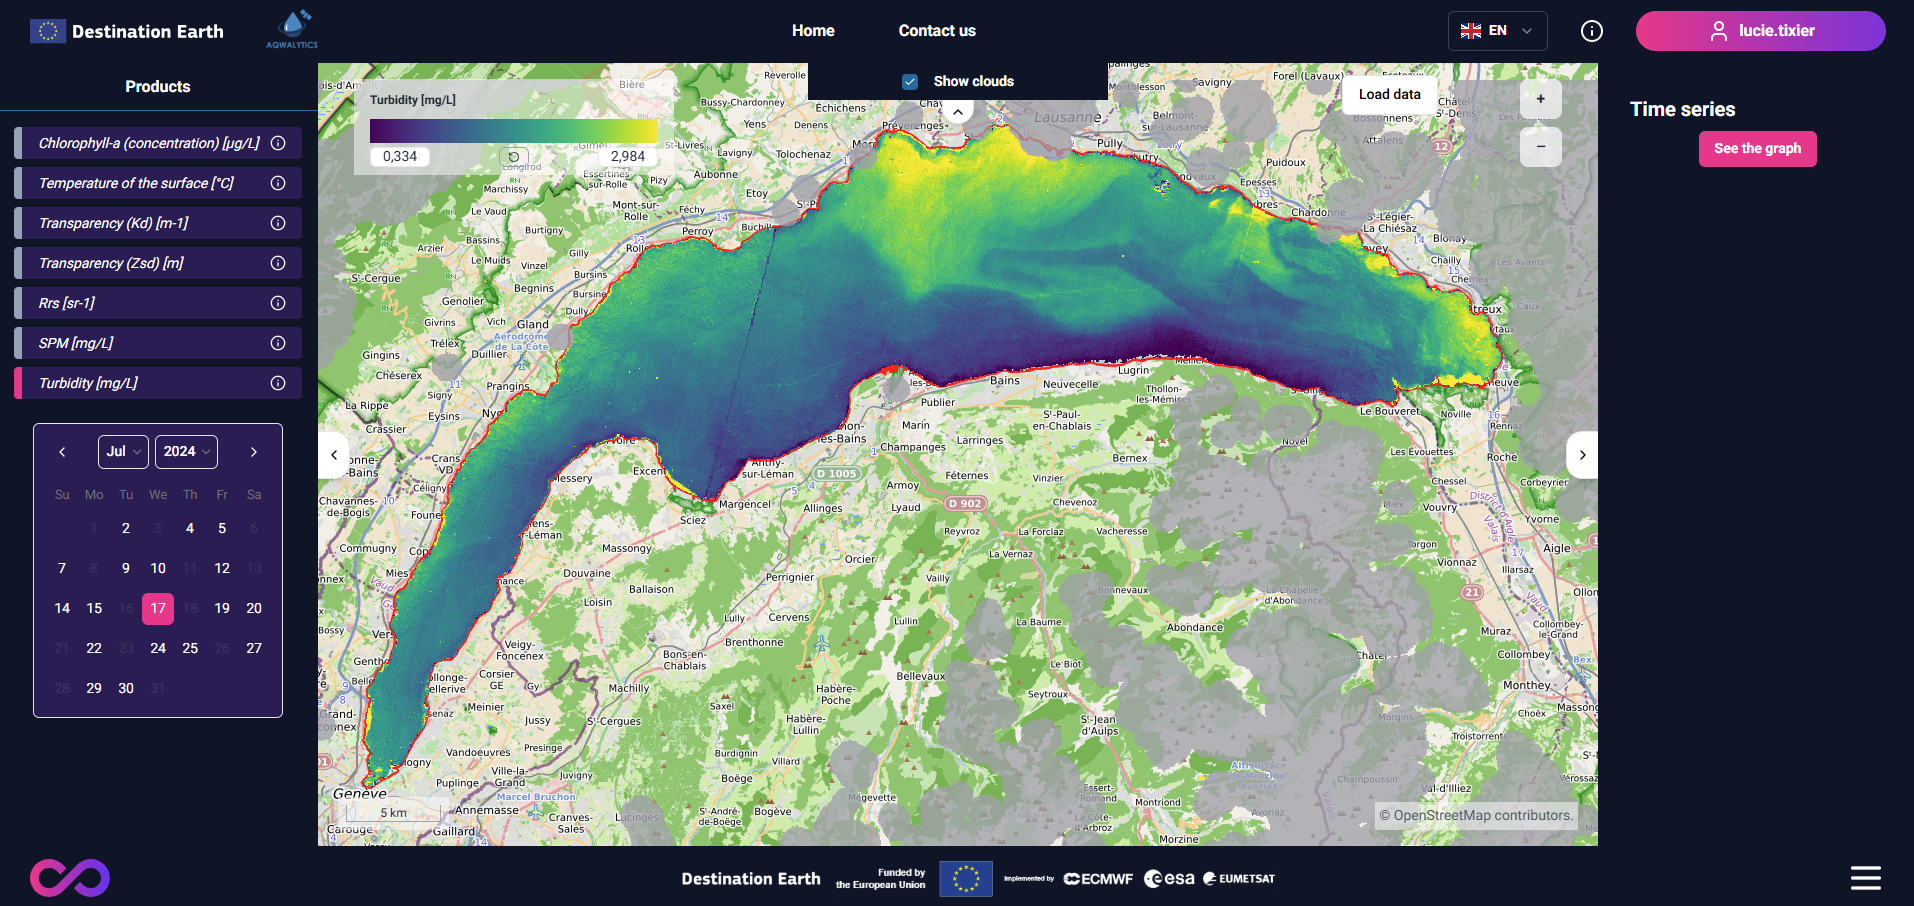
Turbidity for Lake Geneva on 17/07/24 with clouds
The parameter color scale of this palette can be modified by the user through the legend displayed at the top left with the indicator and minimum/maximum value. Please note that the user has to click again on the “Load data” button after changing minimum or maximum color scale value.
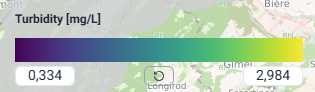
Turbidity color scale
Focus on one or multiple water bodies
The user can access specific information on a water body:
water body characteristics: code, name, area.
associated in-situ station(s) information: name, installation date, sensor position
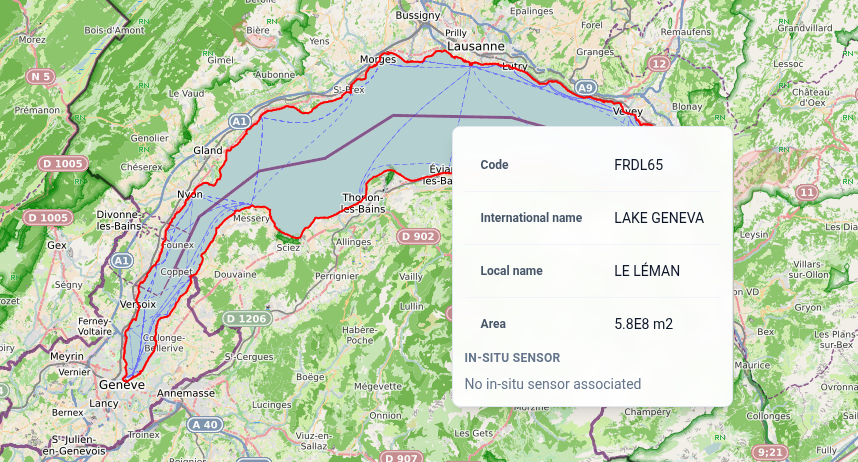
Water body information
Once a waterbody (or multiple waterbodies) is selected, the application enables the user to visualise and export the statistics time series of all the parameters available, through the tool accessible on the right panel of the landing page.

‘See the graph’ button
It contains the following features:
Selection of the parameter (A)
Selection of the value (mean, maximum or minimum) (B)
Selection of the ordinate scale (C)
Selection of the time period (D)
Download of the associated series as a file in tab format (csv) (E)
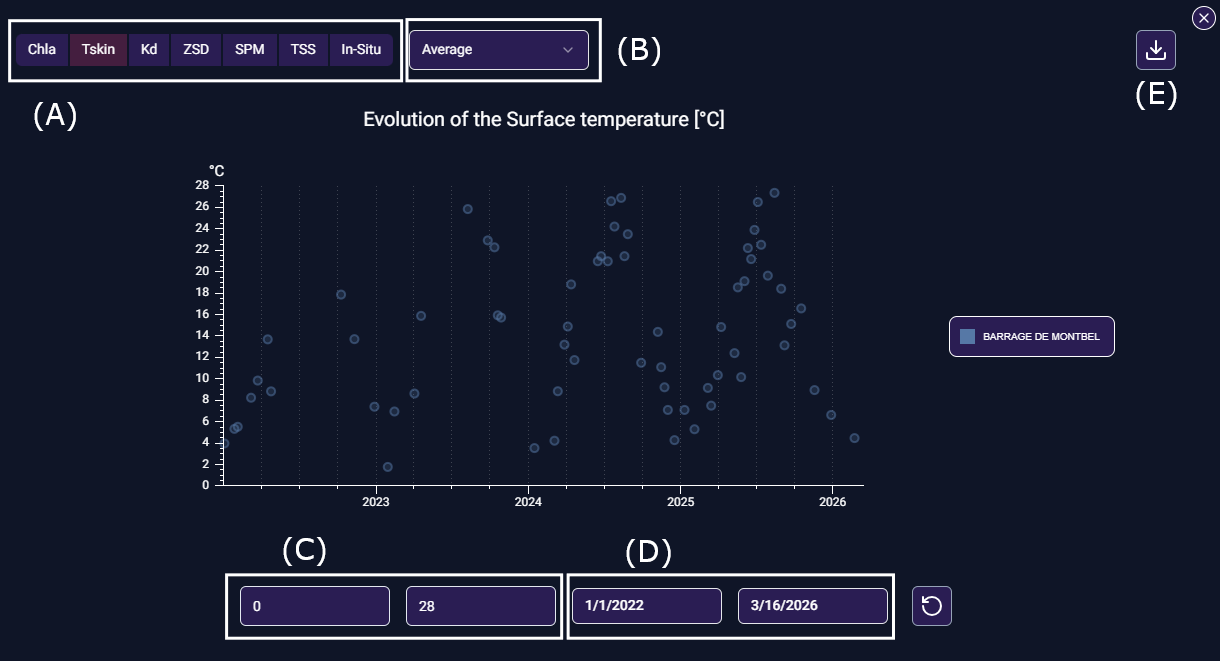
Graph window (statistics time series)
Link to vorteX-io App in-situ data
In addition to the in-situ stations data directly available in AQWALYTICS, the application informs and provides a streamline access to the vorteX-io App providing in-situ data.
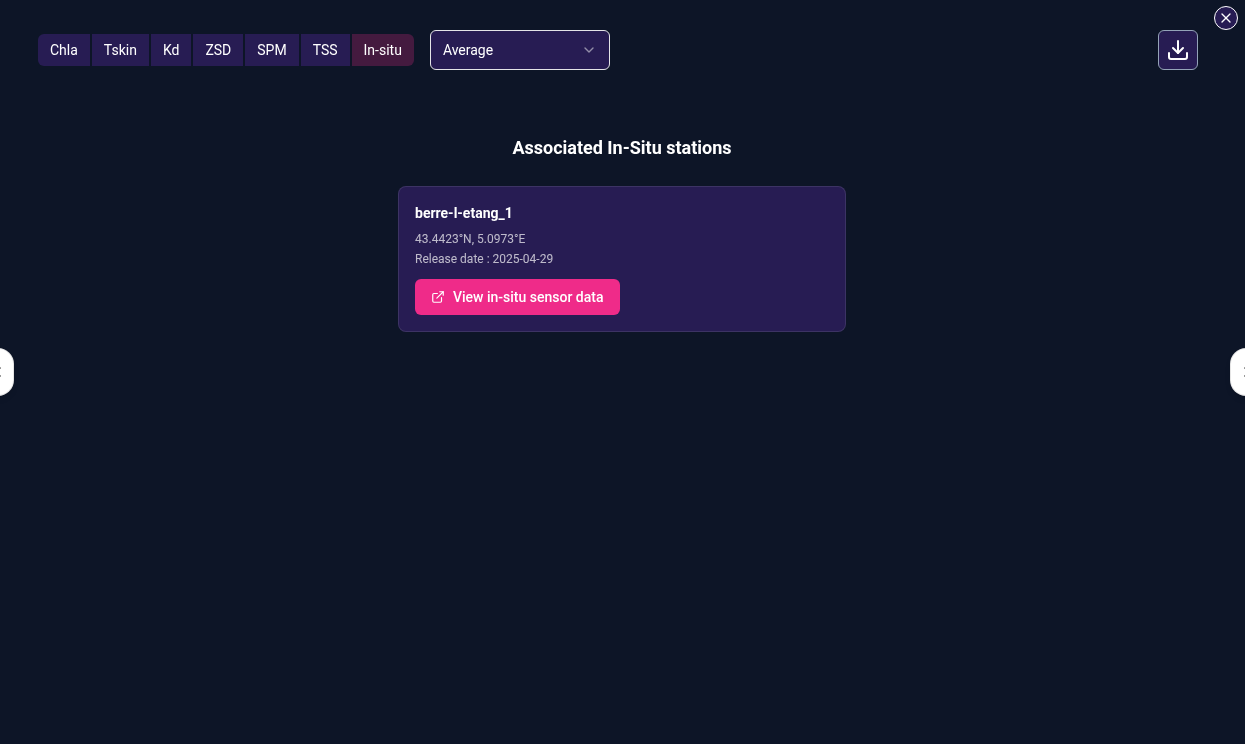
Link to vorteX-io App for a selected waterbody
vorteX-io App interface for a DestinE user without vorteX-io account
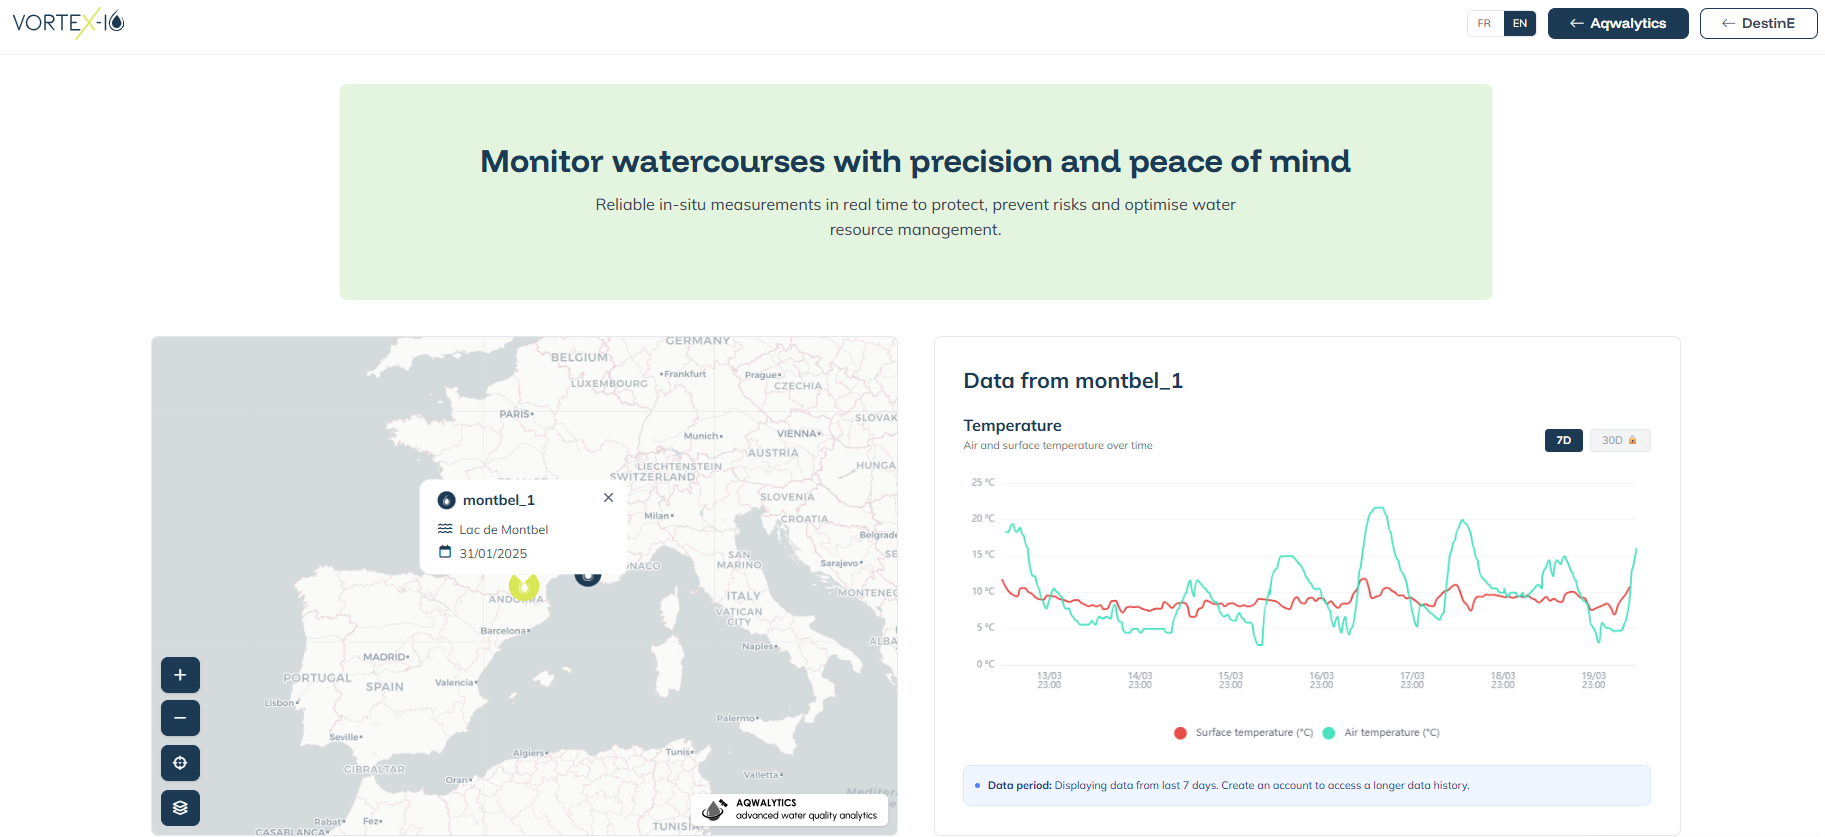
No licence is required for that access. By creating a free vorteX-io account, the user accesses the full in-situ temperature data view (e.g. historical data, visuals).
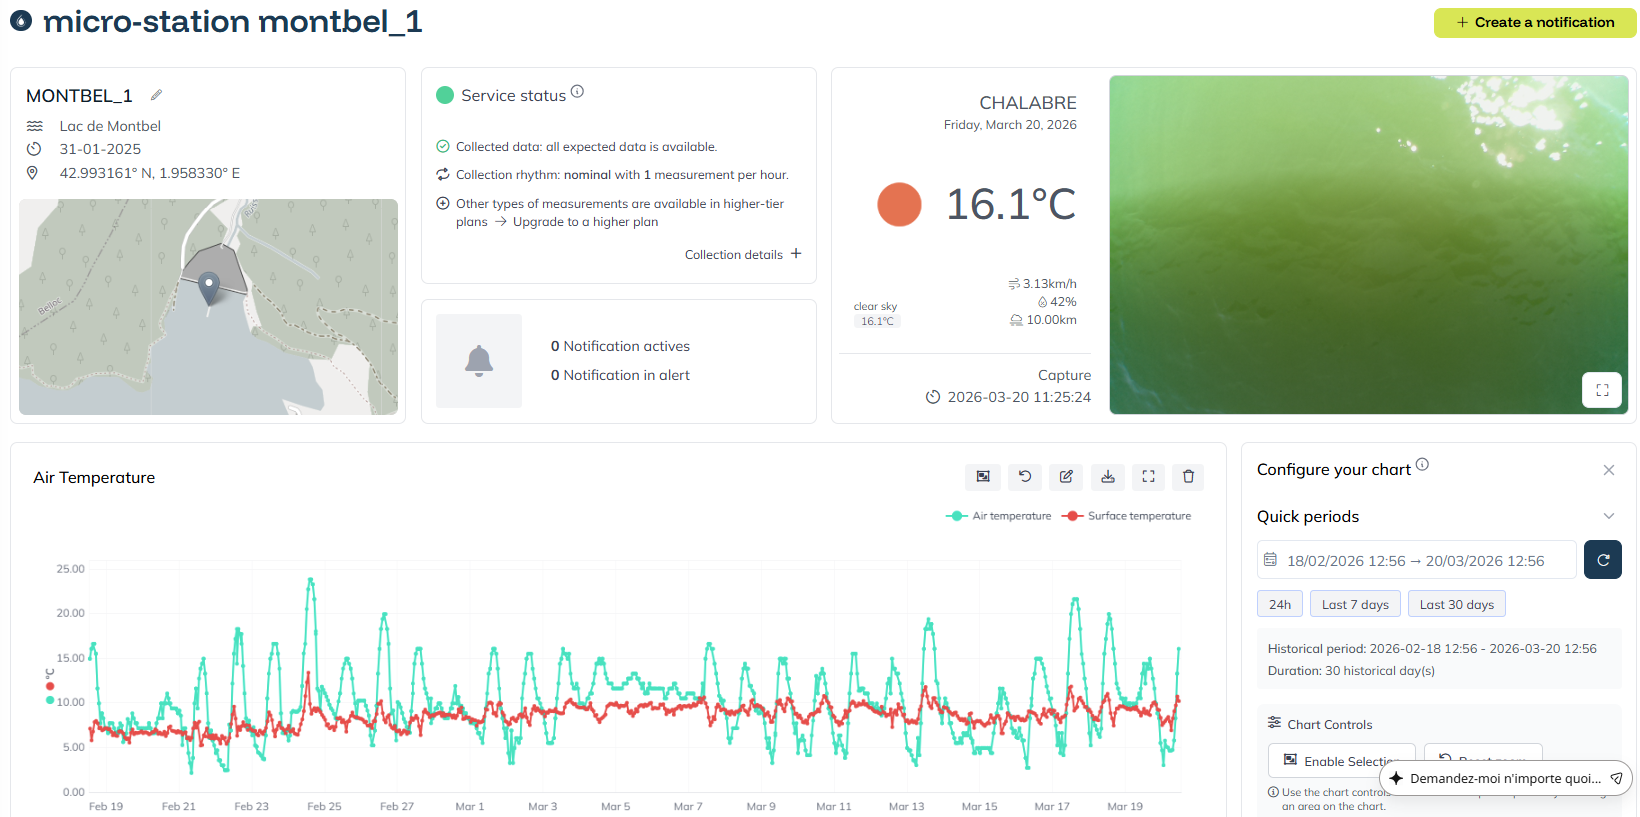
vorteX-io App interface for a DestinE user with vorteX-io account
User interface languages
AQWALYTICS interface is available in English and French for the first version of the service.

Langage selector