Scenario Definition & Simulation
Now that the user has a notion on how to interact with the data and display visualizations, this section explains how to create your own scenarios and simulations from scratch.
Defining a scenario
When loading a scenario, the map is populated with the scenario’s grid and road data and provides the user with several features to interact with and visualize the data.
Maps consist of road segments and grid hexagons. Each segment or tile contains several parameters that describe the element. Parameter values can be changed and/or selected to define new simulation scenarios.
Figure 12 below describes the main UI components shown to the user when loading a scenario:
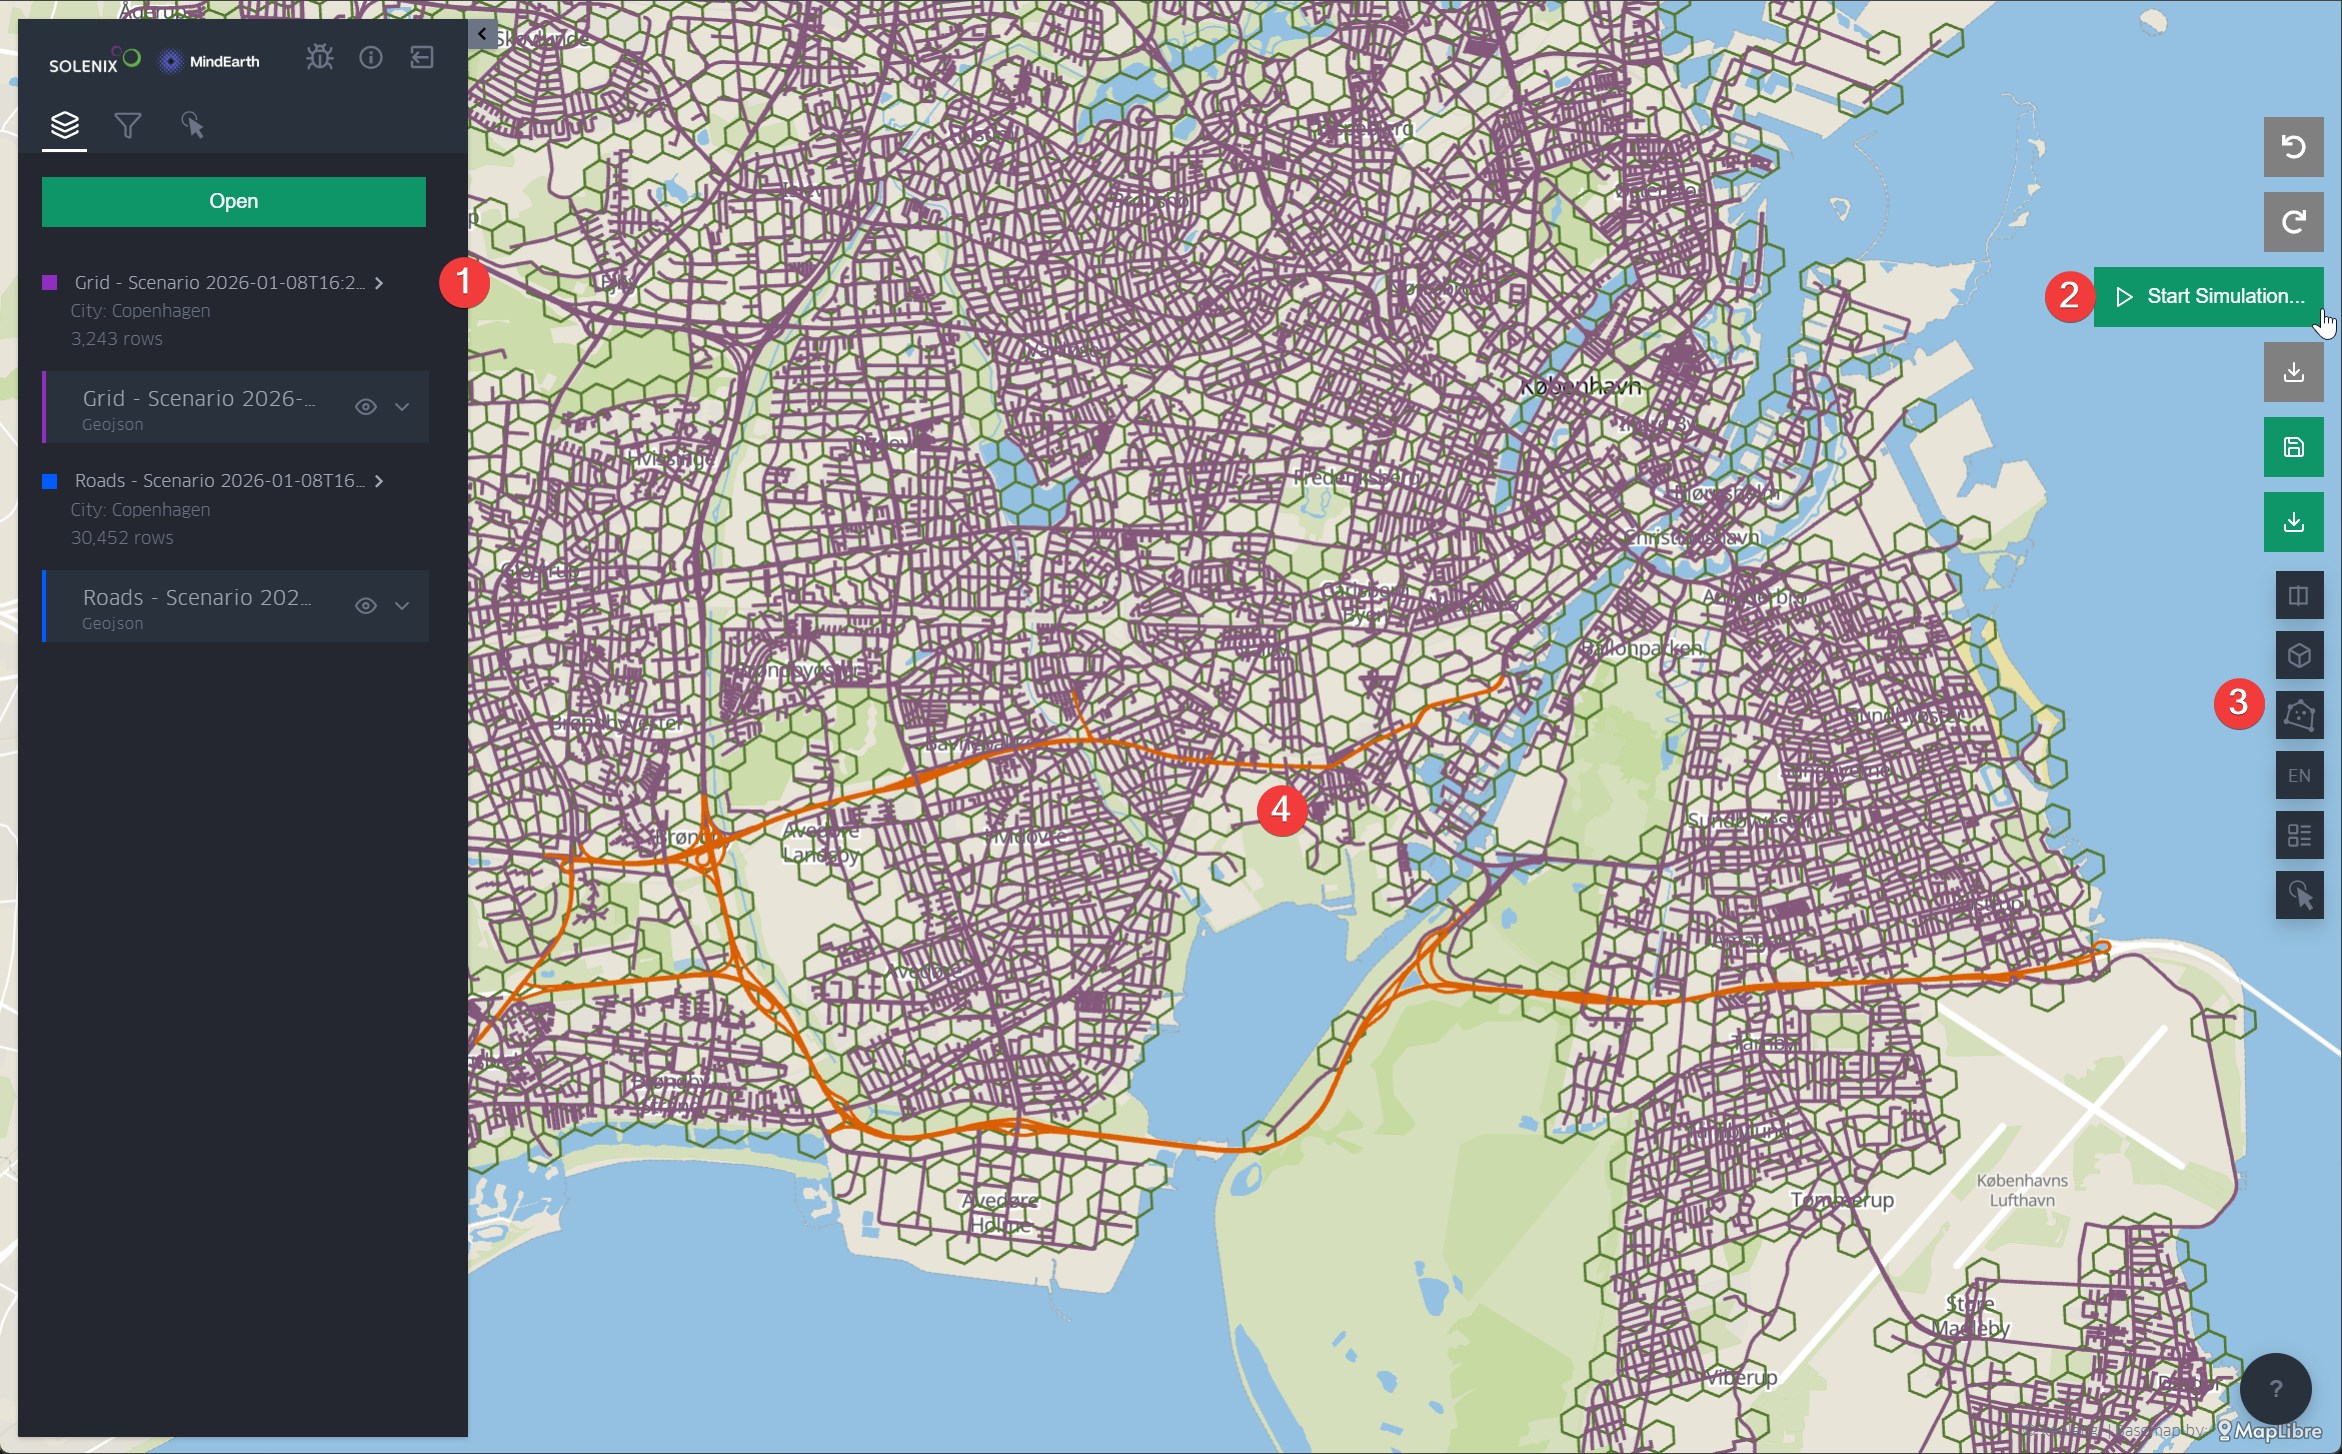
Figure 12 Scenario visualization and definition
The left-side panel, with the layers tab shown by default, is the main way to configure the visualization, filter and explore the data, load another prediction or scenario.
The buttons on the top of the screen allows the user to control their modifications to the loaded scenario, starting a simulation, saving or downloading their changes.
The right-side panel toolbar has several useful functionalities, such as splitting the visualization into dual map view, changing the 3D perspective, selecting multiple roads or grid hexagons by drawing a polygon, and showing the legend.
By default, the colours are chosen as follows: purple for roads, green for the grid and orange for road or grid elements that have been modified by the user.
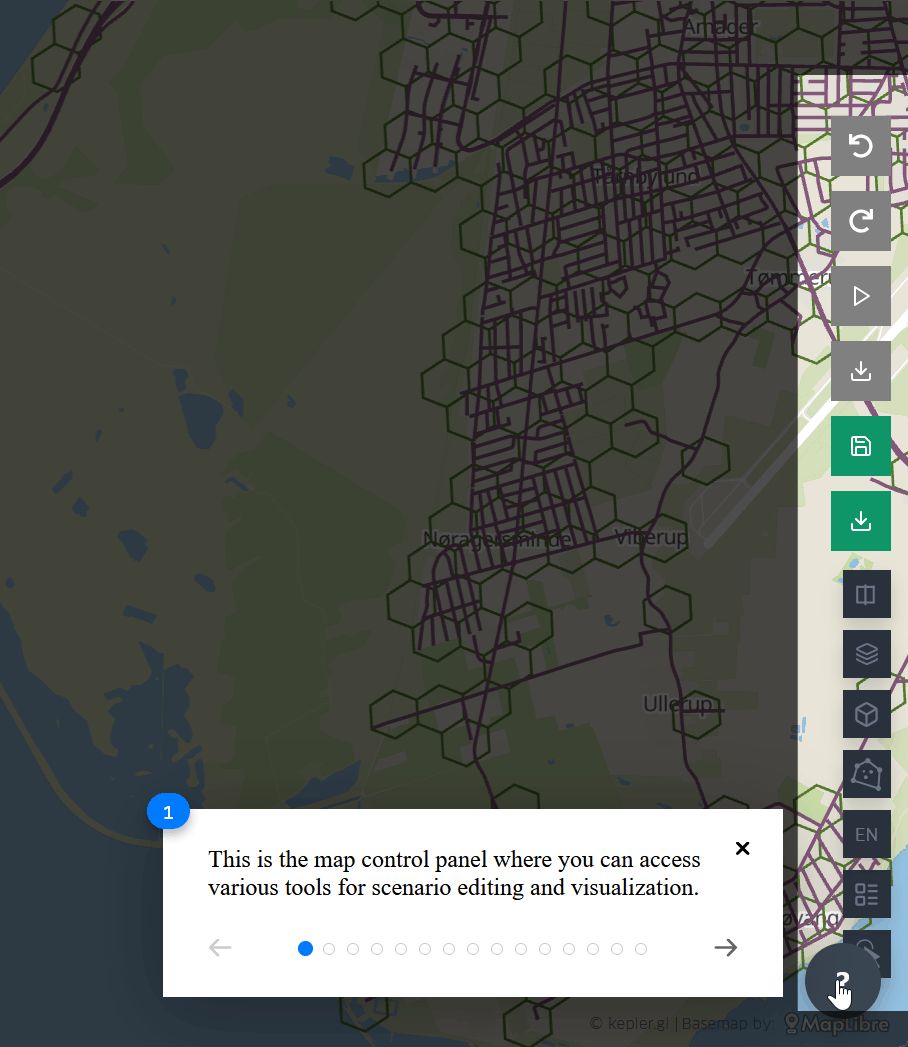
Figure 13 Scenario tutorial
Figure 13 shows the tutorial that can be displayed by clicking on the Help button at the bottom right of the screen. The tutorial explains step-by-step the functionality available for scenario visualizations.
Figure 14 below shows the interaction possibilities with the map itself to define a scenario:
Hovering over or clicking on a road or grid element opens a window summarising the parameters of the specific element, along with their units.
The user has the possibility to edit the values of the parameter.
Only five parameters are shown by default. Clicking the “Show More” button will show the remaining parameters.
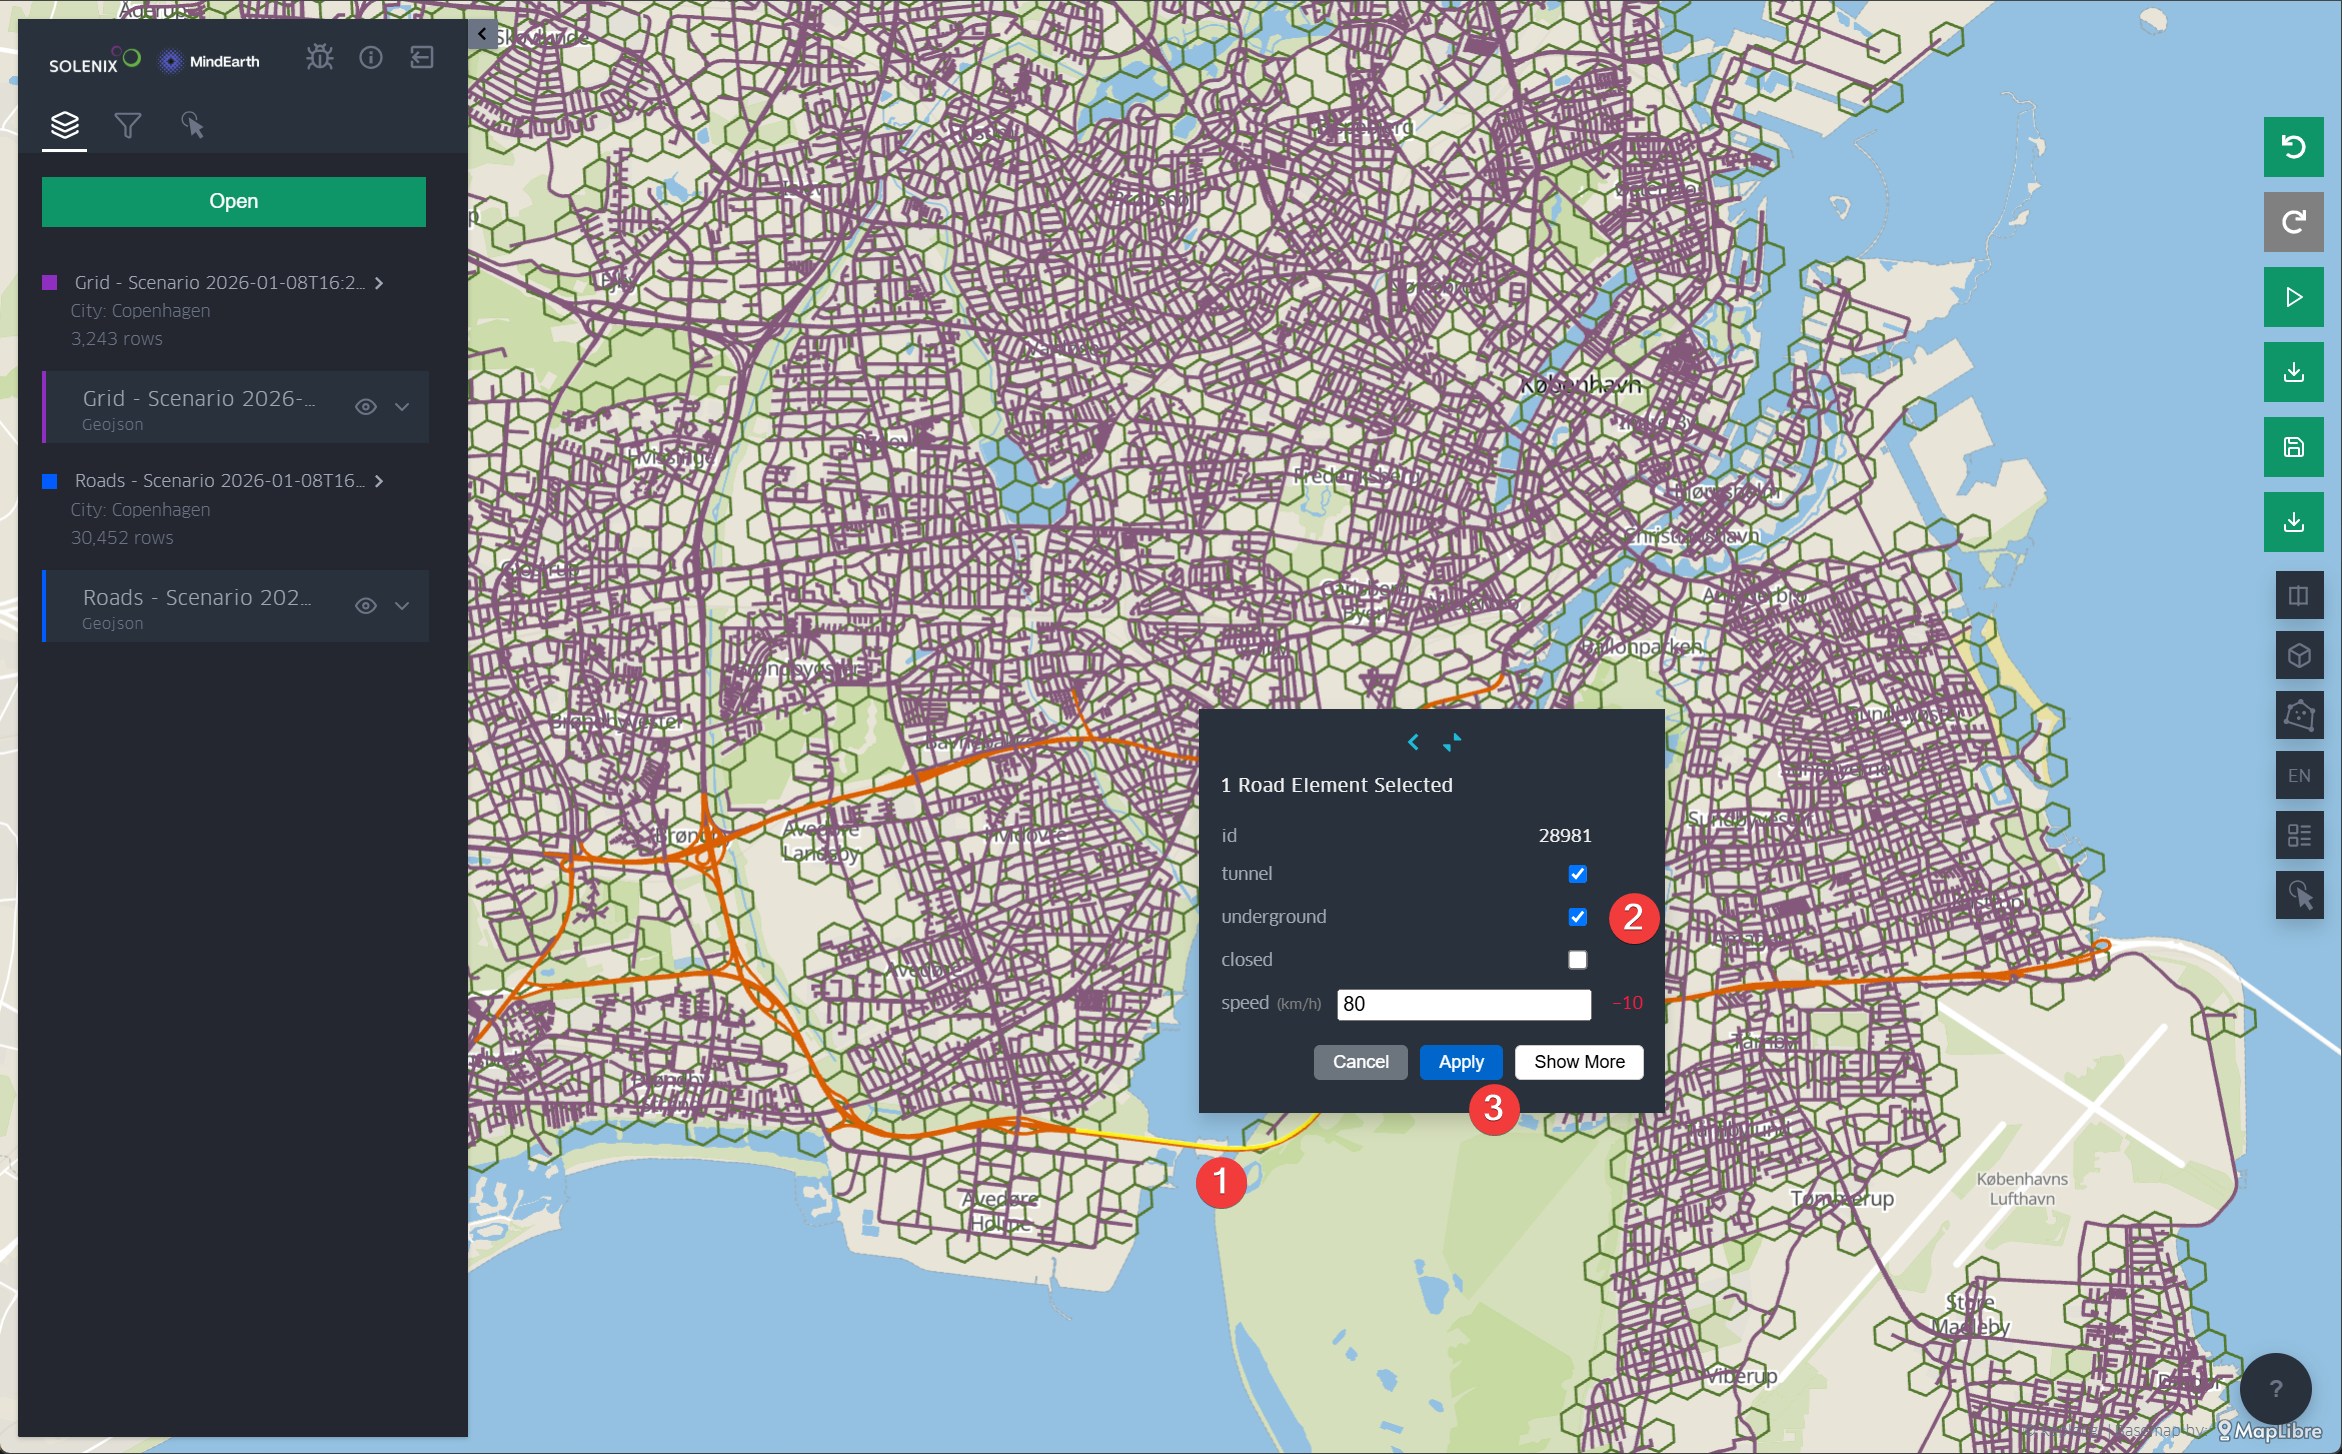
Figure 14 Scenario definition
The user can also make multiple changes in an area using the multi-selection button on the right panel. The multi-selection feature shown in Figure 15 allows the user to select all road or grid elements in an area to define the conditions of the scenario (e.g change type of land use):
The user can define an area is a user using a rectangle or polygon.
The elements covered by the selection will be highlighted.
Modifying the values of parameters will modify all the elements in the area.
The selection always covers only the road segments or the grid hexagons and can be toggled between both.
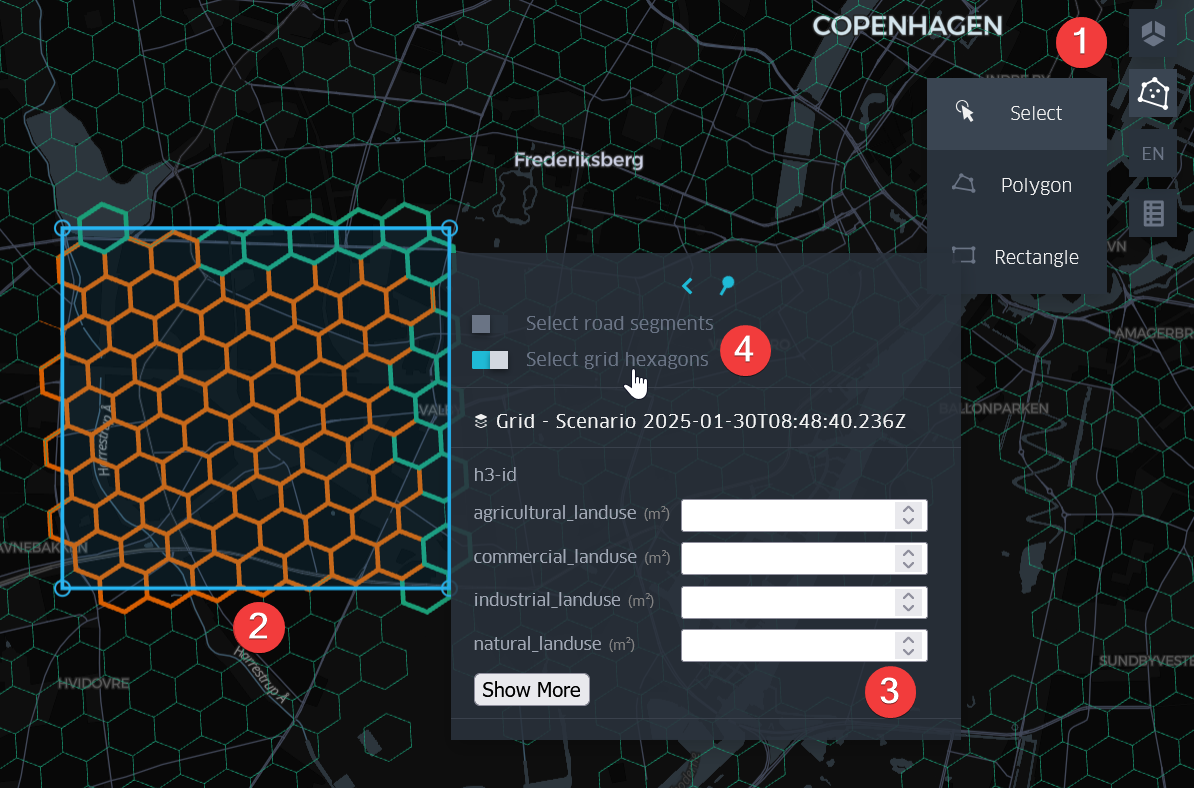
Figure 15 Grid tile multi-selection and properties
The grid tiles consists of 100x100m hexagons, each tile describes the POIs in that area and the type of land use. The following properties can be edited in zone tiles:
Land use: Defines the ratio of the area covered by 4 types of land use: Residential, Commercial, Agricultural and Industrial.
Points of interest: Defines the number of POIs in the area. Types of POIs are Food, Fun, Health, Infrastructure, School, Services, Shop, Sport, and Tourism.
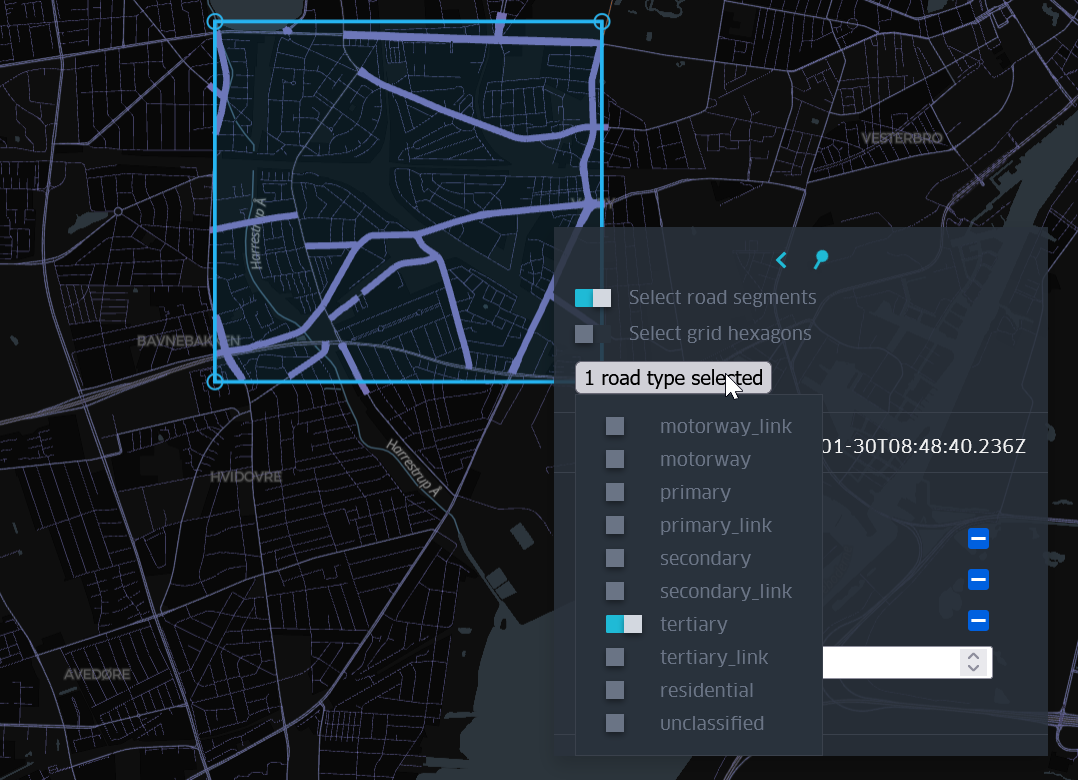
Figure 16 Road segment modifiable properties
For road multi-selection, modifications can be further refined to only target roads of a specific type (e.g. motorway or residential roads).
The following properties can be edited in road segments for defining the scenario:
Closed: This flag specifies whether the road is closed or open.
Underground: This flag specifies whether the road segment is tunneled or not.
Speed: This value defines the maximum speed allowed on the road segment.
Defining Flood Defenses in Scenarios
CITYNEXUS PRO enables users to define flood defense structures within scenarios to assess their effectiveness against flooding events. Flood defenses can be defined as multi-line geometries representing physical barriers such as dikes, levees, walls, or embankments.
To define flood defenses in a scenario:
Select the flood defense drawing tool from the right-side panel toolbar
Draw multi-line geometries on the map where flood defense structures should be located
The flood defenses are considered by the simulation to be 1m-high thin dams
Flood defense lines can be edited by selecting existing defenses and modifying their geometry. Multiple defense structures can be defined to create comprehensive flood protection systems for vulnerable areas.
After editing the scenario, the user is offered different set of functionalities, depending on the scenario’s origin (platform-defined or user-created). Platform-defined default scenarios are more restricted and should be used as a base to create user scenarios. For instance it is not possible to directly simulate a platform defined scenarion, but needs to be saved in the user private workspace before simulatiing.
In user-defined scenarios, functionalities include:
Undo and redo changes to the map
Download a summary of the changes made to the map
Configure and start simulations
Save changes so they can be accessed later
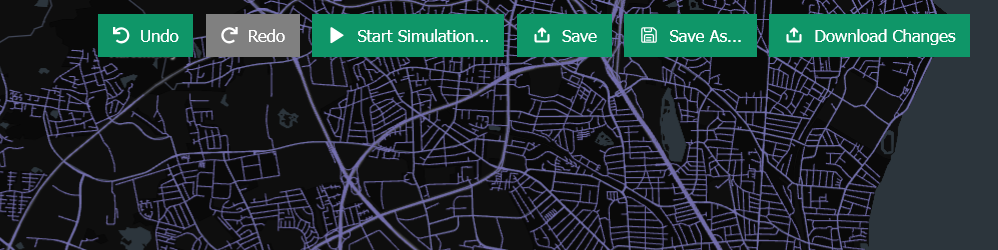
Figure 17 Toolbar for user-created scenario
Starting a new simulation
Changes to grid tile and road segment conditions along with scenario simulation parameters will have effects on the simulated air quality and mobility a patterns. For running a scenario simulation (Figure 18) the user needs to previously specify:
the type of the day (weekday and/or weekend)
the time frame where the simulation will run, defined by 3h time slots
the percentage of bicycles in circulation over the total number of vehicles
the percentage of electric cars in circulation over the total number of vehicles
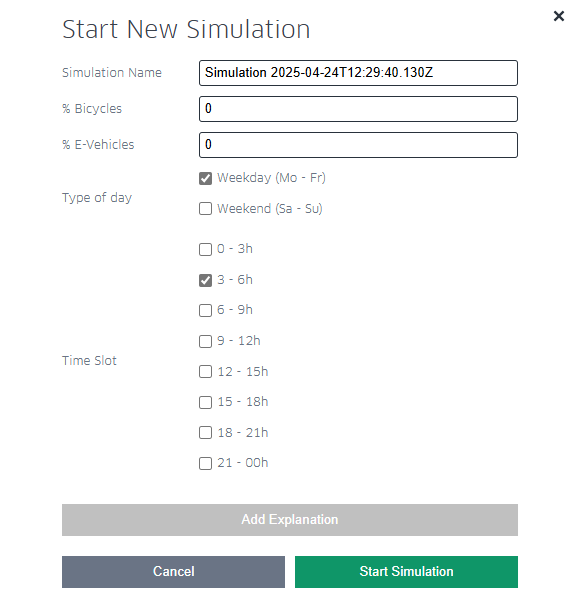
Figure 18 Configuration of a New Simulation
Once all the parameters are set, the user can press “Start Simulation”. The simulation will run in the background and it also will be saved in the user workspace (Figure 20). The user can check the status of the simulation:
Queued: The simulation is in the pipeline and will be started as soon as the GPU becomes available
Running: The scenario is being simulated
Succeded: The scenario has been simulated and the results are available for visualziation and/or download
Failed: An error occurred, the simulation has been aborted
by displaying the Results table on the workspace. To display the simulation results, the user needs to click on the table.
Running Flooding Simulations
CITYNEXUS PRO provides advanced flooding simulation capabilities that allow users to model flood events with various environmental conditions and assess the effectiveness of flood defense structures. Flooding simulations can be run with or without defined flood defenses.
To configure and run a flooding simulation, the user needs to specify the following parameters:
Sea level rise: Elevation increase in meters (m) to account for sea level changes
Rainfall: Precipitation amount in millimeters (mm)
Rain start time (if rainfall > 0): Beginning time of rainfall event
Rain end time (if rainfall > 0): Ending time of rainfall event
River discharge: Water flow rate in cubic meters per second (m³/s) from upstream sources
Road closing threshold: Water depth in meters (m) at which roads become impassable
Road speed slowing threshold: Water depth in meters (m) at which vehicle speeds are reduced
Road slow speed: Vehicle speed in kilometers per hour (km/h) when water depth exceeds the slowing threshold
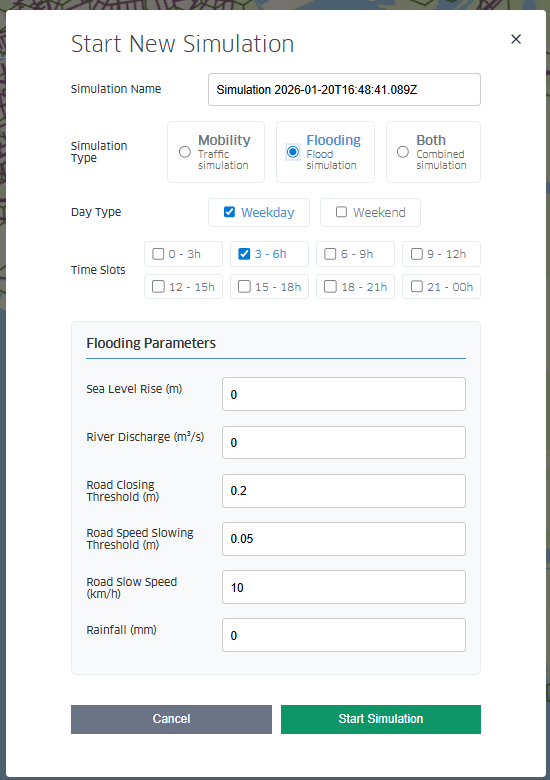
Figure 19 Configuration of a New Simulation (Flooding)
The flooding simulation models water propagation across the terrain, considering topography, infrastructure, and defense structures for each time step.
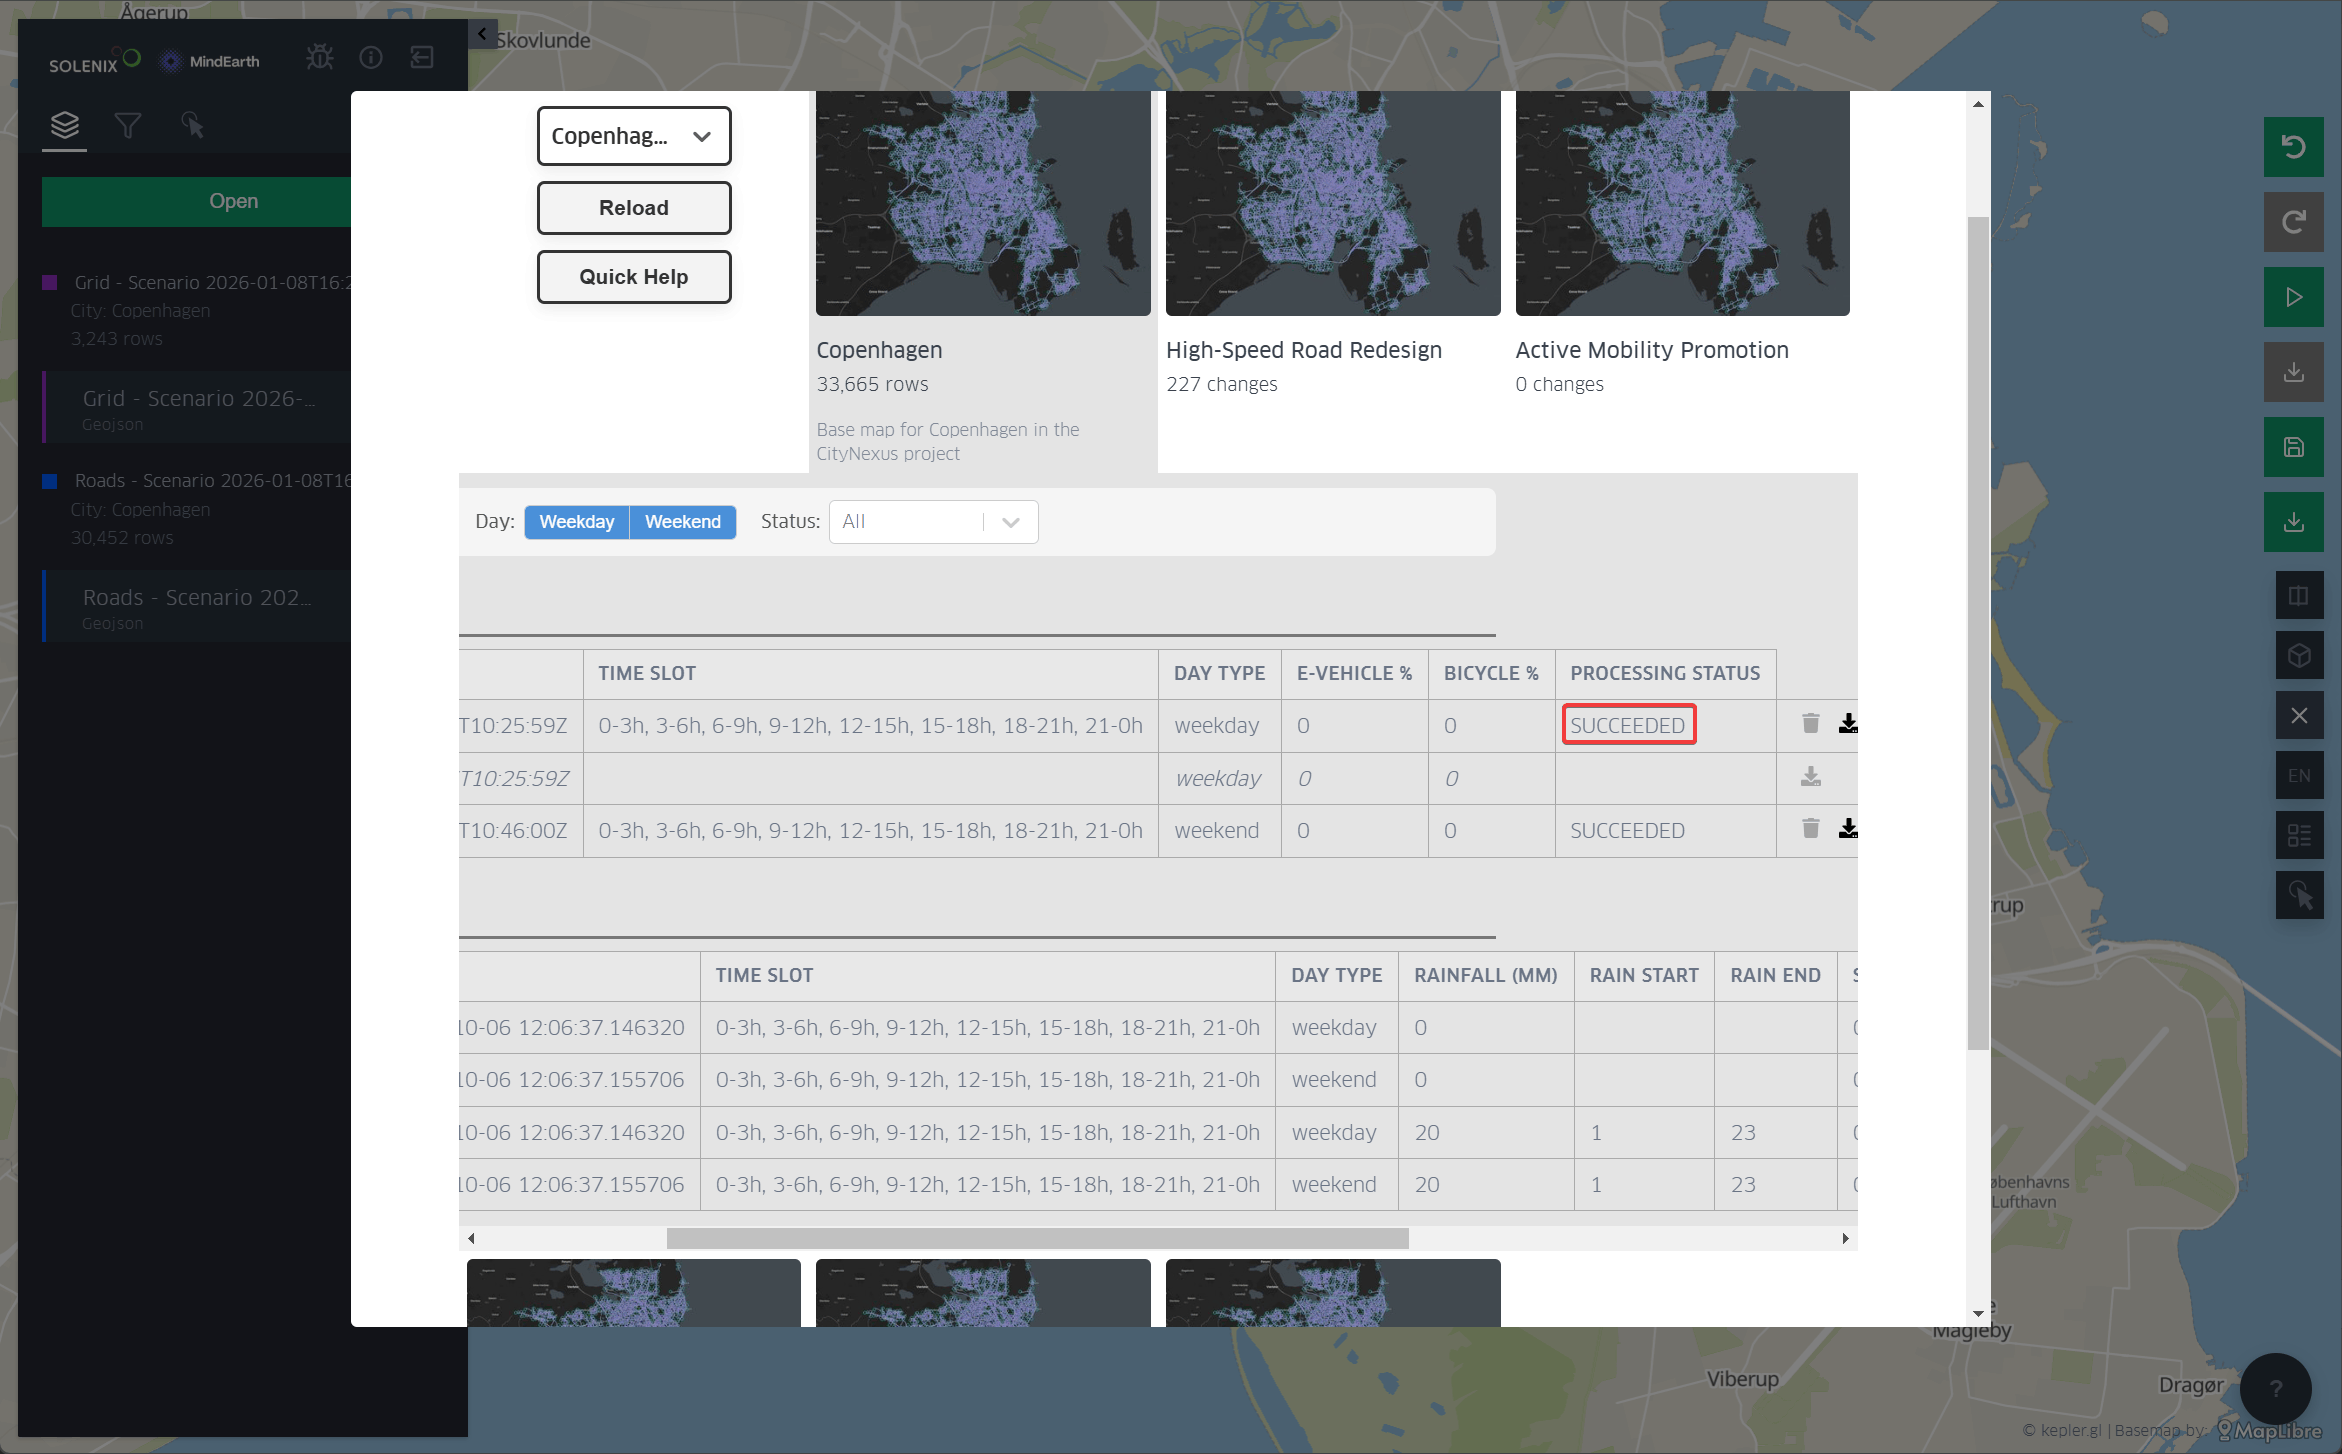
Figure 20 Results and status of a Simulation
Simulations are saved in the user workspace when available. Simulation in Figure 12 for instance shows forecast NO2 pollution values, calculated at a time slot around 03:00 on a weekend.
In this demonstration version, only one simulation per user per city is allowed to run in parallel. Simulations on different cities can be run in parallel, up to a maximum of 8 parallel simulations. A message informs when this limit is exceeded, in this case the simulation has to be started later when the system is less overloaded.