Workspace Management
To start interacting with CITYNEXUS PRO, the user has to log in on the DestinE platform. Once logged in, the user is redirected to the Workspace Management & User Interface (Figure 2).
The workspace hosts the scenarios and simulations for the four demonstration cities, for each city the user will find:
The city baseline map: this is the baseline conditions for the city, without any intervention defined.
Pre-defined scenarios for the what-if analysis (see section What-If Analysis with CITYNEXUS PRO).
Scenario’s Simulation results: model predictions for subsequent analysis and visual inspection.
In the top left corner of the gallery a dropdown menu can be used to select the city of interest, filter scenarios and predictions accordingly. Several options are available for the user to interact with the data. The button “Load Scenario” allows to visualize the scenario properties and parameters to change. The button “Show Results” allows to view the simulation outcomes, or predictions. There is also the possibility to “Delete Scenario”, however this option is only available for scenarios created by the user.
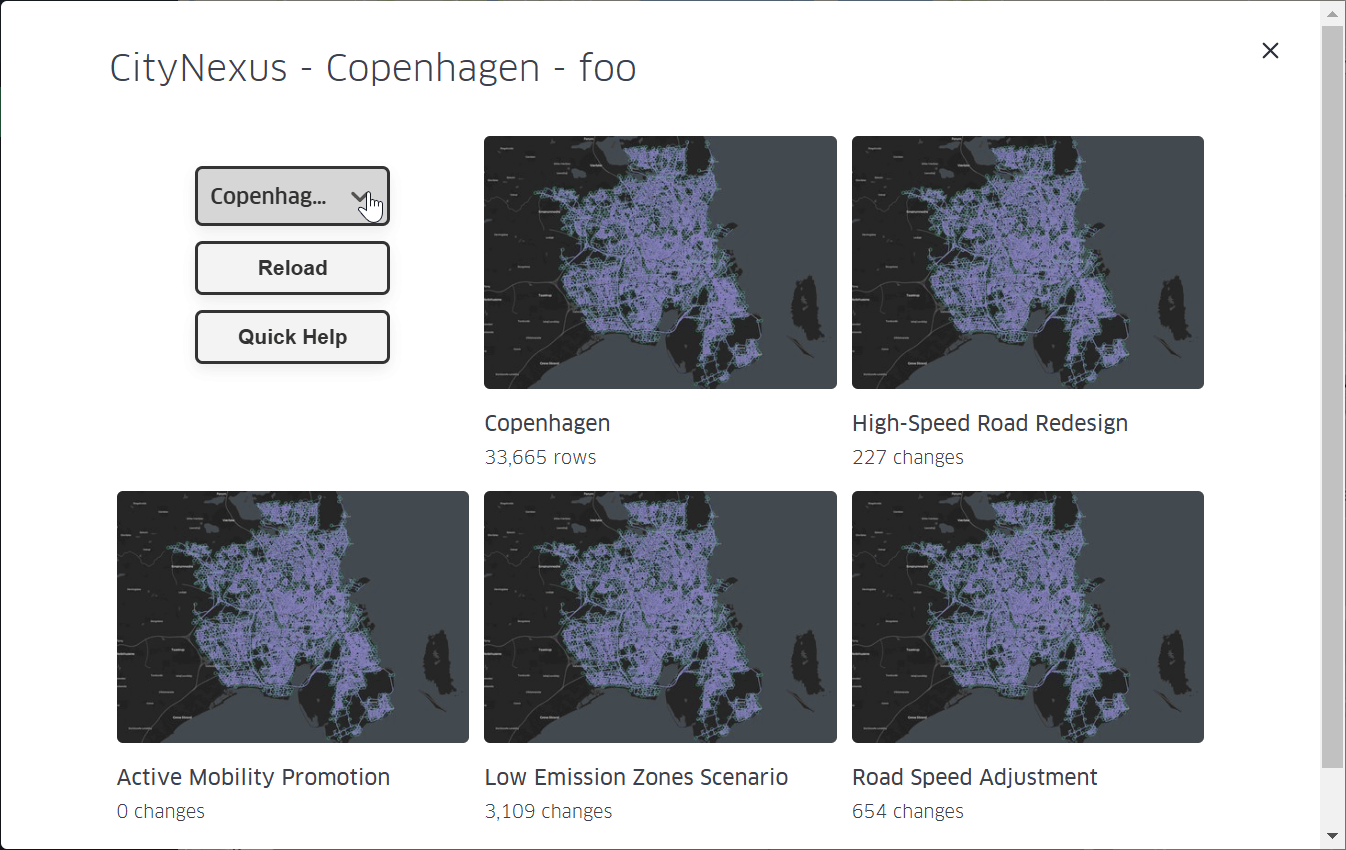
Figure 2 Scenario Selection
The Quick Help button can be clicked to display a tutorial (see Figure 3) that shows the user, step-by-step, how to use the User Interface of CITYNEXUS PRO.
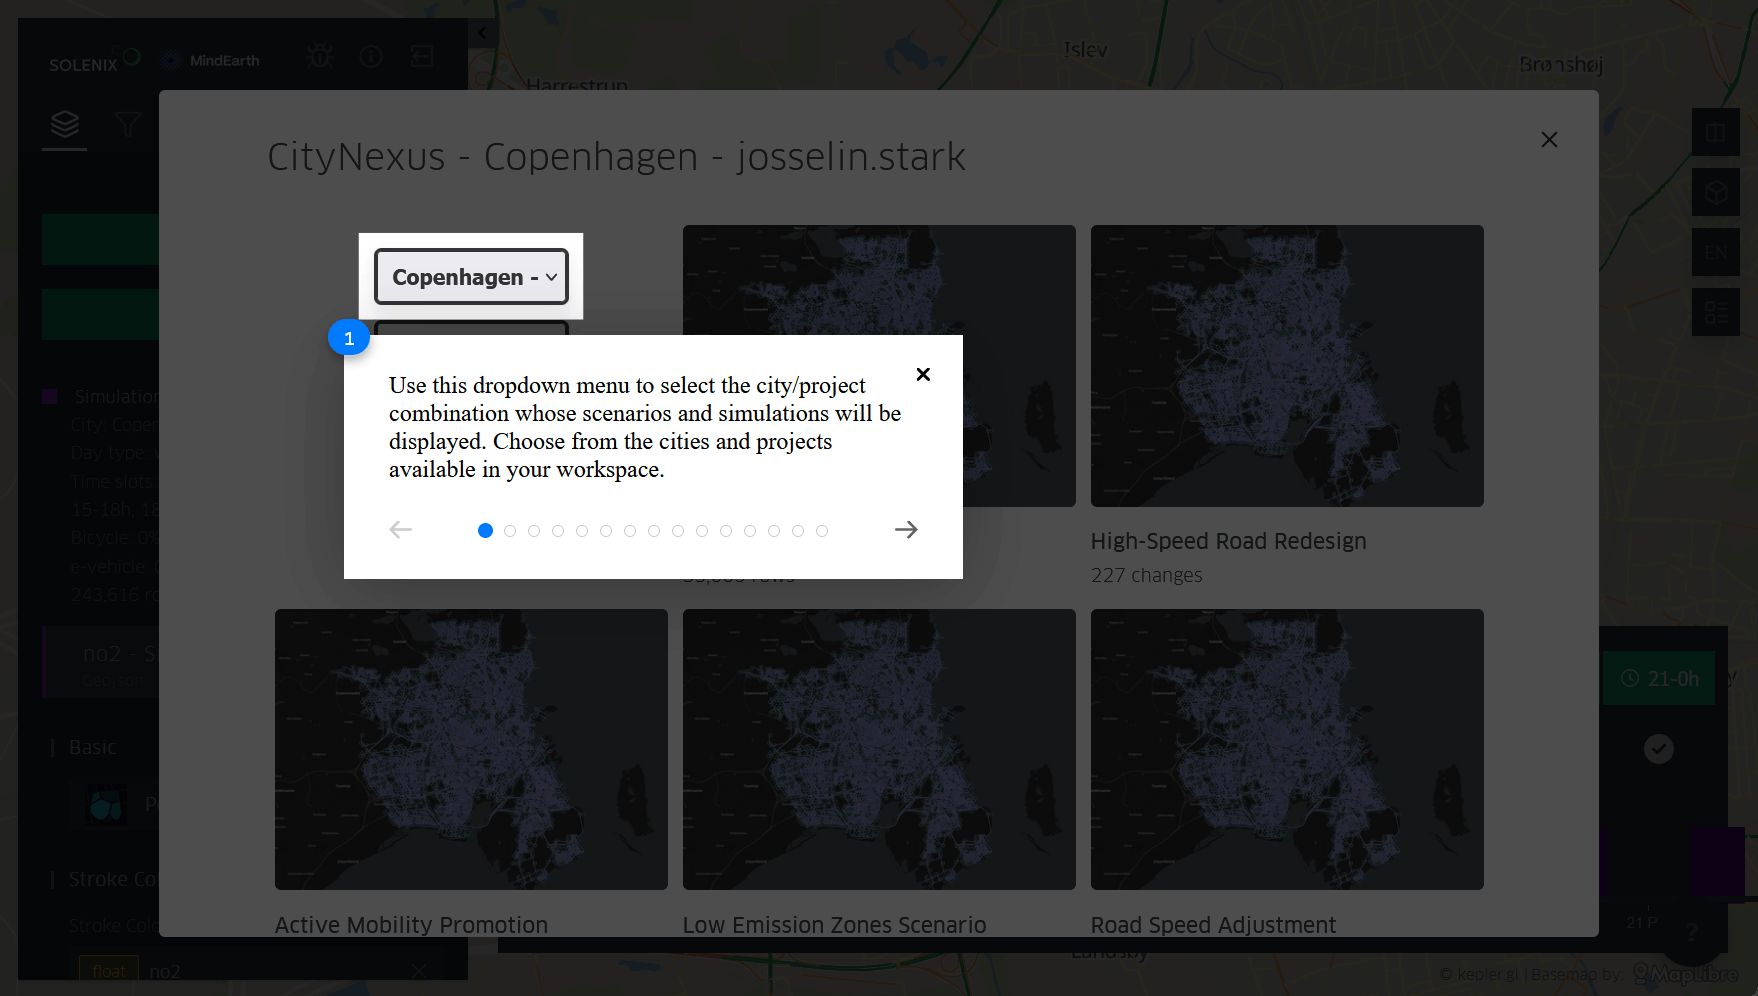
Figure 3 Quick Help tutorial.
A “Reload” button is also available to reload the scenarios and predictions. If needed, this can be useful to update the processing status of pending simulations.
The simulation results are displayed in a table shown by clicking on the “Show Results” button on a scenario. The table indicates the conditions defined for the simulation, such as whether it was set for specific hours or for the entire day, for weekdays or weekends, and the percentage of each vehicle type.
Simulations results can be filtered to make it easier for the user to select the simulation they are interested in. The user can filter by timeslot, processing status, weekday or weekend.
The table also allows the user to delete or download existing simulations.
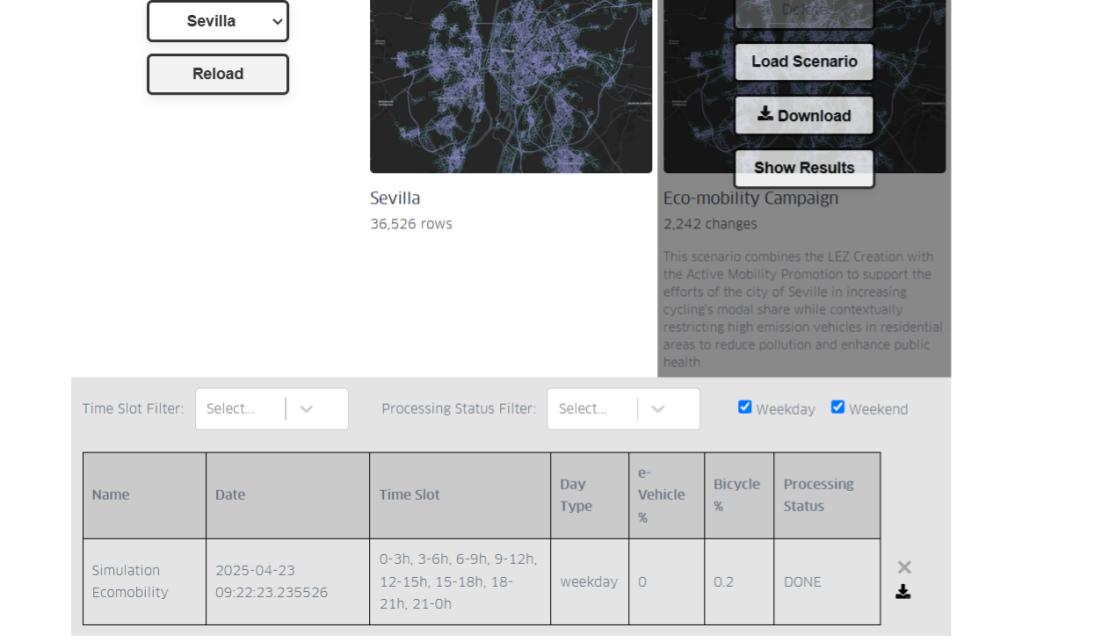
Figure 4 Simulation results
When a simulation is selected, a window will pop up allowing the user to configure the visualization of the simulation. Here, the user can select which parameters they want to display. Each selected parameter will be displayed in its own visualization layer. The user can also select the dataset from which the chosen parameters will be visualized. This allows the user to view the same parameter for one or multiple scenarios. Once all parameters are selected, the user must click ‘Configure’ to load them onto the map.
If the user wants to keep the default visualization settings, they can simply click ‘Cancel’ or close the window.
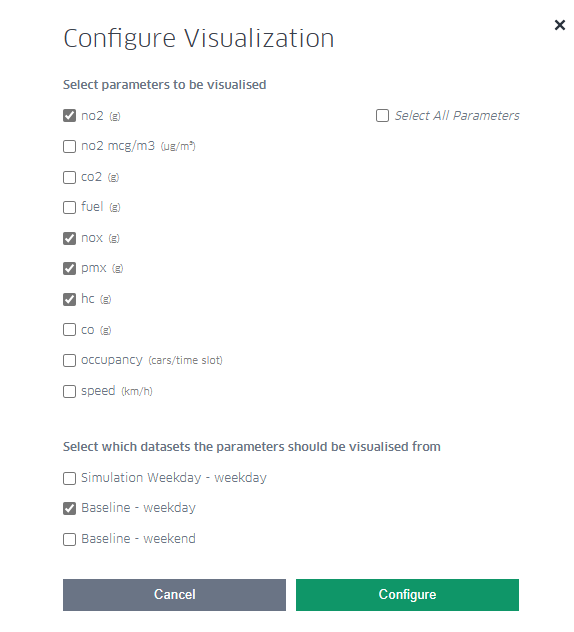
Figure 5 Simulation visualization settings
The output of a simulation provides pollutants concentration, mobility statistics and flood risk information.
The following pollutants are simulated (total production per road segment in a time slot of 3h):
NO₂, Nitrogen dioxide (provided in grams and in micrograms per cubic meter, a mass concentration unit, often used by environmental protection agencies to set regulatory limits). NO₂ is a major air pollutant with significant implications for human health and the environment. It contributes to the formation of tropospheric ozone (smog), it is a precursor to acid rain and it plays a role in the formation of fine particulate matter (PM2.5).
CO₂, Carbon dioxide (provided in grams), is a key greenhouse gas and a critical component of the carbon cycle. CO₂ traps heat in Earth’s atmosphere, contributing to global warming. Dissolved in water contributes to ocean acidification, lowering ocean pH and affecting marine life. It is a major driver for climate regulation.
NOₓ, Nitrogen Oxides (provided in grams). NOₓ gases are formed mostly during high-temperature combustion processes, like those in engines, power plants, and industrial boilers. NOₓ have major environmental and health impact, contribute to ground-level ozone (smog) formation, they are precursor to fine particulate matter (PM2.5) and affect ecosystems and vegetation by nutrient overload (eutrophication).
PMₓ, Particulate Matter (provide in grams), a crucial component in air pollution studies. PMₓ are linked to respiratory diseases, cardiovascular issues, and premature death. Major sources of PMₓ are: vehicle emissions, industrial activities, power plants (especially coal-fired) and constructions/demolitions.
HC, Hydrocarbons (provided in grams), organic compounds made up of hydrogen (H) and carbon (C) atoms. They are typically found in fuels, oils, and many industrial chemicals. In the context of air quality and emissions, HCs generally refers to unburned or partially burned fuel components released into the air. Health and environmental impacts of HCs include the following: some HCs, such as benzene, are carcinogenic; they may exacerbate asthma and other respiratory conditions; they react with NOₓ in sunlight to form ozone (O₃); and they contribute to smog formation.
CO, Carbon monoxide (provided in grams), a toxic gas for humans and animals. CO reduces oxygen delivery to organs and tissues, reacts in the atmosphere to form O₃ in the presence of NOₓ and sunlight and has an indirect impact on climate by affecting the atmospheric lifetime of methane and other greenhouse gases.
The following mobility related statistics are simulated, for vehicles occupying a road segment in a time slot (3h):
Fuel consumption: in grams (sum) per road segment
Traffic speed: average, in km/h
Occupancy: in number of vehicles passing through or stationing per time slot.
The following information is prvided when the flooding risk simulation is enabled:
Flooding level (in mm per road segment)
Average traffic speed reduction (in km/h, due to flooding disruptions)
Average road occupancy reduction (in number of vehicles passing through or stationing per time slot, due to flooding disruptions)