1. Getting Started
Welcome to VizLab. This user manual will guide you through the key features of the application. Below you can find an overview of all the main operations you can do with Vizlab at a glance.
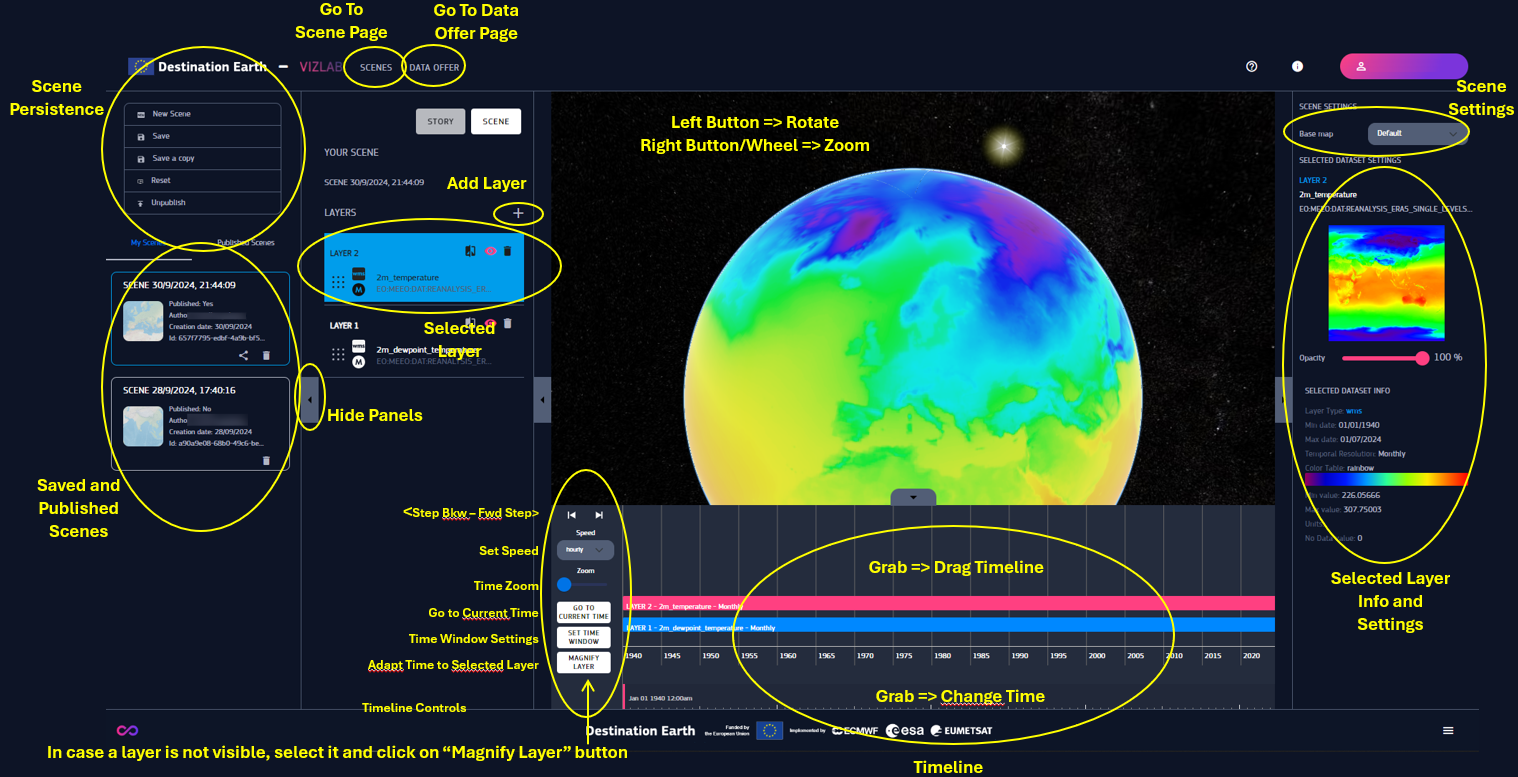
Fig. 1.1 General Vizlab Overview
What is VizLab?
Exploring Data with VizLab
Vizlab is well suited for comparing data from different sources and time frames. Its capacity for choosing color tables, setting identical min/max values across datasets, and adding time offsets allows for meaningful comparisons between heterogeneous datasets.
Creating Interactive VIZs
- VizLab enables users to build and share interactive VIZs to help illustrate complex phenomena. VIZs are designed to be accessible even to those with no prior experience and can include:
Multiple scenes: Each scene contains customizable, visually editable layers.
Diverse visualizations: Currently, layers support geodata in the form of maps, volumes, and streamlines. Users can combine data from different sources, extract specific areas, and define time intervals to enhance their storytelling at global, regional, and local scales.
Custom content: Enhance VIZs with text, images, videos, and landmarks to create engaging interactive VIZ slideshows.
Supported Data Sources
- At present, VizLab provides access to the following data sources:
EDEN: Data is directly available for scene visualization.
DCMS Cache-B: Due to its large size, data must first be extracted and stored as data cubes (spatial regions and time intervals) in the VizLab back-end before visualization.
DestinEStreamer: Retrieves pre-generated videos for visualization in the various formats available on the viewer.
MyData: Data uploaded by the user.
More visualizations and data sources will be available in the next releases!
Data Processing Limitations
The amount of data that can be processed and stored in the VizLab server is subject to certain limitations. These are detailed in the following table:
Data type |
Value |
|---|---|
Max number of scenes per user |
20 |
Max user data single upload |
99 MB |
Max number of data cube creation requests at the same time per user |
4 |
Max total storage size quota per user |
10 GB |
Expiration time for unused data |
6 months |
Max extension for volumetric data |
10x10 degrees |
Application
- Vizlab website includes two main pages. The buttons on the left of the top bar enable to switch between these sections :
HOME : the main page where most of the platform operations take place, shown by default on startup
MY SPACE : the user’s personal section
Keep reading the manual to discover more about Vizlab!