Until now, we have considered the application as a tool to view layers in a scene. These scenes can be populated with
content such as text, images and videos, resulting in “scenes”. Multiplle scenes together make up what is called a “VIZ”.
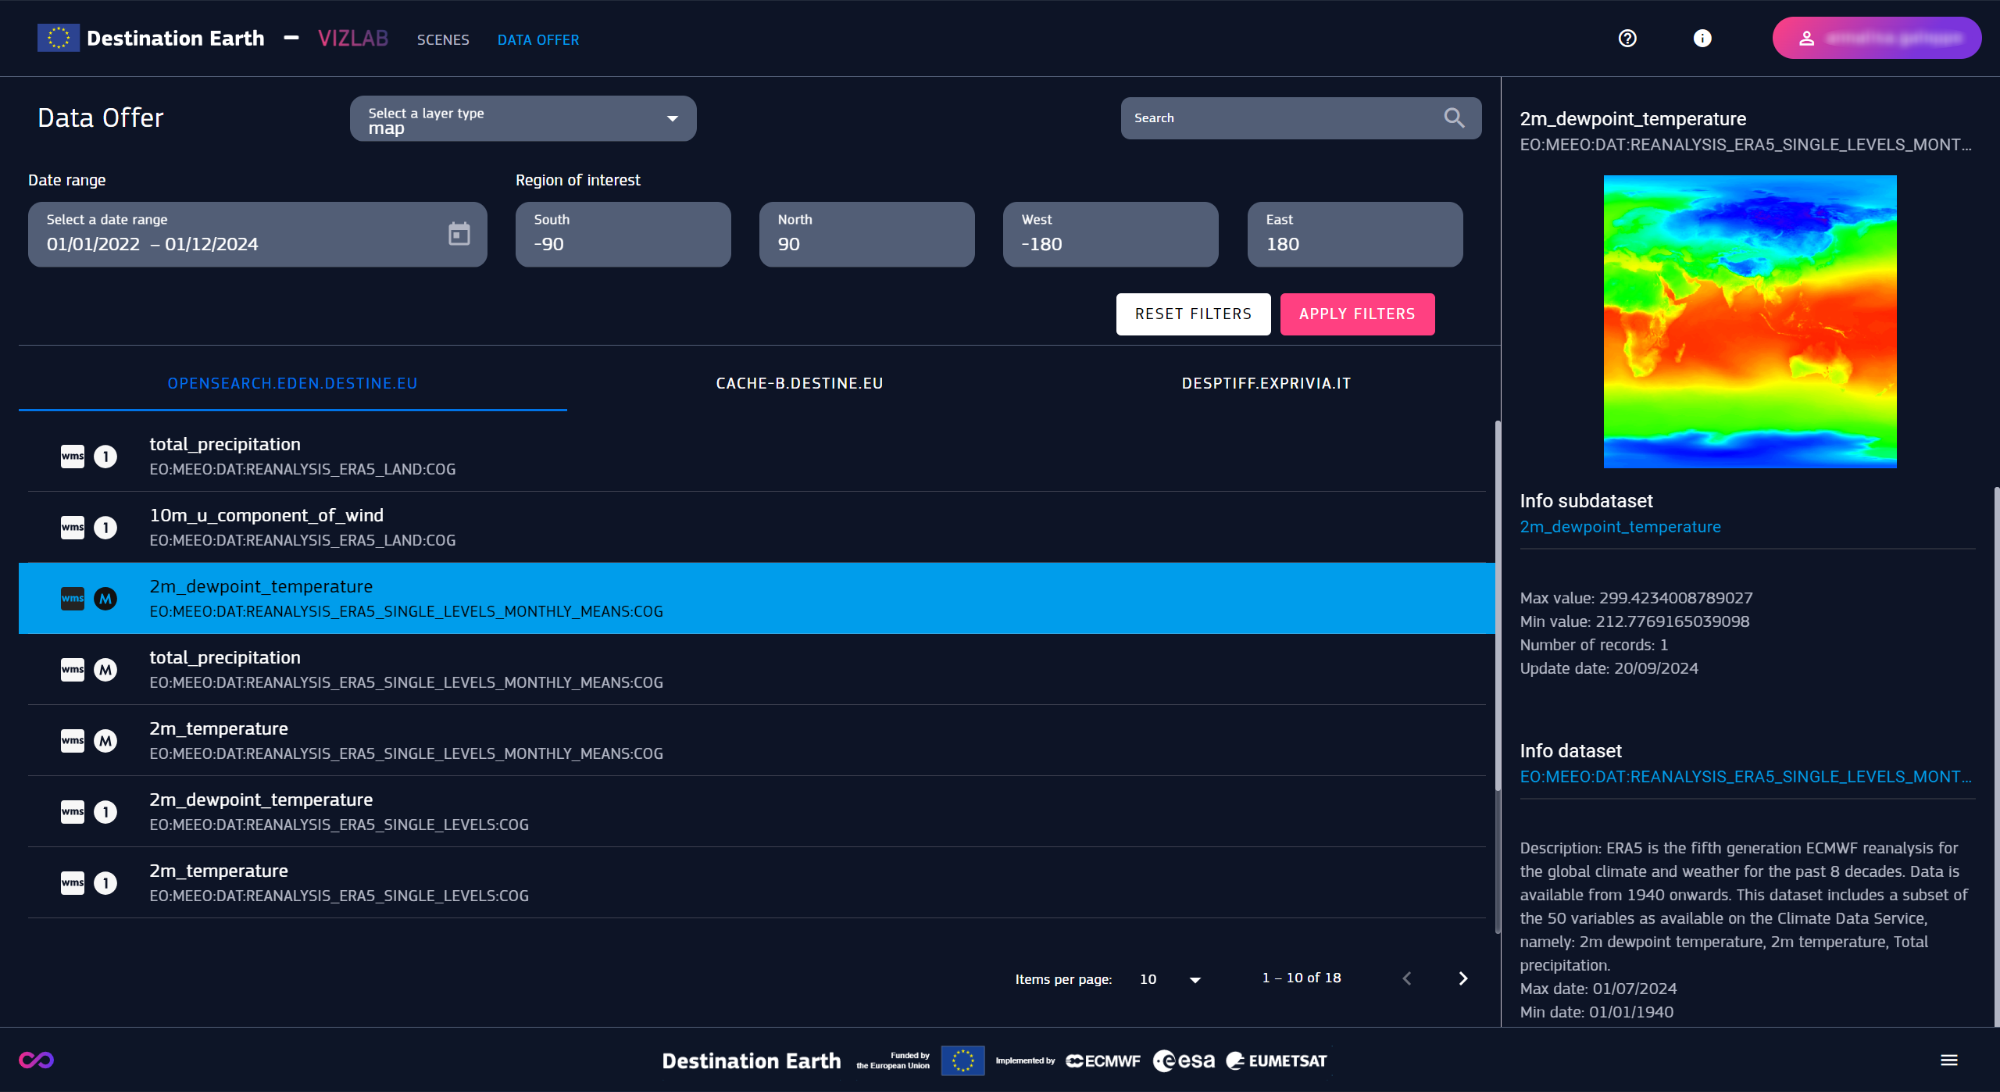
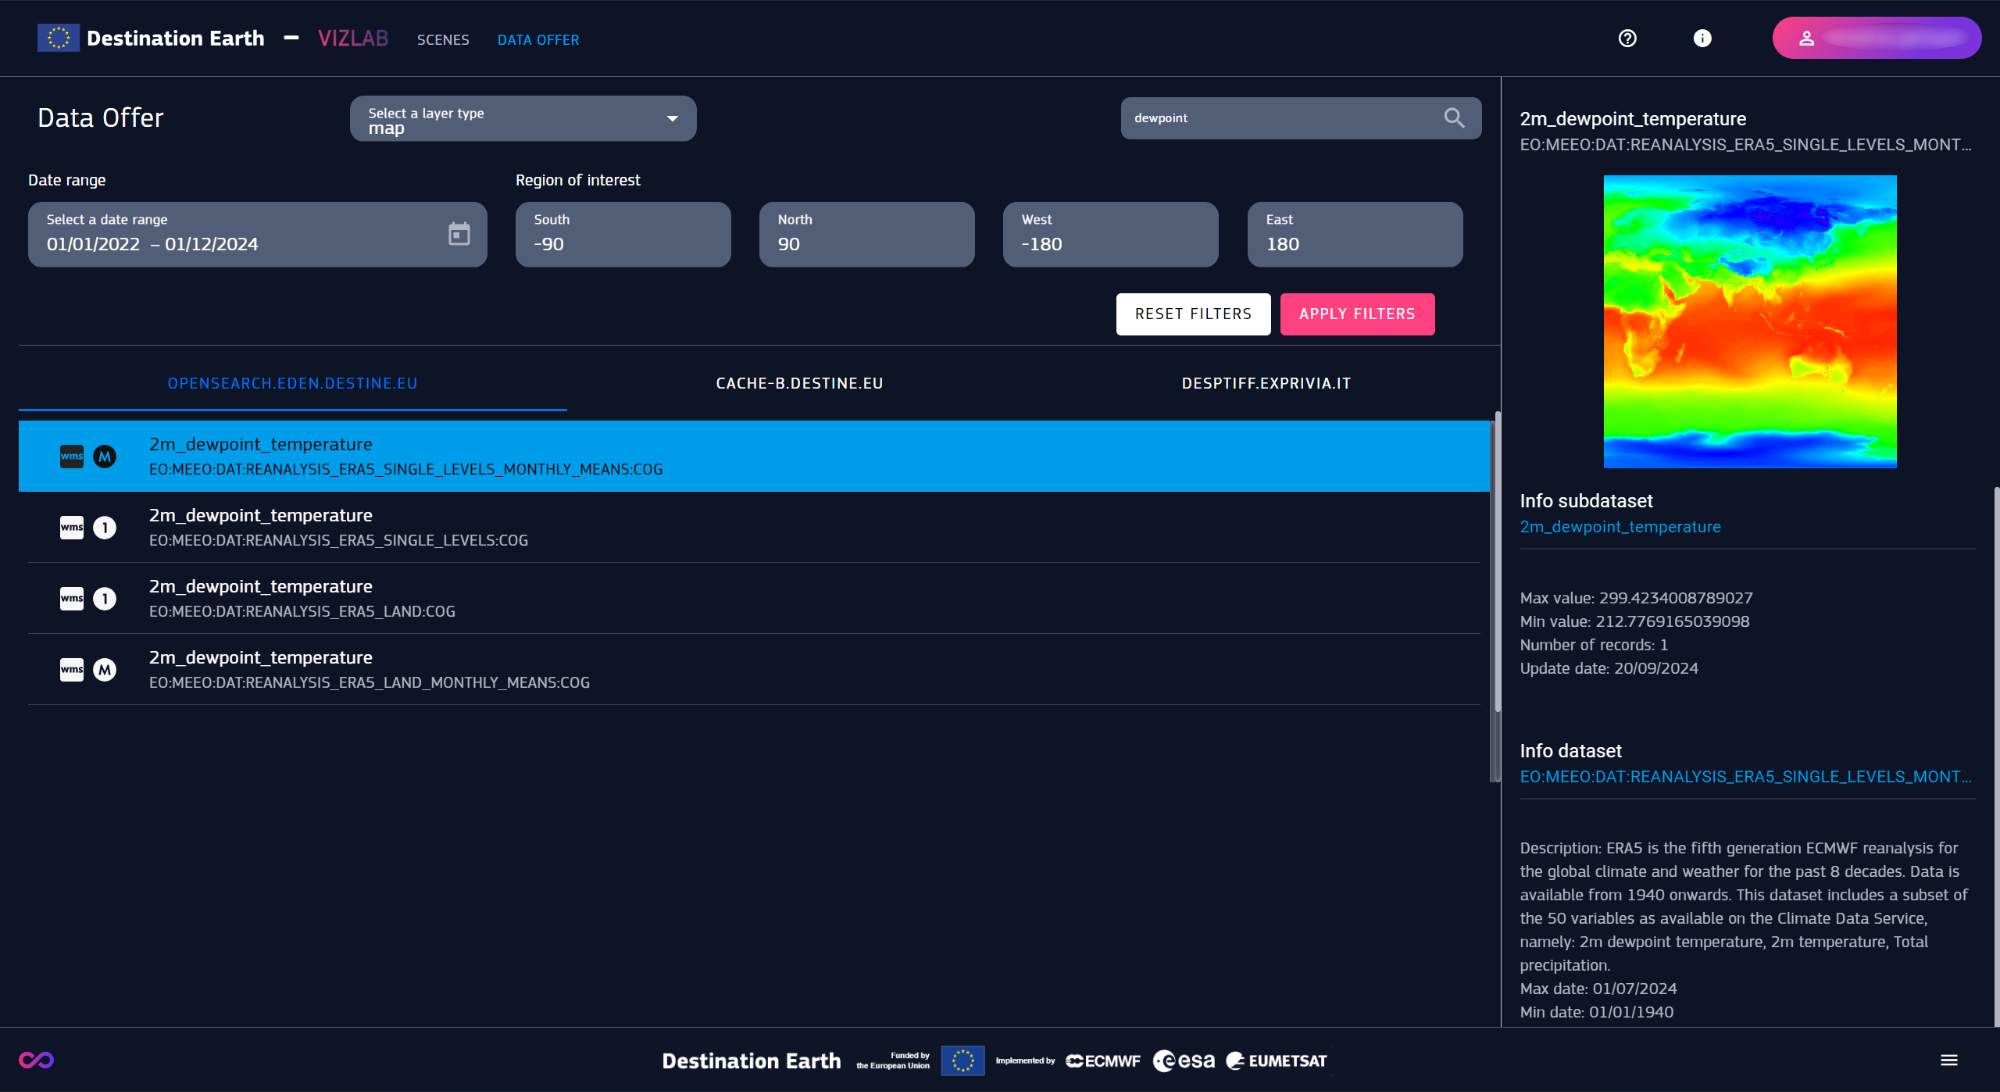
Any user can browse public stories from the dedicated panel, while the other features require registration. Selecting a VIZ opens it in the home page, to view or modify its content.
Leaving or reloading the page causes the loss of unsaved progress of the currently open VIZ.
To avoid accidental loss, each option doesn’t take effect immediately, instead, it’s asked through a panel to confirm or cancel the operation.
Confirmation panels usually shows up for most of the core operations.
Scenes feature multimedial content, similarly to presentation-type documents, to complement layers and enrich the VIZ.
They can be populated with textual and visual information, with various types of items :
Scene Overlays:
- Title
- Paragraph
- Image (Asset) | Uploaded from local device or personal Assets
- Video | Embedded through a link to the video source (at the moment only YouTube is supported for Chromium based browsers)
- Color table | Added from the application, must be related to a layer
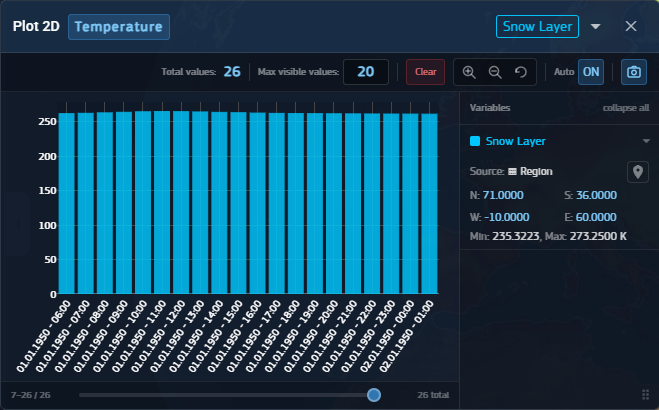
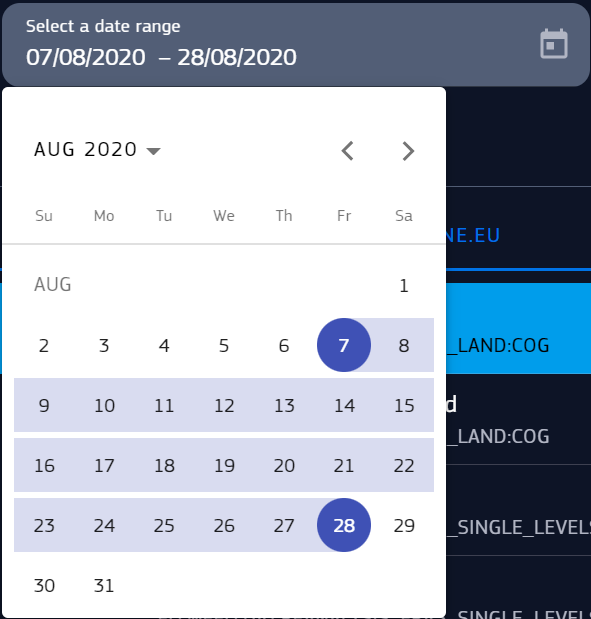
- Plot | This tool allows you to define parameters and generate charts based on specific layer and geographic coordinates or regions.
Scene Objects:
- Image Overlay (Asset) | Like asset image but placed directly on the globe
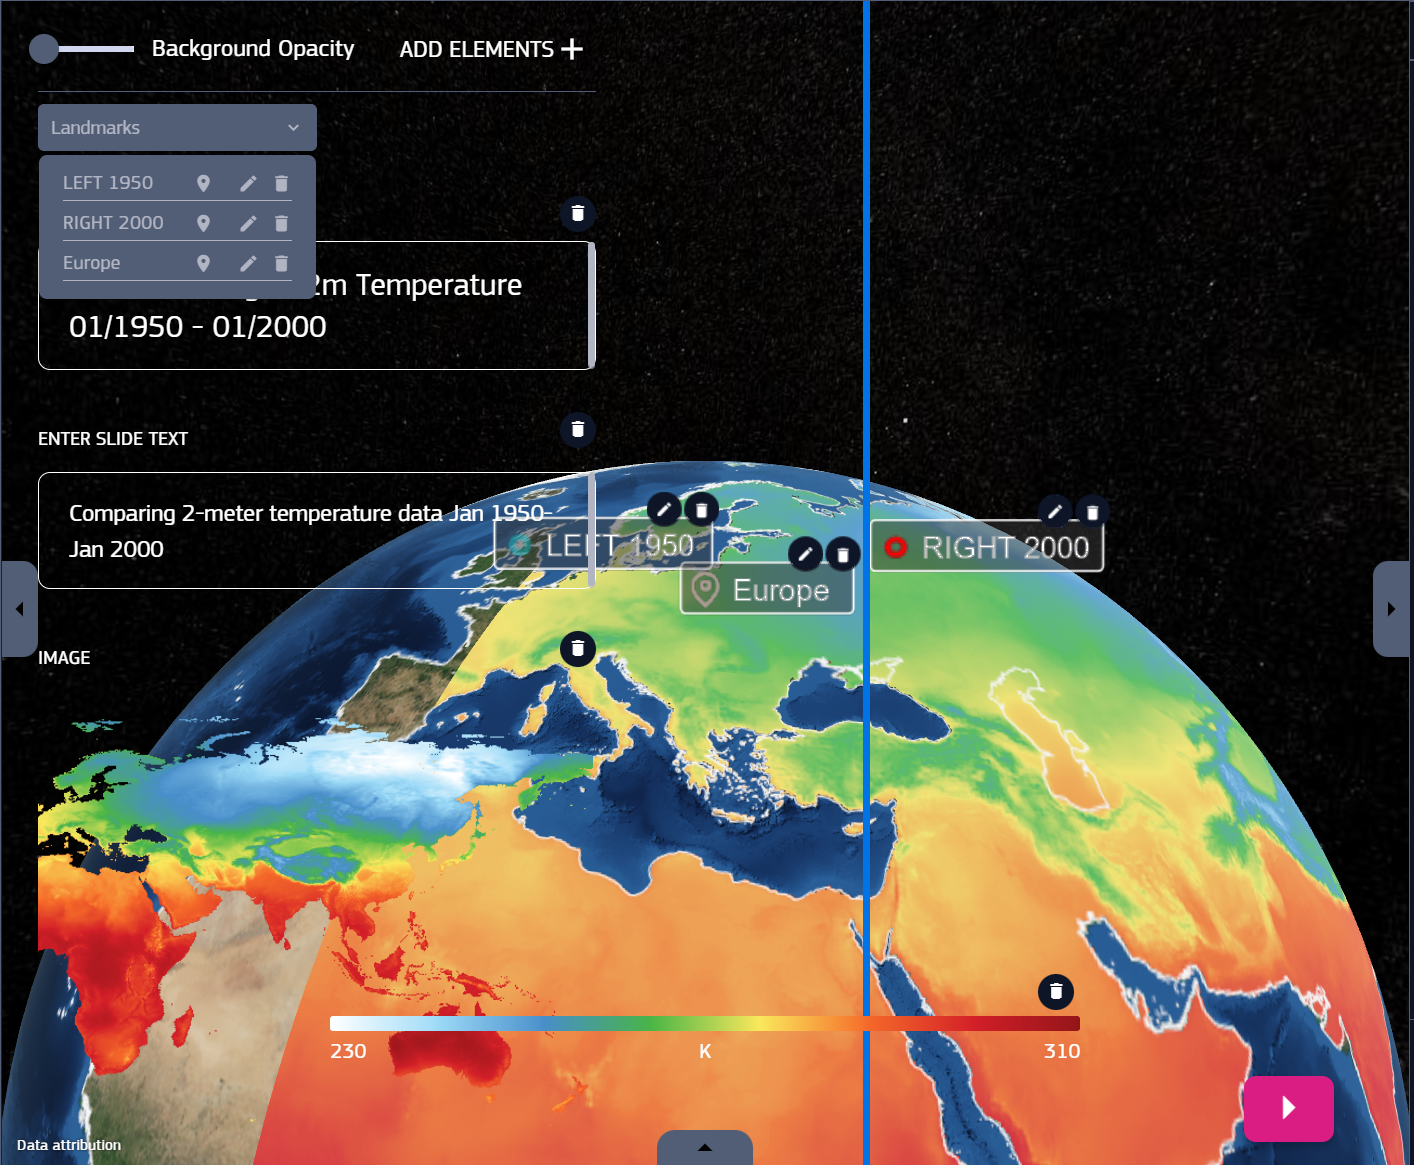
- Landmark | A labelled pinpoint placed on the globe, marking a location. Added by picking a point on the globe.
Scenes content is visible and editable on the dedicated panel on the left of the viewer.
Add Elements + shows the item types that can be added. Scenes can be duplicated with the “+” inside a double circle.
An item can be deleted by clicking its trash bin icon.
Landmarks and overlay images placed on the globe appear in their lists, visible in the scene content. They carry their own properties which can be set with the pencil-shaped icon.
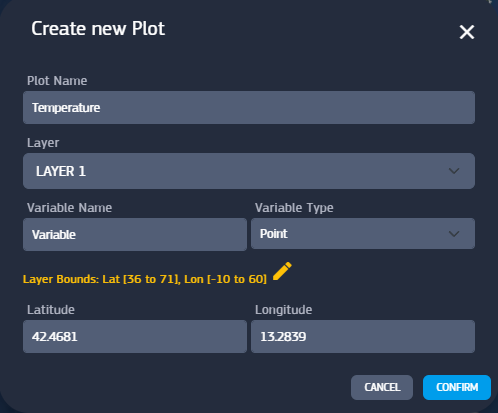
Plot Name - A custom textual identifier for your plot.
Layer - A dropdown menu to select the source layer you want to analyze (e.g., LAYER 1).
Variable Name - The specific data variable you wish to plot.
Variable Type - The spatial geometry used for the data extraction. This selection determines which coordinate fields you need to fill out.
The required coordinate inputs dynamically change based on the selected Variable Type:
Point:
Selecting this type allows you to extract data for a single geographic location. You must provide specific Latitude and Longitude values.
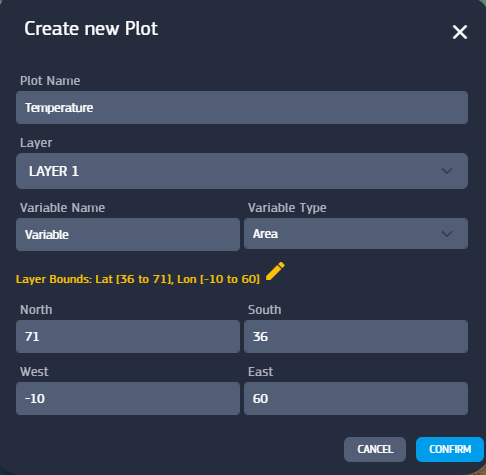
Area:
Selecting this type allows you to extract data over a designated region. You must define a bounding box by entering coordinates for North, South, West, and East.
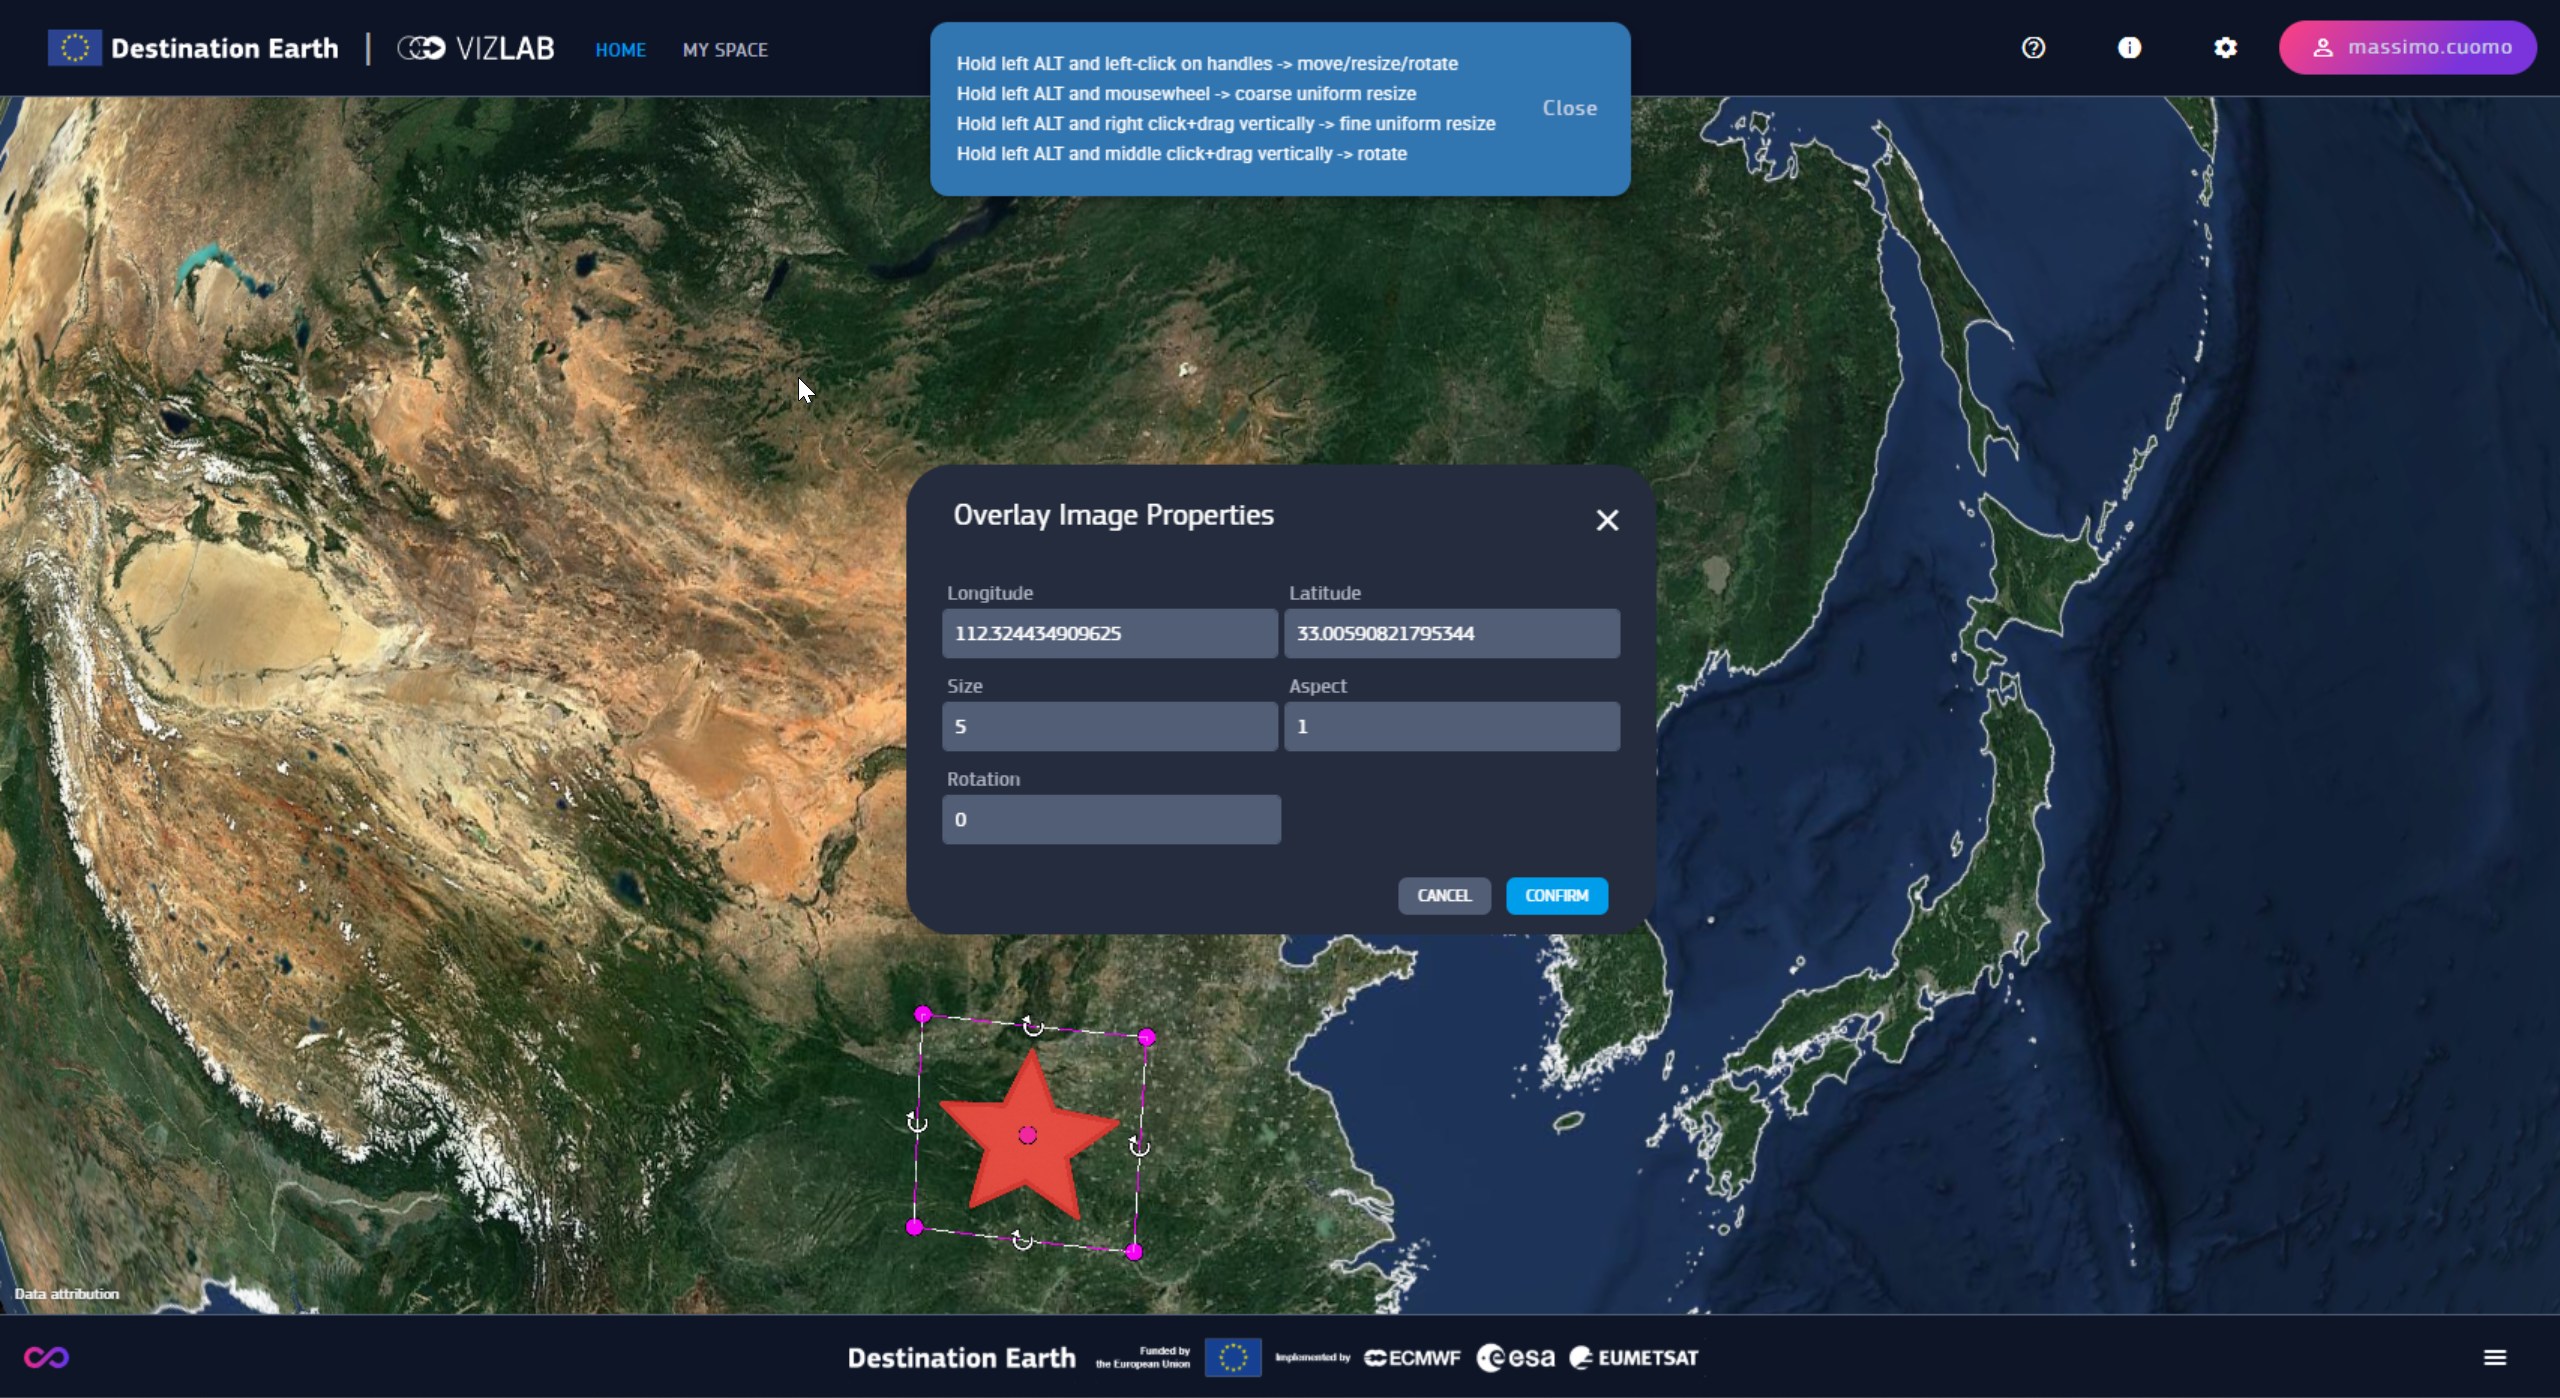
You can move overlay images by holding alt while dragging with the center handle, change size and ratio with the corner handles, or rotate them with the curved arrows. The full list of commands :
Left Alt + left click on handles –> move/resize/rotate
Left Alt + mouse wheel –> coarse uniform resize
Left Alt + right click + drag vertically –> fine uniform resize
Left Alt + middle click + drag vertically –> rotate
Alternatively you can set the properties in the box for more precise values. The arrows in the images list allow to swap them and change their order.
Currently there is a limit of one of each item type per scene, except for 3D elements (landmarks and overlay images). There can be only one between Asset Image and Url Image.
When opening the Create new Plot panel, you are required to define the following core properties:
Plot Name - A custom textual identifier for your plot.
Layer - A dropdown menu to select the source layer you want to analyze (e.g., LAYER 1).
Variable Name - The specific data variable you wish to plot.
Variable Type - The spatial geometry used for the data extraction. This selection determines which coordinate fields you need to fill out.
Scenes can be organized in their list on the left side. The buttons to add and remove them are on top of the list, and they can be reordered through drag and drop clicking on the grid icon.
The list is found in the Scenes/Layers panel, split into two columns, the left one for scenes, the right one to manage layers contained in a single scenes.
Until now we covered the topics of data exploration and visualization, which can be experienced through individual scenes, regardless their number in a VIZ.
It’s when considering VIZs as a sequence of multiple scenes, that the insights of Vizlab features take a step further. Scenes are not just a way to enrich content of the view, but they are meant to automate the visualization of their content. This automatization system it’s the core feature of Stories and takes the name of Present Mode.
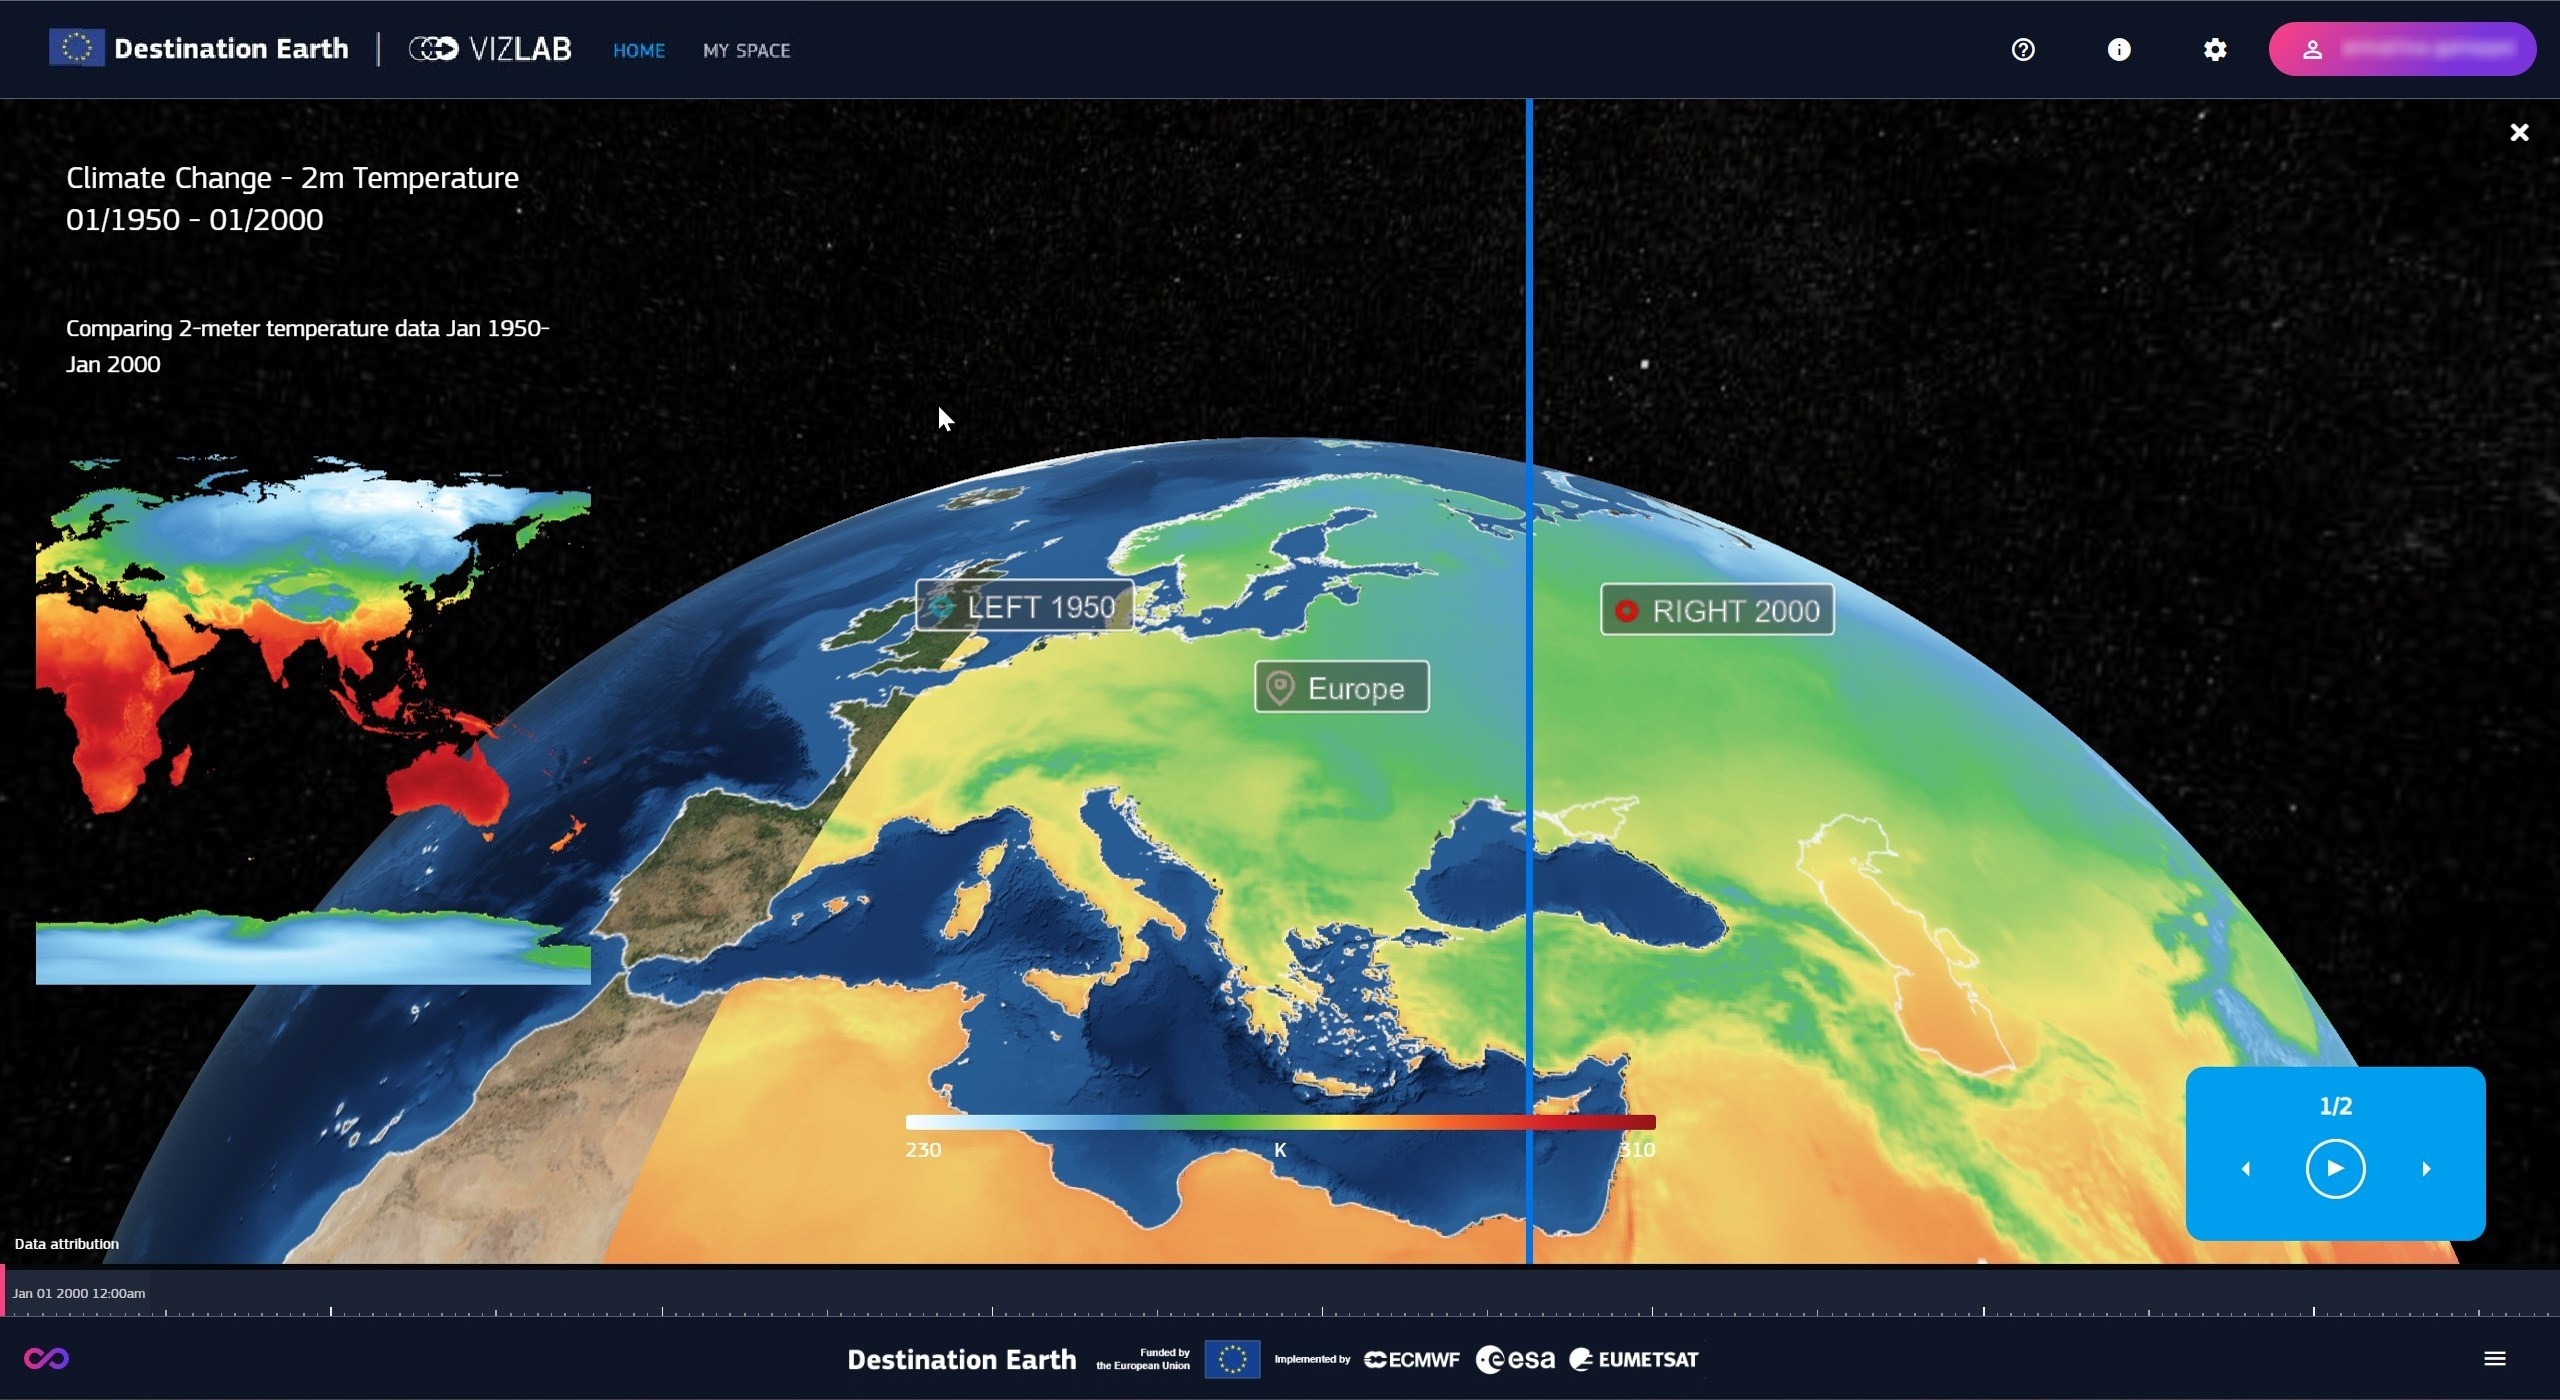
Present Mode is a playback function to reproduce stories, integrated in the 3D viewer.
Its power lies in its capability to show content over time while preserving the navigation around the 3D globe,
allowing for a look at the geospatial phenomena from different perspectives while seeing their evolution over time.
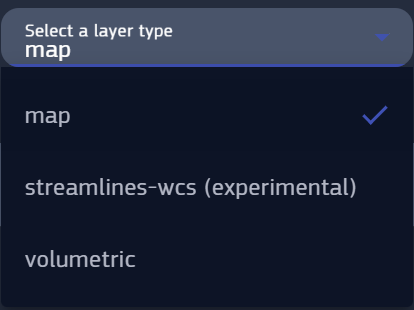
Navigation on a scene depends on its Navigation type property :
Free allows free movement with no constraints
Orbit target sets the camera orbit with the specified object as center of rotation
Blocked is the static view with no camera movement
While in present mode, most of the interface is hidden to make room for the 3D viewer and empower the experience.
Similarly to videos, VIZs can be played or stopped at any time. During play, scenes are sequentally reproduced following their order and according the scene settings.
Each scene is played along its timeline from the set Start Date to the End Date, advancing by a time interval equal to Time step. Playback smoothness is determined by Samples per Second.
Time step can be :
Hourly
Daily
Weekly
Monthly
Yearly
When moving from a scene to the next one, the camera makes a transition to the Start position (Longitude, Latitude, Elevation) of the next scene.
Additionally, scenes can be jumped to back and forth with the arrows. Jumping to another scene automatically stops the playback.
There are two types of Camera Transition in the current version :
None with an instant change of position
Fly to where the camera gradually moves from the previous to the next position.
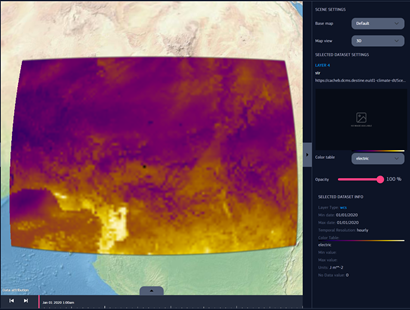
For each scene, Earth appearance can be changed by selecting the Base map, which is the image of the Earth wrapped around the 3D model.
Typically a base map is a view of the Earth taken from a satellite, or a geopolitical representation of territories. There are many base maps available from different sources.
Fig. 3.12 Base Map set to Black Marble, a nightime satellite view
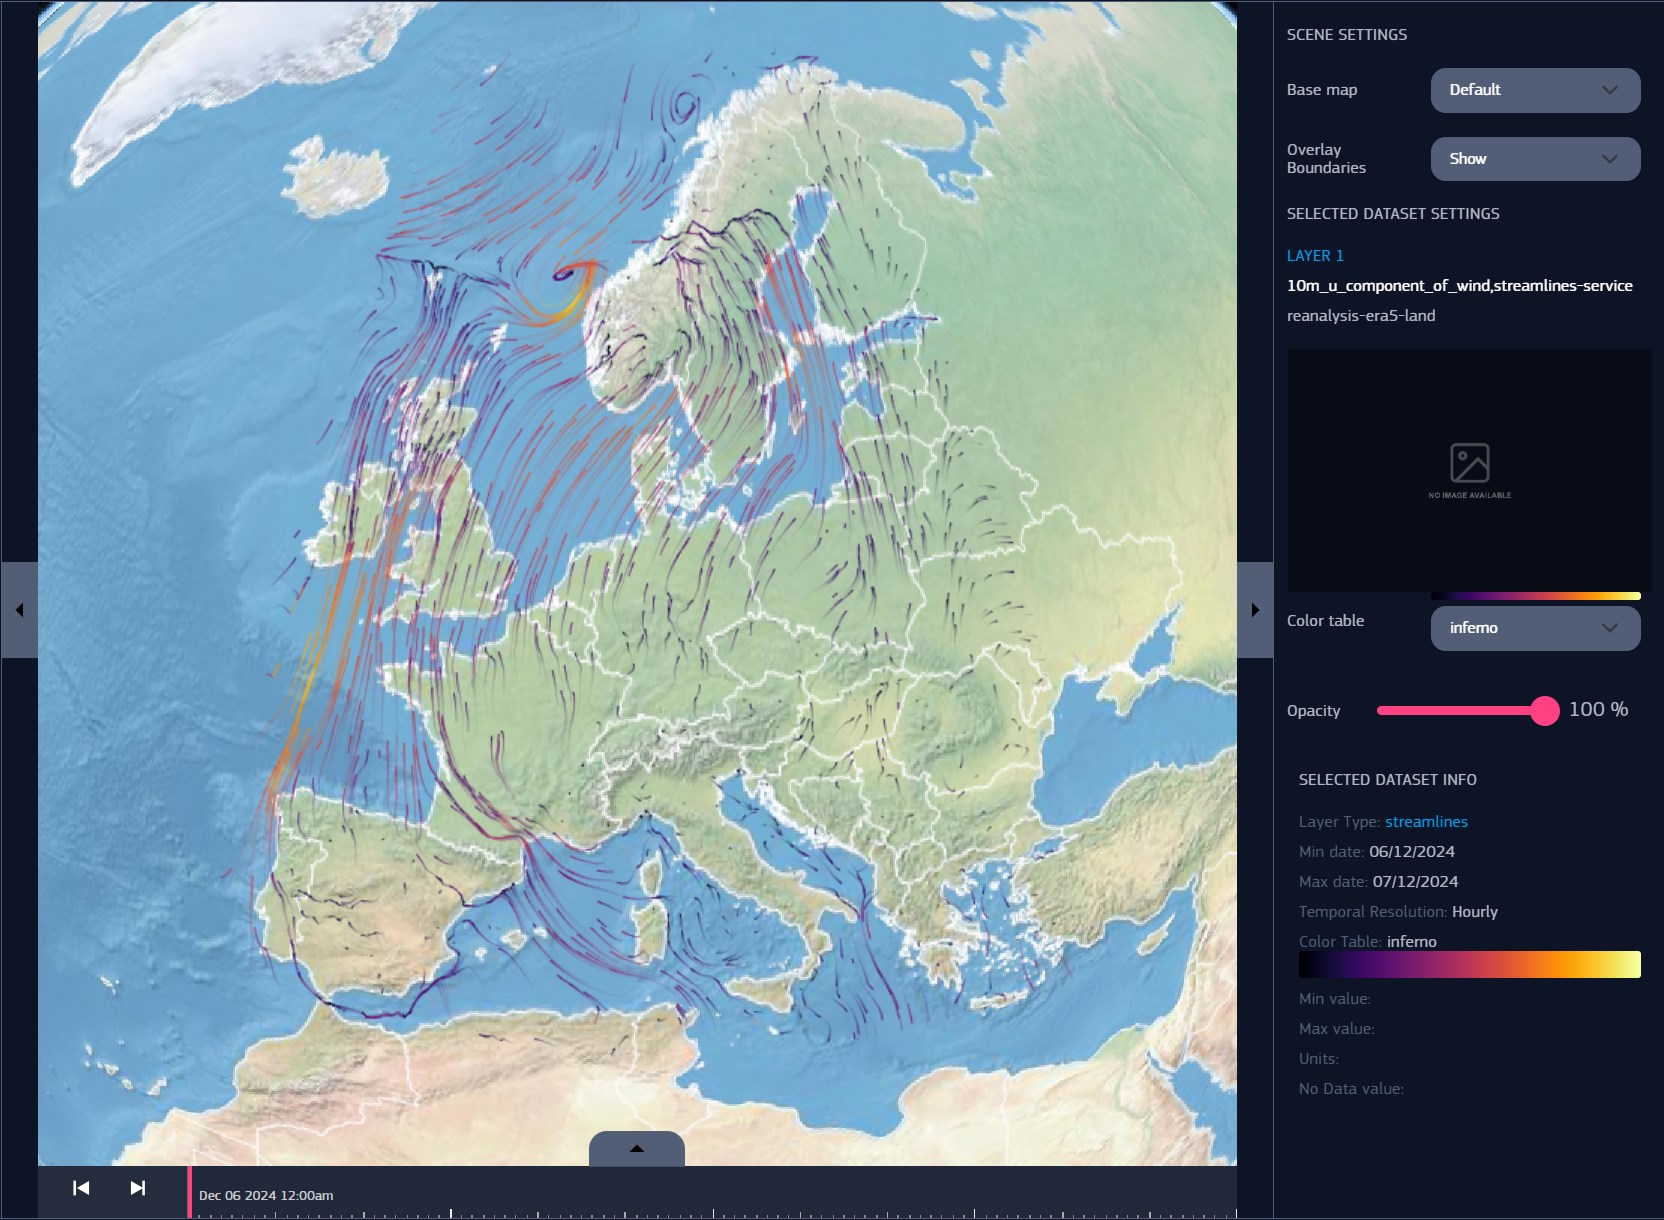
Overlay boundaries determines which boundary lines are displayed, whether it’s Coastlines, Countries, None or Both of them.
To distinguish from the “present mode”, we can refer to the edit view as “edit mode”. Camera transition works also when changing scene edit mode.
Base maps and overlay boundaries are visible either in edit or presentation mode.
The X button on the top right corner closes the present mode, returning to the edit mode.
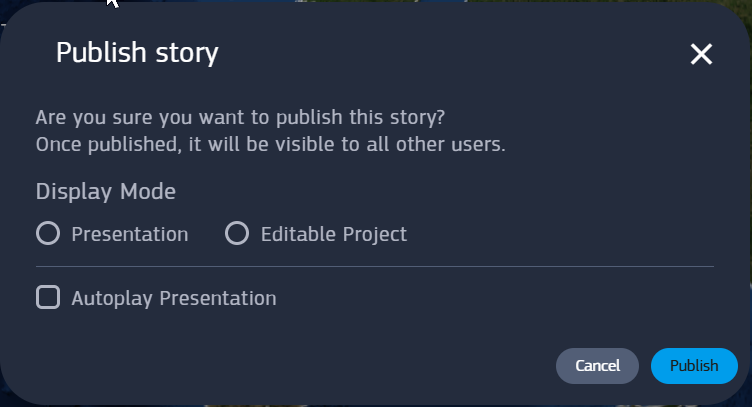
When publishing a VIZ it’s asked to choose the default display mode, and in case of presentation, whether enabling the autoplay.
VIZs opened by their author are displayed by default in edit mode, even if published in Present mode.
Public VIZs in Present mode cannot be modified by users outside the creator, as they can only view what allowed by the author.