4. Scenes page
- The Scene Page is the starting point of the application and contains five layout components:
Scene collapsible panel which allows to create, upload, download and publish scenes, as well as selecting existing scene.
Layers collapsible panel to add, remove and manage the layers to be displayed in the current view.
3D Viewer which is a viewport focused on the 3D model of the earth and allows to manipulate the camera angle and distance. This is where the layers representing the datasets are graphically rendered on the earth surface. Most of the changes made in the other panels take effect here.
Timeline collapsible panel to display data evolution over a period or at a certain time instant.
View settings collapsible panel which displays various graphic settings for the scene and the layers.
4.1. Scene panel
- This panel provides scenes related options and a list view of the existing scenes. Starting from the top, the available options are the following:
New Scene
Save
Save as
Reset
Publish

Fig. 4.1 Scene options (unauthenticated session) |

Fig. 4.2 Scene options (authenticated session) |
Save, Reset and Publish functions are available upon log in, otherwise the respective buttons are inactive and appears as greyed out.
4.1.1. New Scene
This option creates a new scene, empty from layers, with only the blank view of the Earth. Notice that all the unsaved data of the previous scene will be lost.
4.1.2. Save
Upon saving a scene, the changes are stored the back-end. When working on a new scene, this is added to the list of personal ones. Attempting to leave the page with unsaved changes prompts the opening of a warning panel with a message. As described in the message, confirming and leaving the page will cause the loss of all unsaved progress.
4.1.3. Save as
It’s possible to save a scene choosing a specific name with this option. Provided a different name than the one of the current scene, the progress are saved into a new scene, without overwriting the current one.
4.1.4. Reset
This function undoes any unsaved progress on a scene and reverts to its last saved state. Upon clicking this option, a modal panel warns about the loss of data in case of confirmation. Note: Reset is similar to New Scene. The only difference is that the latter will additionally open a new empty scene after resetting the progress of the current one.

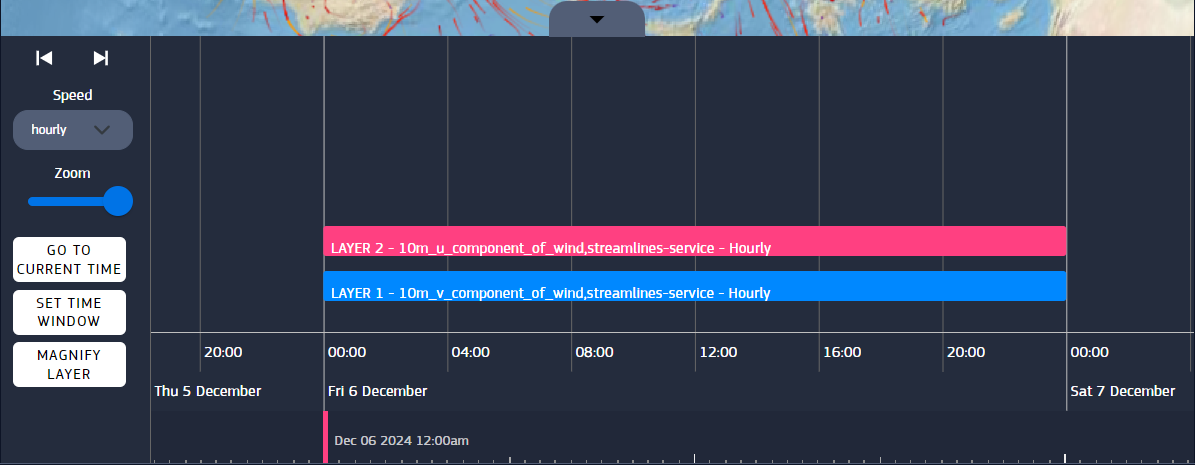
Fig. 4.3 Reset scene modal panel
4.1.5. Publish/Unpublish
When a scene is published, its added to the public scene list on the server and it becomes visible and available to other users. Like other options, the effects of this operation are described in the warning panel, which can be confirmed or canceled. A scene can be removed from the public domain by unpublishing it. Only the owner can publish or unpublish a scene. Both options are acessible through the same button, which switches between the two, depending on the publishing status of the scene.

Fig. 4.4 Publish show modal panel
4.1.6. Scenes list
Below the scene options you find the list of saved scenes. You can switch between My Scenes and Published Scenes, to view, respectively, the scenes saved to your account and the ones shared publicly.
4.1.7. My Scenes

Fig. 4.5 My scenes list
In this list you can see your scenes preview and whether they are public or not on the “Published” label. The trash iconed button is made to delete the scene. Clicking on the scene card loads the scene in the 3D viewer, making it available for any modification. The scene can be shared through the specific button, which copies the url to the clipboard. NOTE : the maximum number of saved scene in the same account is capped at an amount listed in the table in chapter 1 (“Getting Started”).

Fig. 4.6 Private scene in edit mode
4.1.8. Published scenes
Here are displayed all the public scenes. Like in “Your Scenes”, it’s possible to click on the scene card to have it loaded on the canvas in view mode. Anyone can share it, but only the owner can directly edit or delete the scene. It’s still possible to save a copy of it in the personal account to make any changes.

Fig. 4.7 Public scene list

Fig. 4.8 Public scene in view mode
4.2. Layers panel
Adding and managing layers to the scene can be done through this panel.
4.2.1. Scene name
Located at the top of the panel is the name of the currently open scene under “Your Scene”. When a new scene is created, the default name is [“Scene” + the date and time of the creation]. The name can be changed by clicking on the label, which is replaced by a textbox to prompt the new name.

Fig. 4.9 Top section of layer panel |
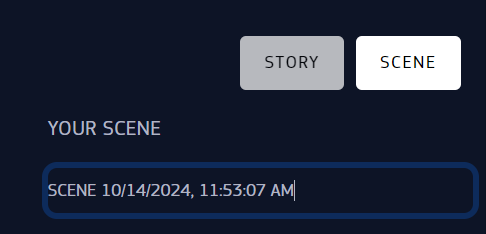
Fig. 4.10 Scene name in edit mode |
4.2.2. Layer addition
Below the top area of the panel, the UI provides the ‘+’ button for the layer addition. Clicking on it prompts the opening of the data offer view as a modal window, to choose among the data.

Fig. 4.11 Layer add option
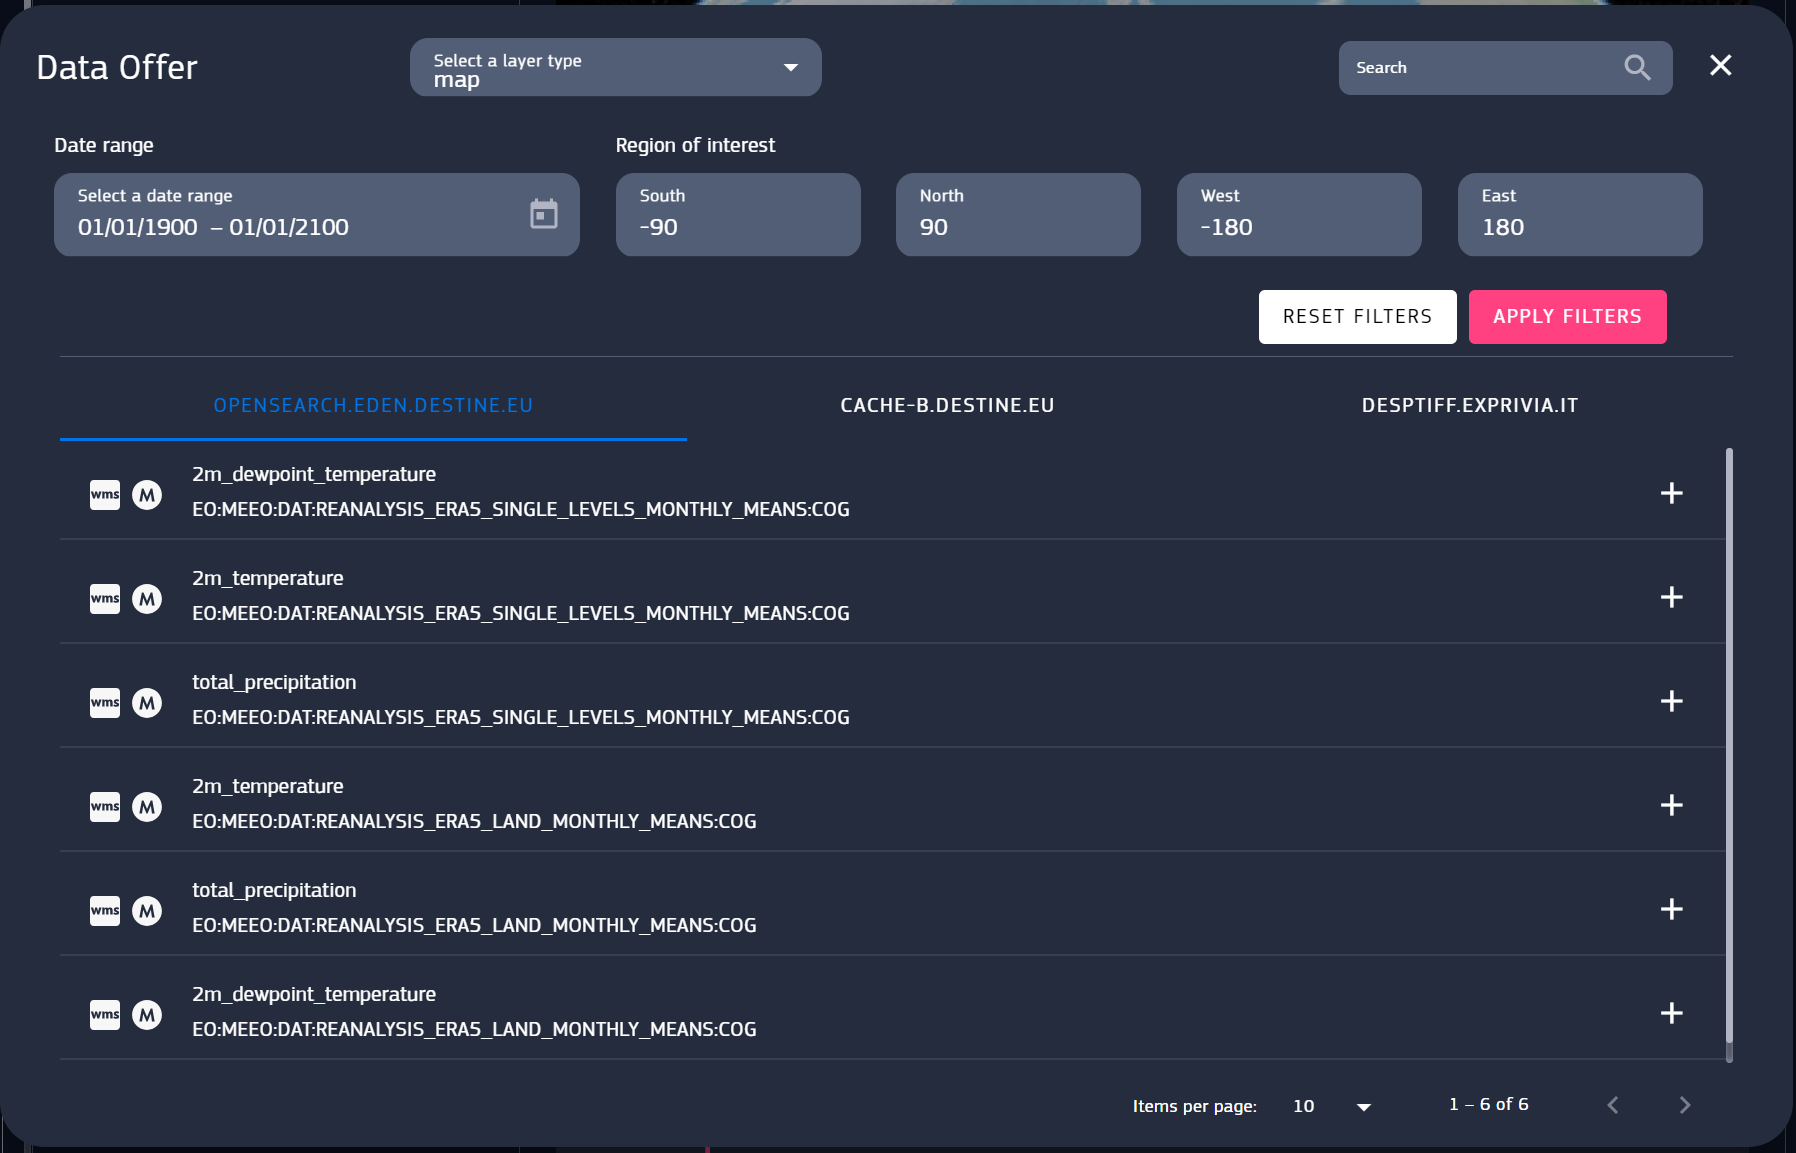
Fig. 4.12 Data offer Panel
This view is essentially equivalent to the data offer page, with the main difference being the presence of the ‘+’ button at the left side of each entry in the list. As previously mentioned, datasets from “CACHE-B DESTINE.EU” source may be big in size, and the extraction process they have to pass through before being viewed might be long. (See chapter 5, “DCMS Cache-B Data Access” for further insights). Each dataset entry includes the name, the source, the type and the time resolution. Time resolution is one of the following: 1H (1-hourly), 3H (3-hourly), 12H (12-hourly), D (daily), W (weekly), M (monthly).
Additional details of a dataset can be viewed by clicking on the list item, which include an image preview of the dataset, if available, the dataset and the sub-dataset information. Another button provides a way back to the search.
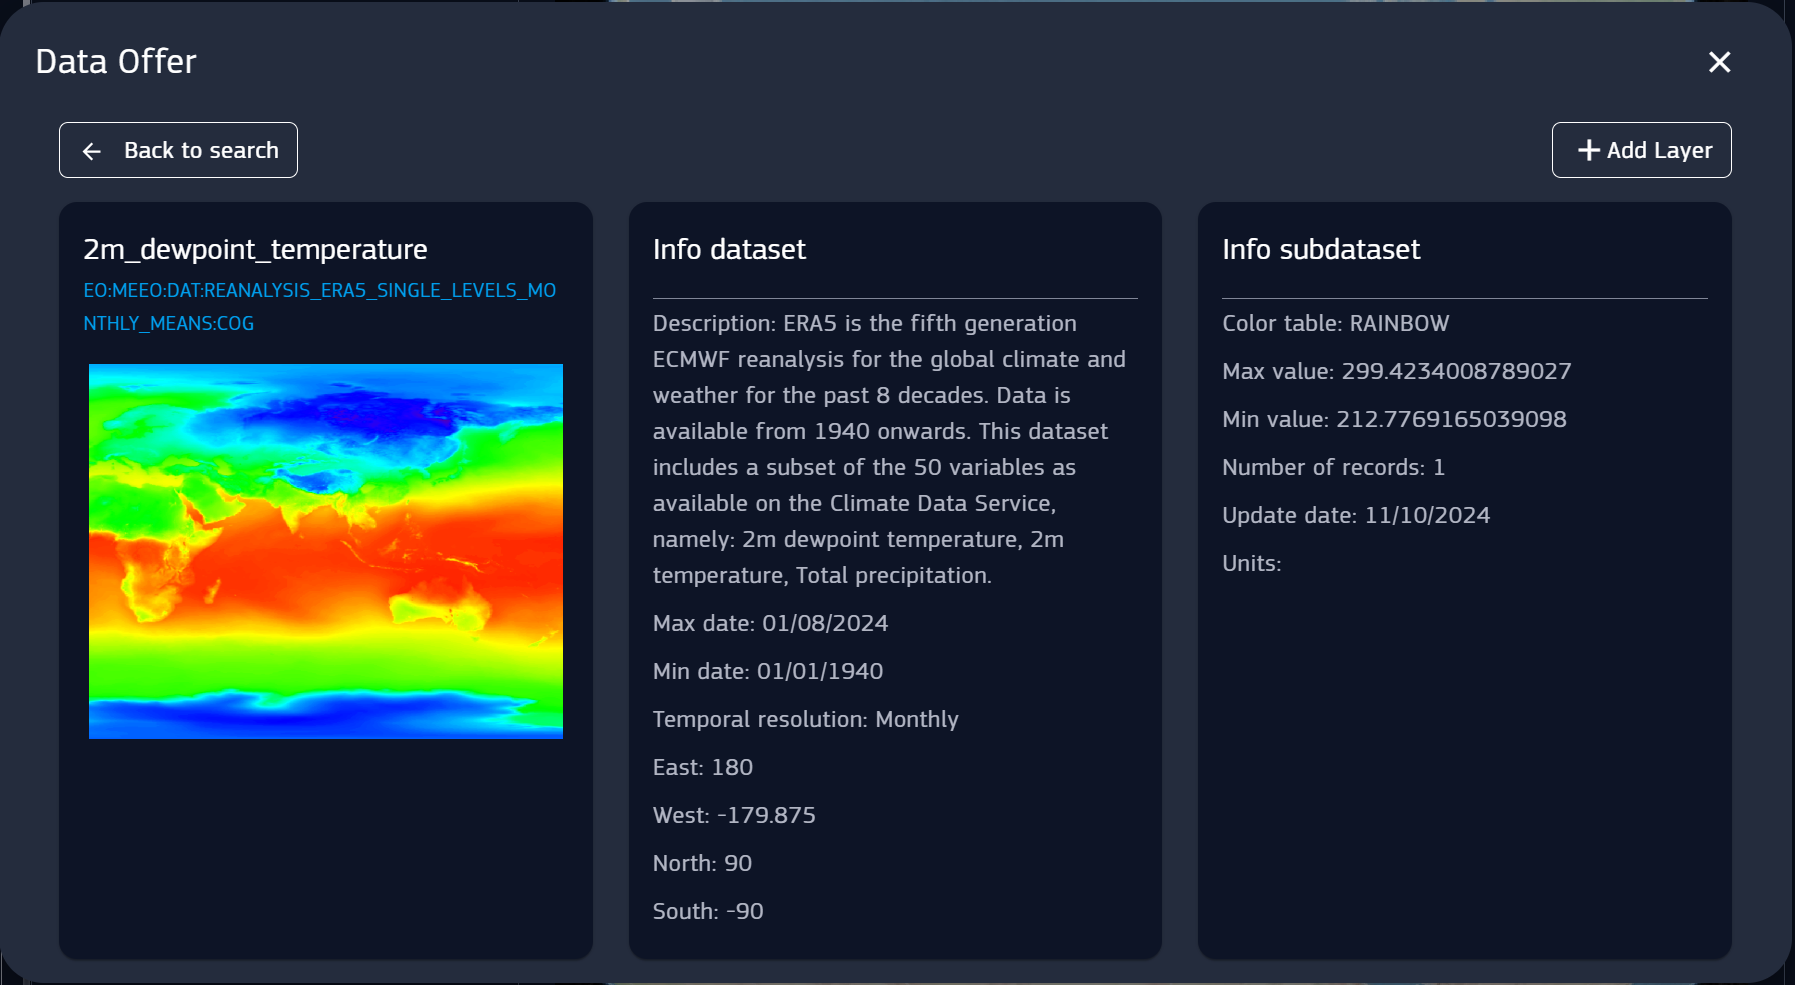
Fig. 4.13 Data Offer Panel - Dataset Info
4.2.3. Layer selection
Once a layer is added, it’s shown in the 3D viewer on top of the Earth model, with its information displayed in the list in the layer panel. Selecting a layer from this list will have effect on the timeline and the settings panels, which display some of the layer data information (these sections will be explored later). Provided the list is not empty, the most recent added layer is the one selected by default. The selected layer appears as highlighted.
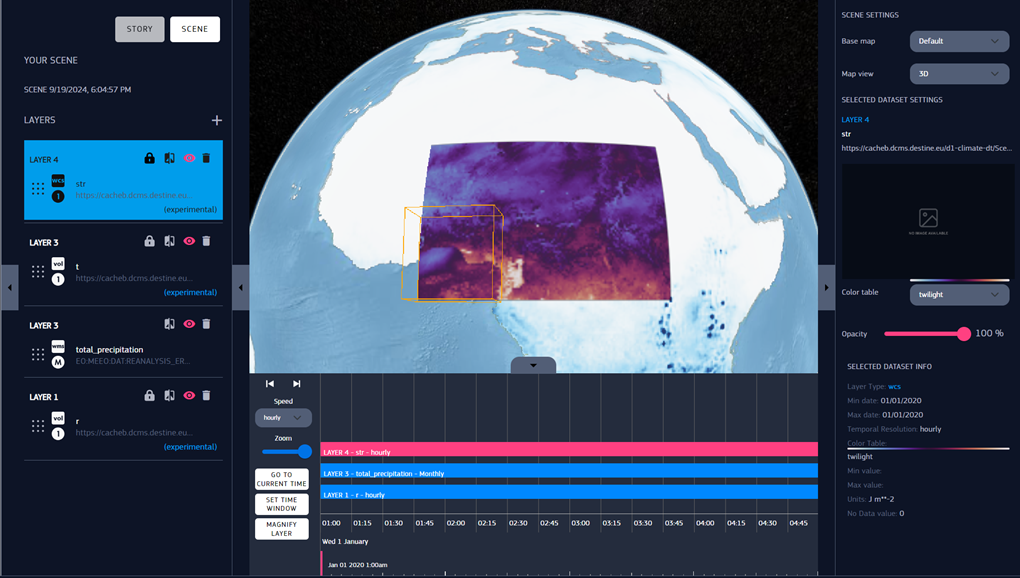
Fig. 4.14 New layer on canvas, with related information shown in the timeline and settings panel
Additionally, users can change the layer order with drag and drop movement, grabbing them by their 9-dots squared grid icon. The order of layers affects their rendering priority in the 3D view, more specifically the rendering order is bottom-top in the list. This means that the topmost layer in the list is rendered above the other ones.
4.2.4. Layer management
Various operation can be made on an existing layer. User can rename a layer by clicking on its name (by default “Layer” + number) and prompting the new one in the textbox.
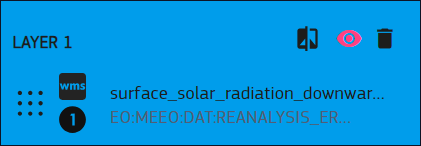
Fig. 4.15 Layer name edit |
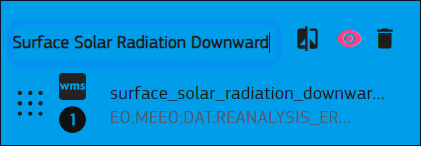
Fig. 4.16 Layer name edit |
Each layer item provides at least three buttons. The icon of a split image toggles compare mode, the eye shaped icon toggles layer visibility on the 3D viewer, and the trash bin icon is made to delete the layer. When a layer is hidden on the globe, its eye icon is blackened out, while it appears as coloured when the layer is visible. An additional fourth, locket shaped button might be displayed for datasets that require a preliminary extraction job before the visualization (see chapter 5). The icon reflects the status of the job, which can be locked or unlocked. Clicking on the button toggles the job status, operation that can be confirmed or canceled through the modal warning panel.
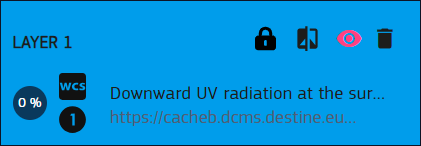
Fig. 4.17 Layer item with locked/unlocked job icon |
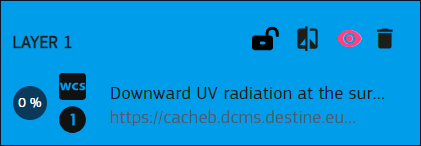
Fig. 4.18 Layer item with locked/unlocked job icon |
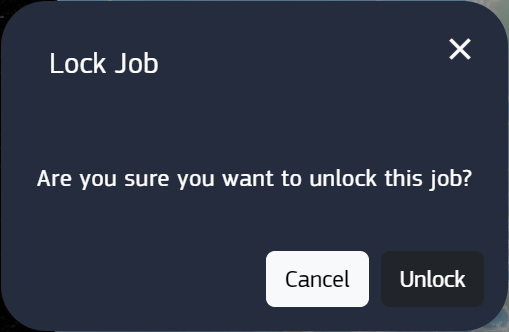
Fig. 4.19 Modal panel for job locking/ unlocking |

Fig. 4.20 Modal panel for job locking/ unlocking |
4.2.5. Compare mode
In the following section, further insight on the compare mode is provided. When compare mode is enabled, the 3D viewport is split in two halves with a vertical line. All visible layers within the scene will be partially rendered on one of the two sides depending on their compare toggle state. Layers with active compare mode will be rendered at the right side, while the other ones will be rendered on the left side. This means that all layers are by default on the left side, when comparison mode is inactive. User can drag the line horizontally to change the size of the two halves and make the graphic comparison between layers.

Fig. 4.21 Compare icon when a layer is on the left side |

Fig. 4.22 Comprare icon when a layer is on the right side |
A layer in compare mode will display the icon horizontally flipped according the side it belongs to. Toggling compare mode on a layer affects its side independently from its visible state. If a layer visibility is toggled off but the compare mode is toggle on, the layer will belong to the right side, and will be rendered accordingly once becoming visible again. The compare mode in the 3D view is maintained as long as there are >= 1 layers with compare state active. Once all layers compare mode are toggled off, the 3D viewport and layer rendering will be set back to their original state, without the splitting line.
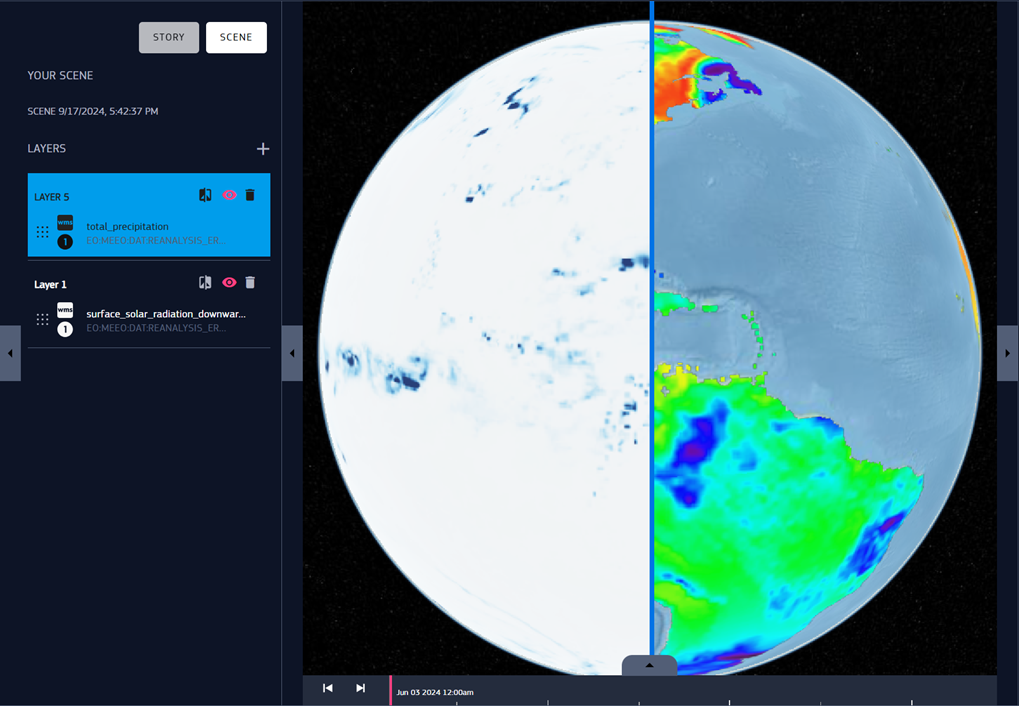
Fig. 4.23 Compare mode involving two layers.
Note: currently, compare mode works only for maps and volumetrics.
4.3. 3D Viewer
This is the viewport where the actual 3D globe is rendered along with the layers. You can rotate the camera around the earth model by clicking on the view and dragging with the left mouse click. You can also zoom in and out with the mouse scroll wheel. Alternatively, you can zoom by dragging with the right mouse click (only the vertical movement of the drag will have effect on the zoom).
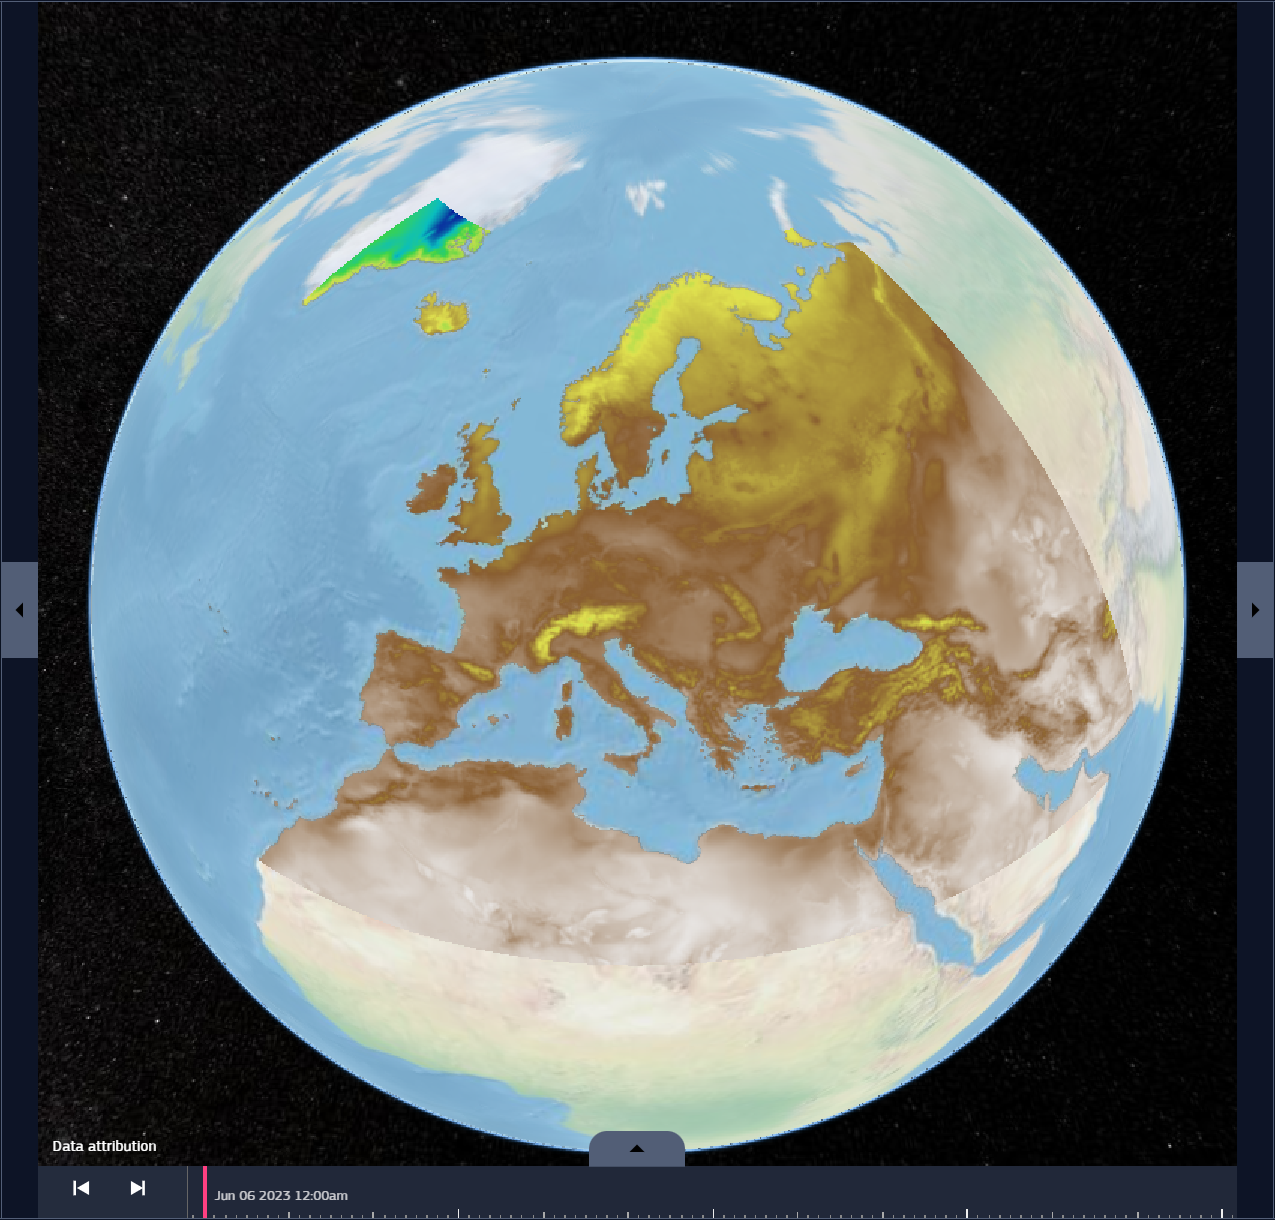
Fig. 4.24 3D Viewer with the 2m temperature layer on the Earth
4.4. Timeline panel
The timeline panel allows to track the evolution of a data over a period, through a navigable timeline. It provides the tools for selecting the desired time range and change some settings related to the timeline.
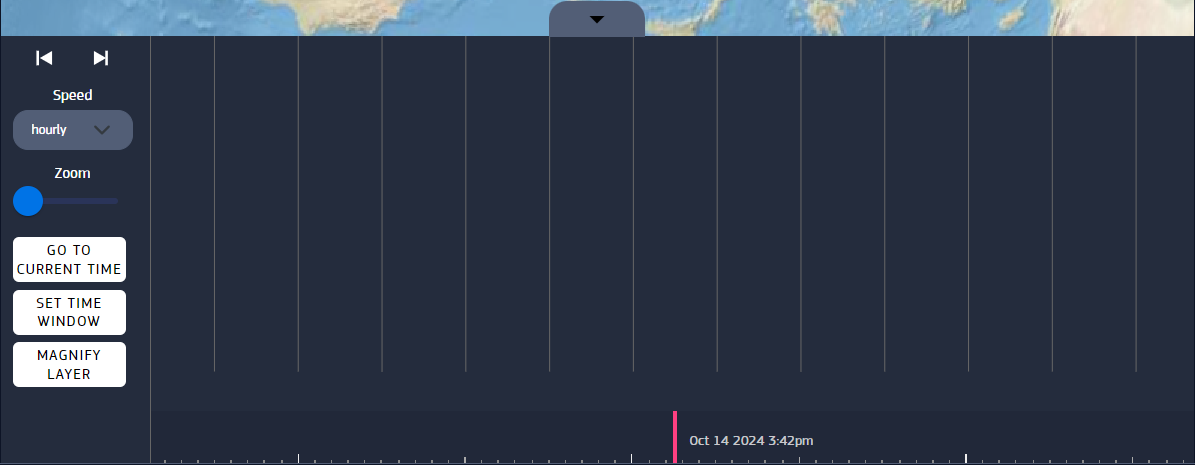
Fig. 4.25 Timeline panel
4.4.2. Go To Current Time
When dragging the timeline, it may happen the time focus bar ends up out of the view. You can use the “Go to Current Time” button to easily have it in sight again at the centre of the visible time span.
4.4.3. Set Time Window
To set the date range with precision, the user can click on the “Set Time Window” button. Upon click, a modal window pops up, where they can modify the date or the time. To keep the new range, you must click on the Set button.
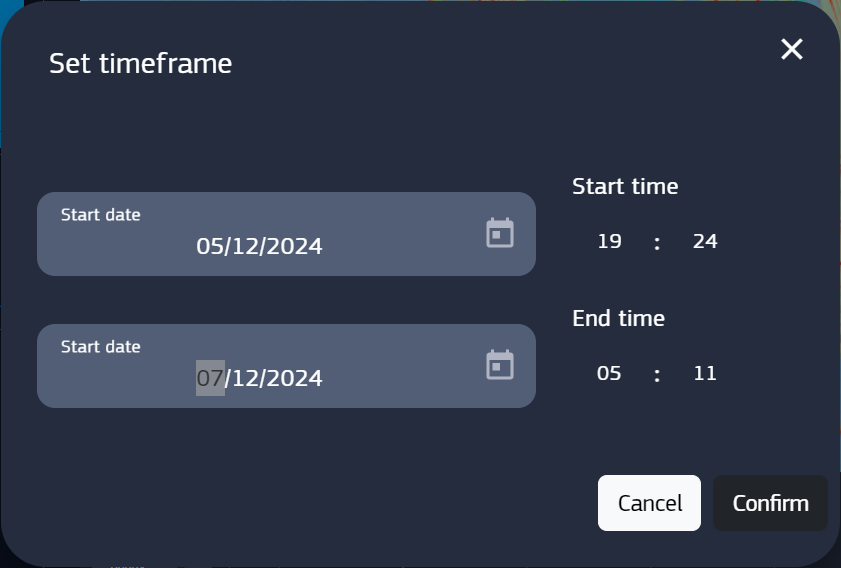
Fig. 4.27 Timeline modal panel, time edit |
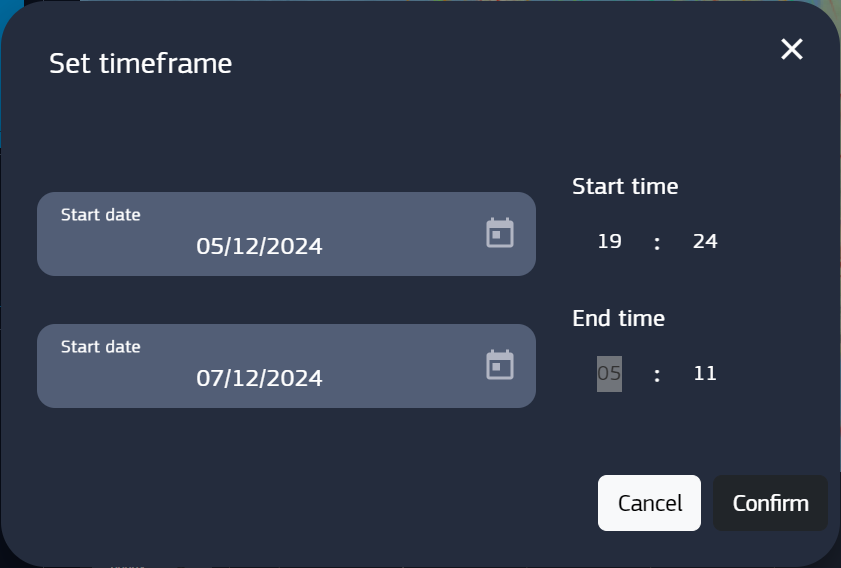
Fig. 4.28 Timeline modal panel, time edit |
Once clicked the Set button, the modal window will close and the values in the timeline panel will be set to the new ones. Also, this new range will be the default starting value for the filters in data offer page.
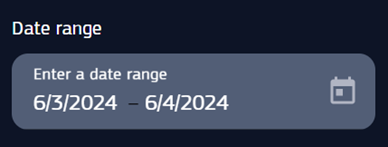
Fig. 4.29 New date range
4.4.4. Magnify Layer
The timeline shows the time range of each layer within the scene. The option “Magnify Layer” adapts the timeline zoom to fit the time range of the selected layer, and the time bar will appear at the start date of the layer. SUGGESTION: when loading a layer, if it doesn’t show up select it and click magnify layer, the first sample will be shown.
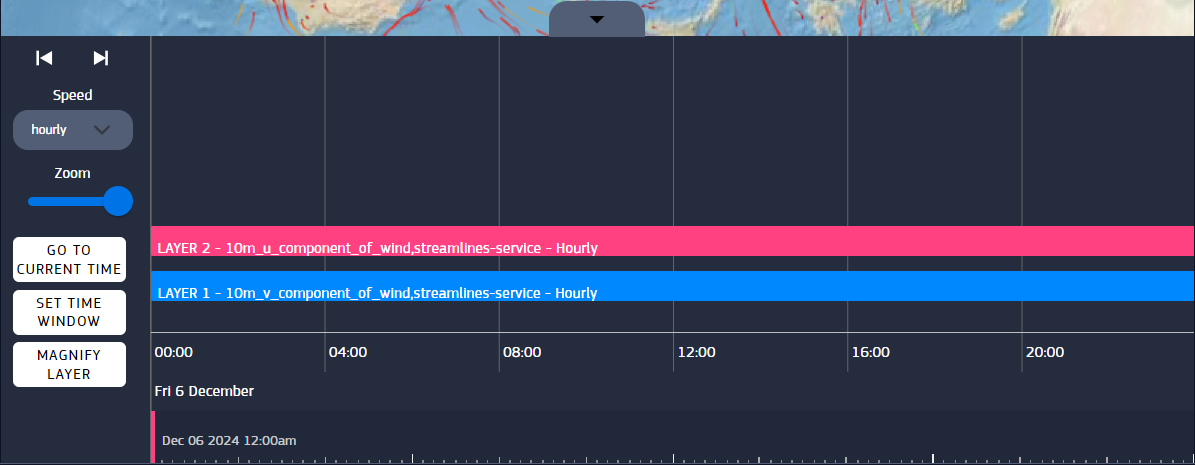
Fig. 4.30 Timeline after magnifying layer
4.4.5. Speed
In this context, speed refers to the time steps when iterating over a data timespan. This means that at each iteration, the time is increased or decreased by the time step amount (which we call speed). It can be hourly, 12-hourly, daily, weekly, monthly, yearly. This option can be set through the speed foldout.
4.4.6. Step Forward / Step Backward
With the forward/backward button, the graphical evolution of a layer over time can be reproduced, by going 1 step forward or backward along the timeline. The length of the steps depends on the speed setting.

Fig. 4.31 Step backward/forward buttons
4.5. Settings panel
As the last panel of the page, this provides several graphical options regarding scenes and layers.
4.5.1. Scene settings
- This section provides two options to display the map of the Earth.
“Base map” sets the appearance of the map (Default, Open Street View)
“Overlay boundaries” sets the appearance of the geographical boundaries (Coastlines, Countries, None)
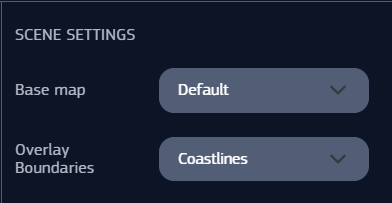
Fig. 4.32 Scene settings
4.5.2. Selected Dataset Settings
The last section of the settings panel contains layer graphics options and below, some core information about the layer. The information is related to the current selected layer, which means that any changes done in this panel will affect only that layer.
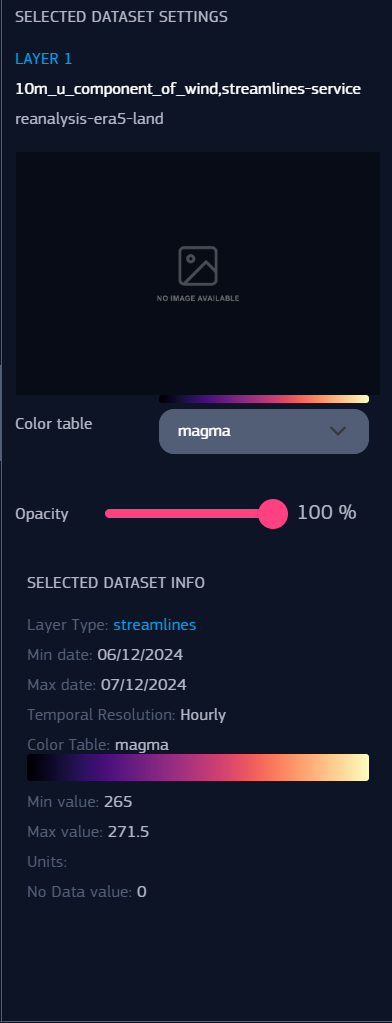
Fig. 4.33 Layer settings and info section
The displayed settings may vary depending on the selected dataset type, except for the opacity which is available for all types. The following list shows the options for each type:
|

Fig. 4.34 Volumetric settings example. This data type displays all the layer settings |
