Exporting and Downloading Outputs
CONOPS allows you to export results as CSV and GeoJSON for further analysis, reporting, and visualization in GIS or web mapping tools.
Where to download
Open the Results view of a Completed order.
Click Download / Export.
Choose CSV or GeoJSON.
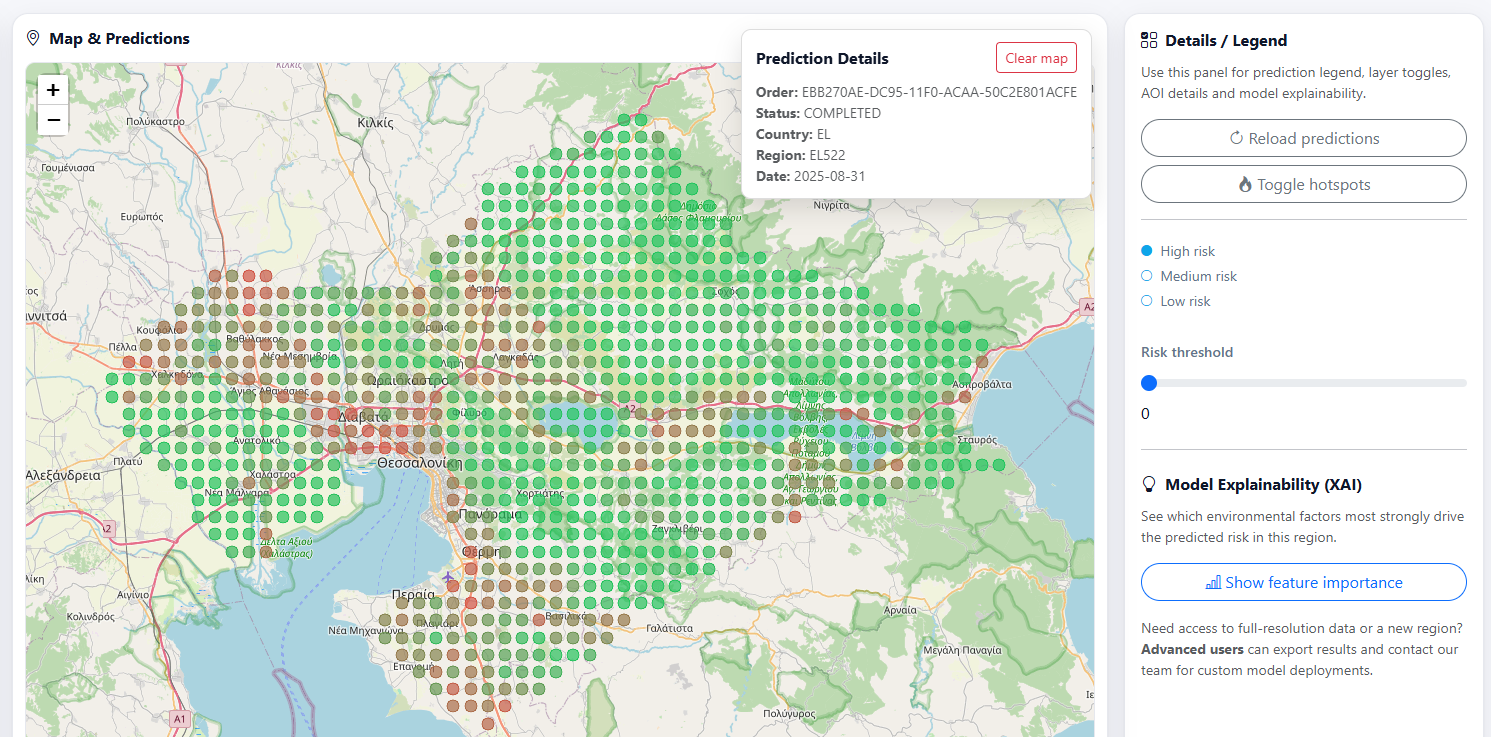
Results view and export action.
What you get
CSV export
The CSV is designed for spreadsheets and quick analysis (Excel, LibreOffice, pandas).
Typical content includes:
Order metadata (area, time period, model)
One row per spatial unit and/or per time step (depending on the output)
One or more indicator columns produced by the selected model
Recommended uses:
Create tables, pivot tables and charts
Filter/sort results by indicator value
Join results with other datasets using identifiers (e.g., region code, cell ID)
GeoJSON export
The GeoJSON export is designed for mapping.
It typically includes:
A geometry for each feature (e.g., grid cell polygon or region geometry)
A set of properties per feature, including indicator values and identifiers
Recommended uses:
Open in QGIS or other GIS software
Load into web maps (Leaflet / OpenLayers)
Share a map-ready dataset with stakeholders
How to use the GeoJSON in QGIS
Open QGIS.
Layer → Add Layer → Add Vector Layer
Choose the downloaded
.geojsonfile and click Add.Style by an indicator attribute: * Open Layer Styling * Choose Graduated * Select the indicator field (e.g., abundance/risk column) * Click Classify
If you need a basemap, add one via the QGIS Browser (XYZ Tiles) or your organization’s standard basemap.
File content and common fields
The exact field names may evolve, but exports generally include:
area: selected Area of Interest (e.g., NUTS code/name)
time_period: month or custom interval used for processing
model:
MAMOTHorDVIindicator(s): resulting values (abundance / risk, and any secondary indicators)
See Understanding Results for interpretation guidance and Glossary for terminology.