CONOPS – Advanced Application for Mosquito-Borne Disease Early Warning
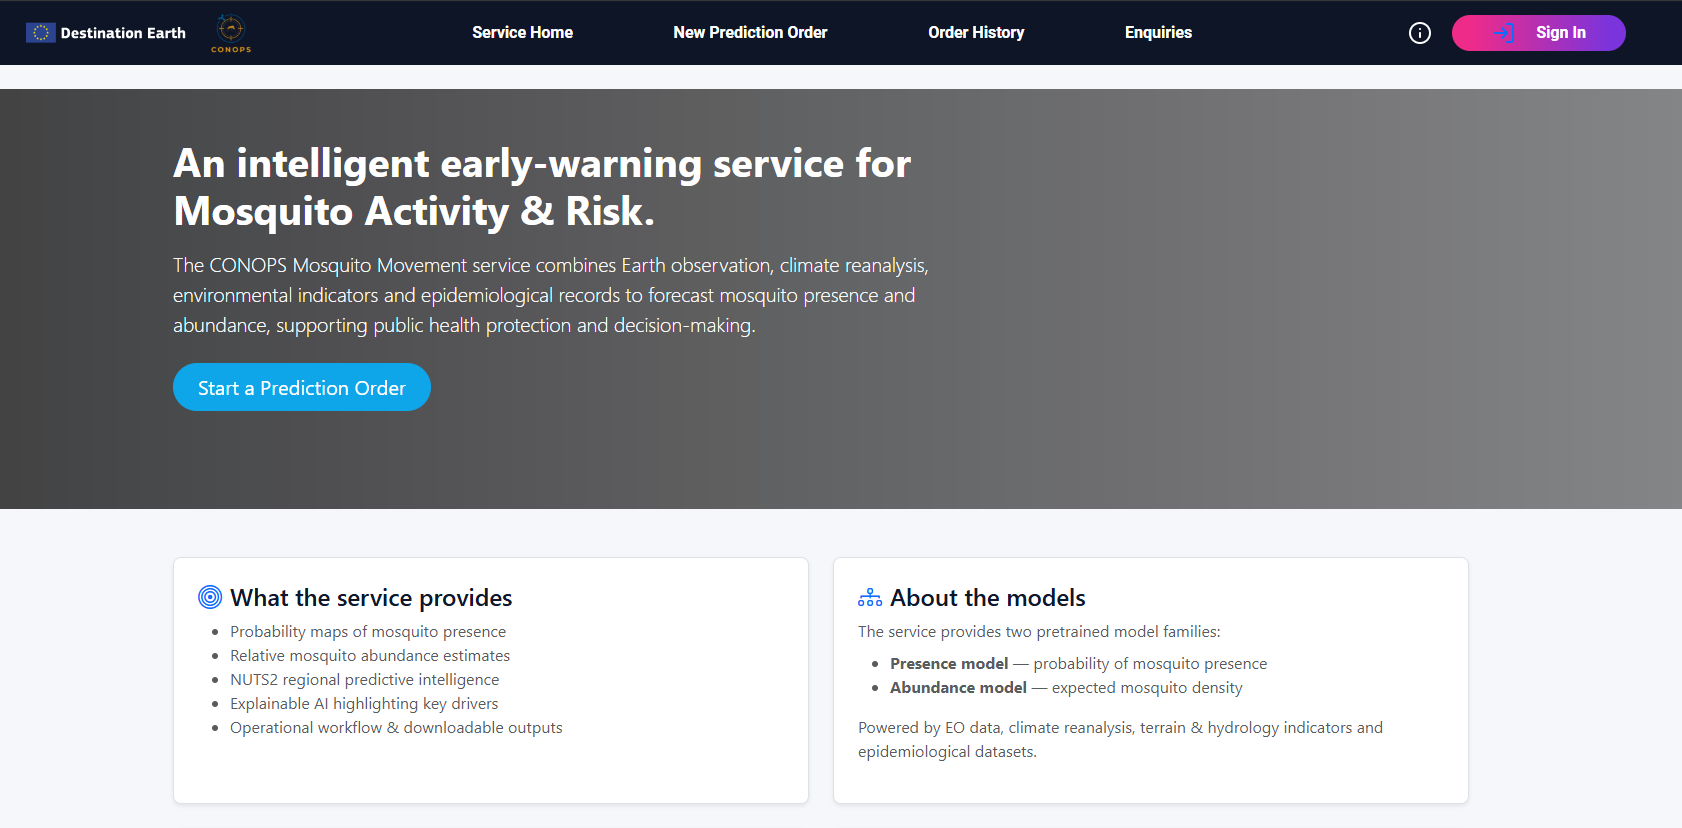
CONOPS is a DestinE Advanced Application and Service (AAS) that provides early-warning indicators for mosquito abundance and mosquito-borne disease risk, using Earth Observation, climate reanalysis and machine learning models.
This documentation is primarily a user manual: it explains how to run analyses, interpret results, and download outputs. Technical integration and operational topics are available in a separate section.
What you can do with CONOPS
With CONOPS you can:
Select an Area of Interest (e.g., NUTS region; and/or custom AOI if available in the UI)
Choose a time period (monthly or custom range within the mosquito season)
Run the available models: * MAMOTH – mosquito abundance indicators * DVI – mosquito-borne disease risk indicators
Visualize results on the map and explore layers/legends
Download outputs for further use in GIS or analysis tools
Typical outputs include gridded maps (1x1 or 2×2 km) and summary indicators for the selected area and period.
Quickstart
Open CONOPS from the DestinE Services catalogue and sign in.
On the main page, select your Area of Interest.
Select the time period (month or custom range).
Choose the model (MAMOTH or DVI) and any available options.
Click Run / Submit to create an order.
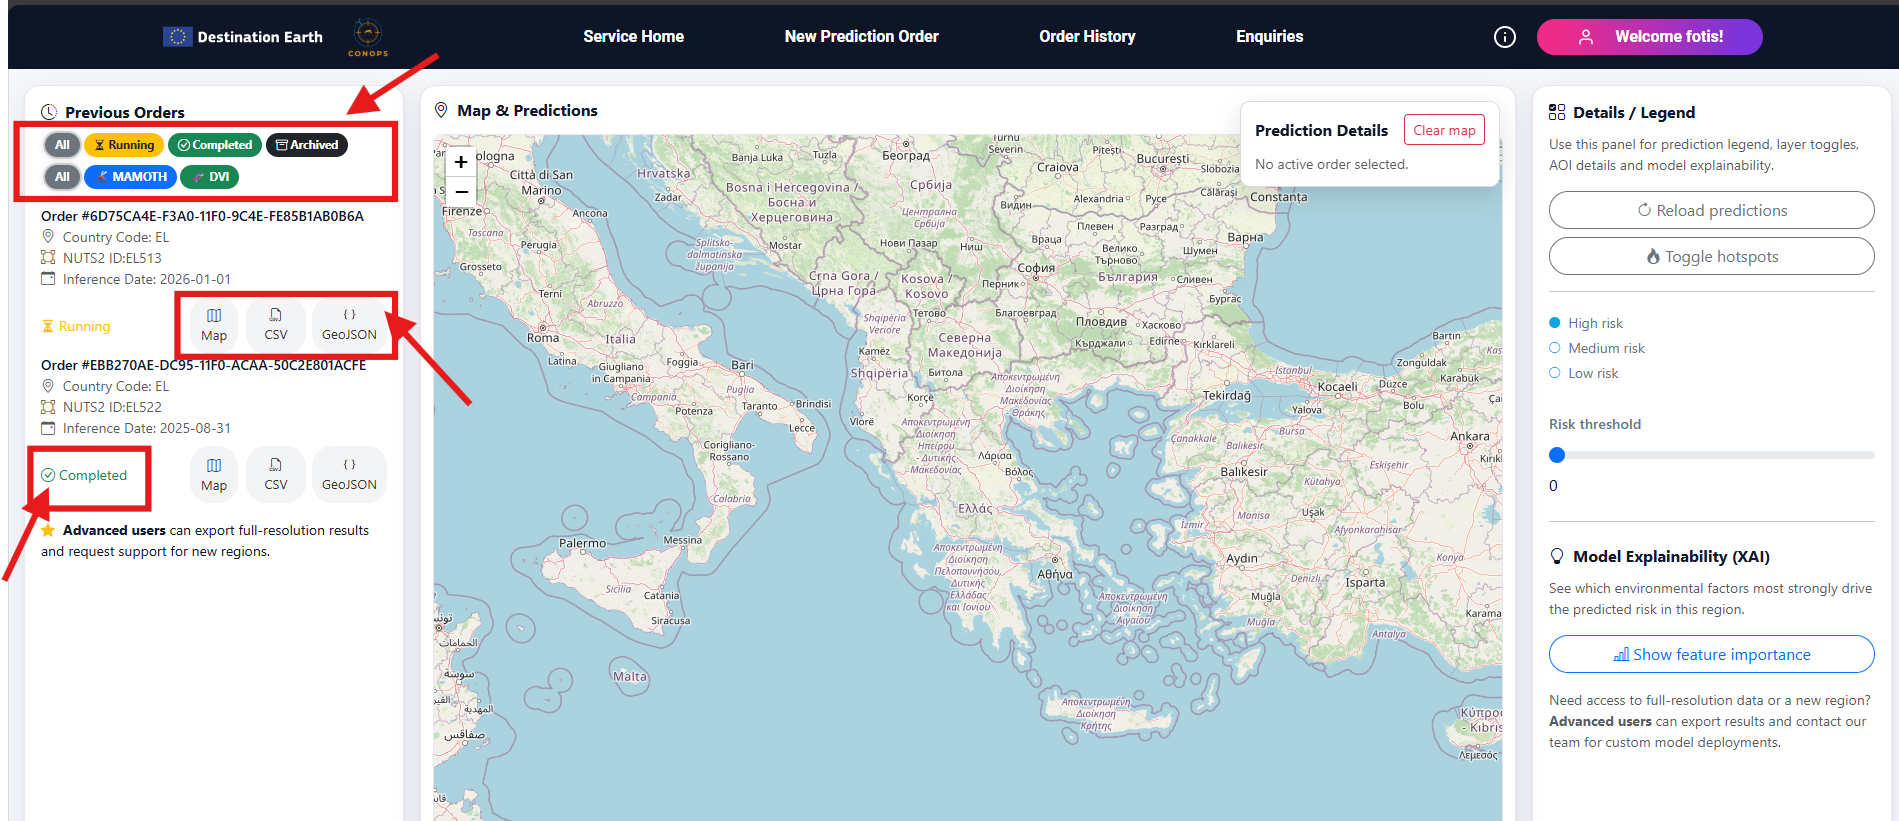
Monitor the order status until it is Completed.
Open Results to view the map outputs and charts.
Use Download / Export to retrieve outputs.
CONOPS home page.
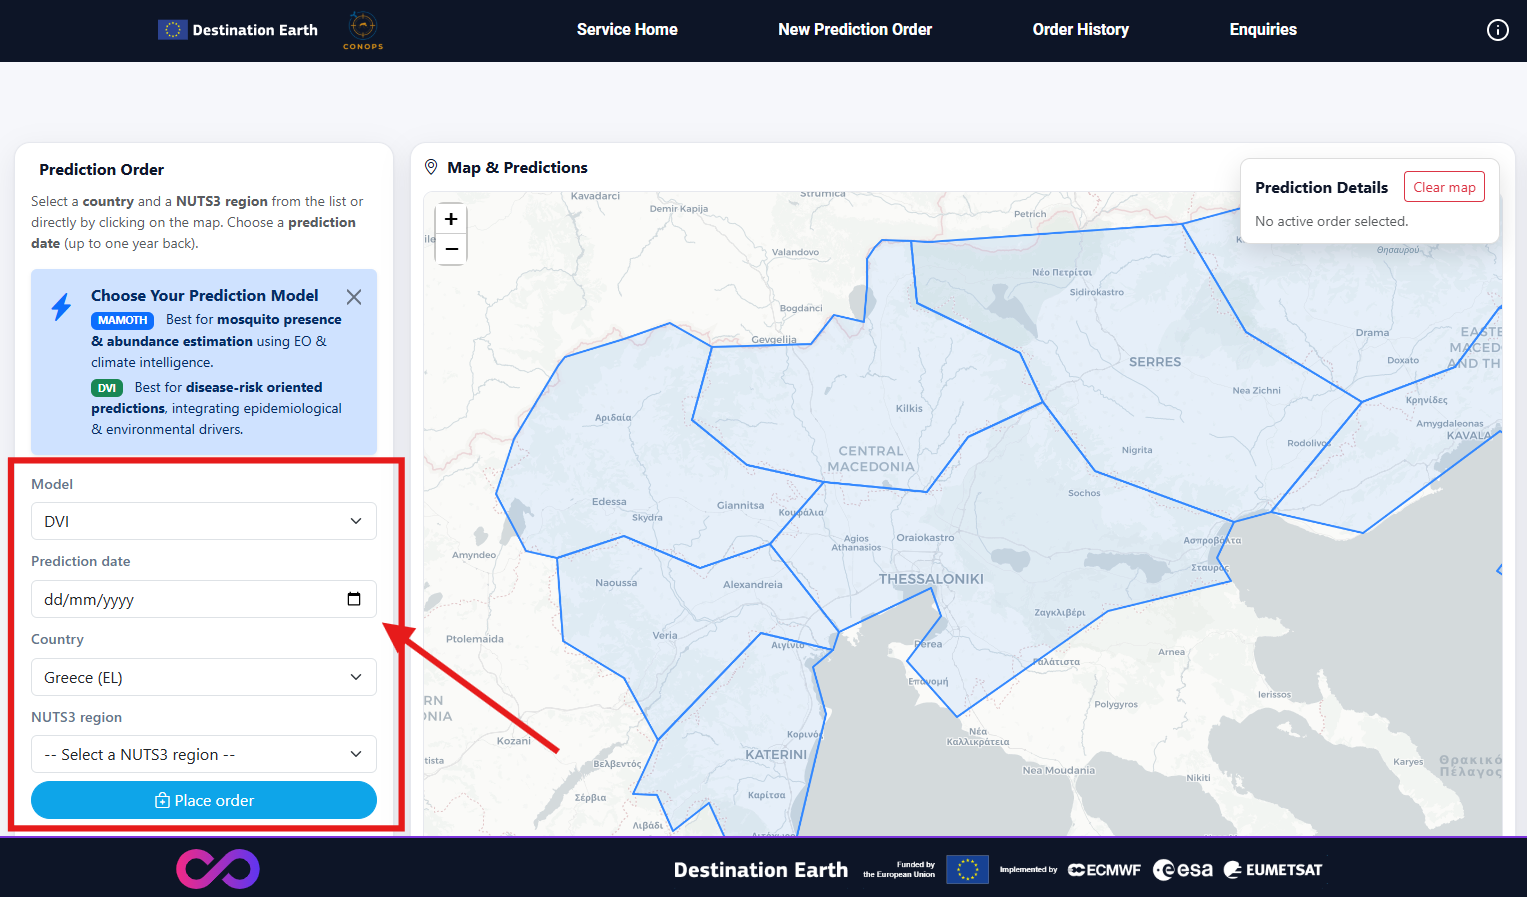
Select an area and time period.
Choose a model and submit an order.
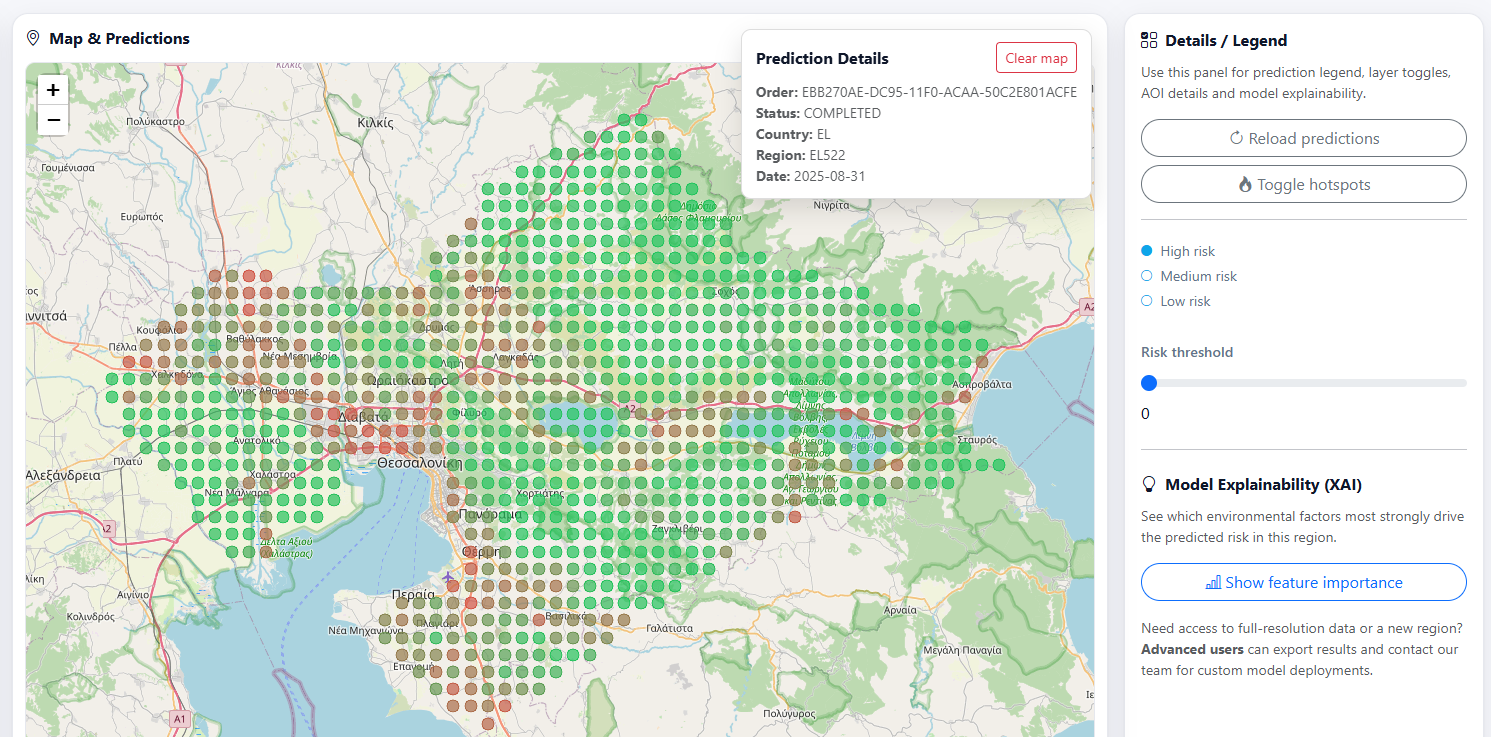
View results and download outputs.
How to use the web application
Select an Area of Interest
Use the available selector (e.g., NUTS regions) to define the area for analysis.
If the UI supports custom AOIs, draw or upload your geometry following the UI instructions.
Choose a time period
Choose a month (recommended for standard workflows), or
Define a custom time range when supported.
Run a model
MAMOTH provides mosquito abundance indicators.
DVI provides mosquito-borne disease risk indicators.
After selecting inputs, click Run / Submit to create an order.
Track orders
Orders typically progress through states such as Queued, Running, and Completed (or Failed). If an order fails, consult FAQ for common causes and recommended actions.
Understanding results
Results are provided at 1x1/2×2 km spatial resolution for the selected area and period.
To interpret a result:
Use the map legend to understand the indicator scale
Review any available explanation/quality layers in the UI
Compare different months or areas using consistent settings
If your workflow requires scientific interpretation (thresholds, confidence, limitations), see Understanding Results and Glossary.
Data sources
CONOPS currently ingests data exclusively from the DestinE Data Lake (DEDL):
Sentinel-2
Landsat 7 / 8 / 9
ERA5 reanalysis products
Digital Twin datasets are not integrated at this stage.
Documentation
Contact and support
For service access issues, usage questions, or incident reporting, follow the DestinE support process and contact the designated Service Desk / Client Administrators defined for your organization.