How to create a story
The user can create stories exploring the DEA data portfolio with the DEA Story Editor, which includes an editing side on the left and the corresponding world map visualization in the middle of the screen.
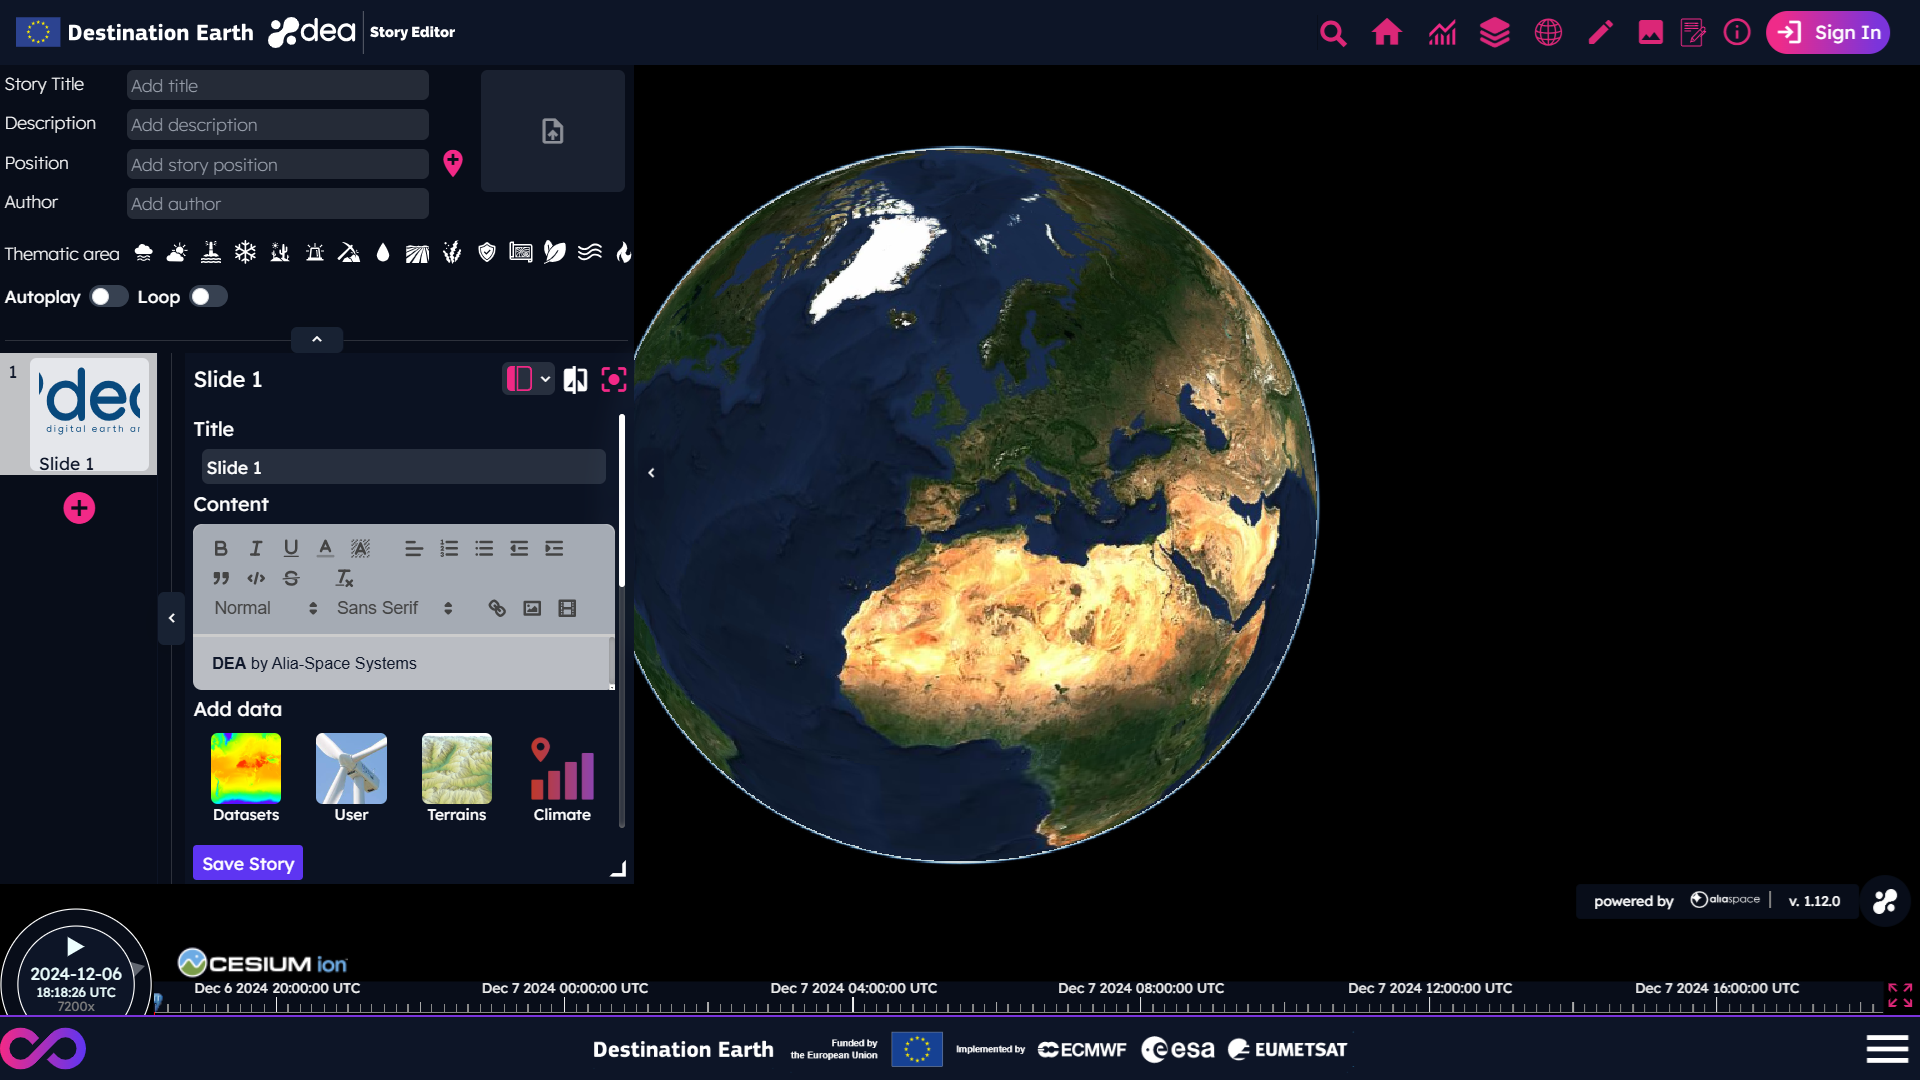
First of all, it is possible to define:
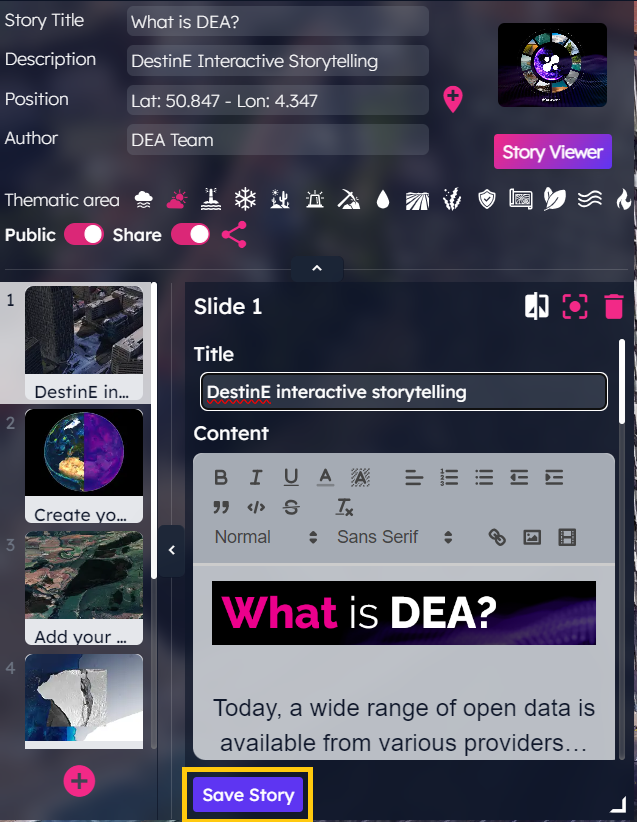
A story title (mandatory)
A story description
A location, by clicking on the proper icon to the right of the text box and then selecting a point on the map
An author
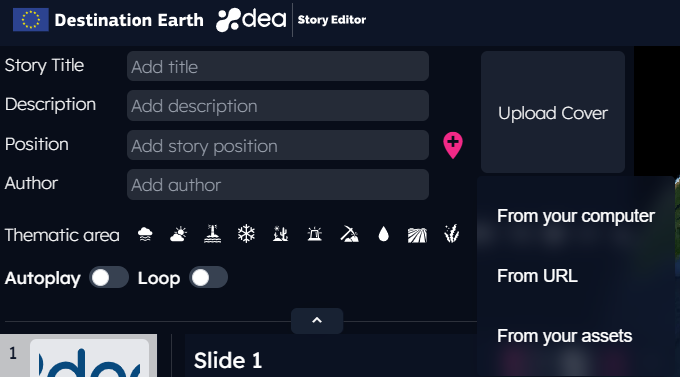
A cover, choosing an image or a video from local computer [1], from User Assets or from an external URL [2]. If no cover is selected, a default one will be used.
Add data from DEA portfolio
The user can start adding data to his/her story selecting them, for instance, from the DEA portfolio.
The list of available data is shown by clicking on the Datasets button indicated in the picture below.
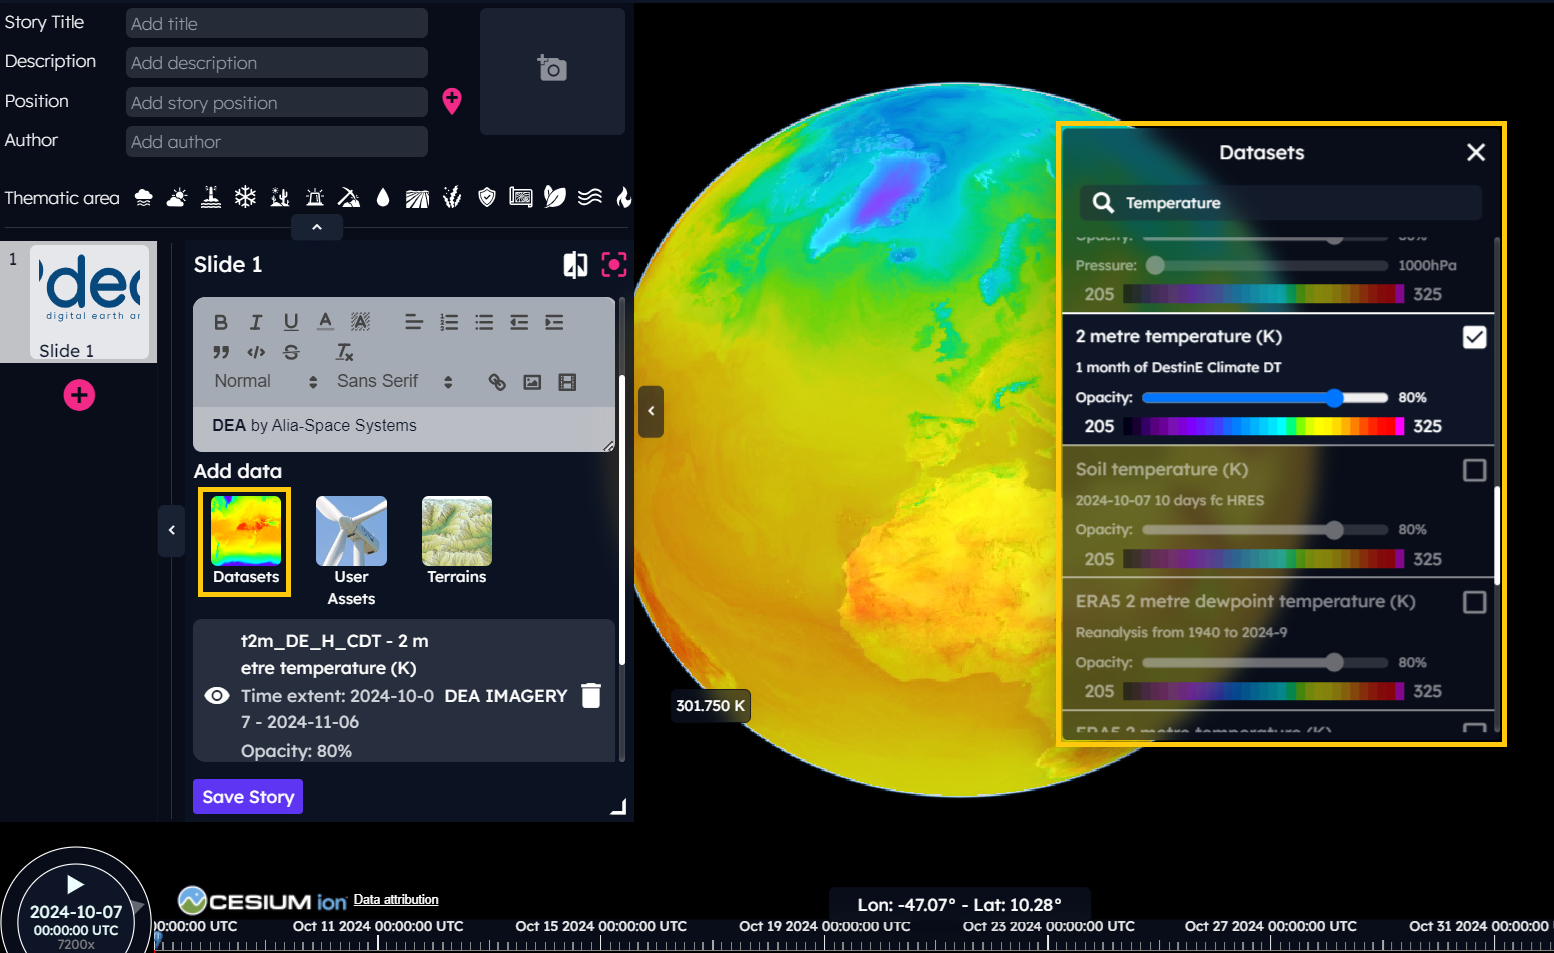
Clicking on an item of the Layers tab, the corresponding data is applied to the map.
 The DEA public
 Layers can be filtered by:
variable
domain
model
data source
Users can choose a filter type from the drop-down menu in the Datasets panel and select one or more of the available options.
Natural Hazards
The new Natural Hazards dataset is available since the DEA 1.8.0 release.
Generated exploiting the Copernicus Emergency API Layers, it allows adding events like floods, wildfires and earthquakes in user stories.
By clicking on the Datasets button available in the Story Editor and then selecting the Natural hazards tab, the updated list of events is shown.
The user can filter the list by selecting the event categories shown in the panel.
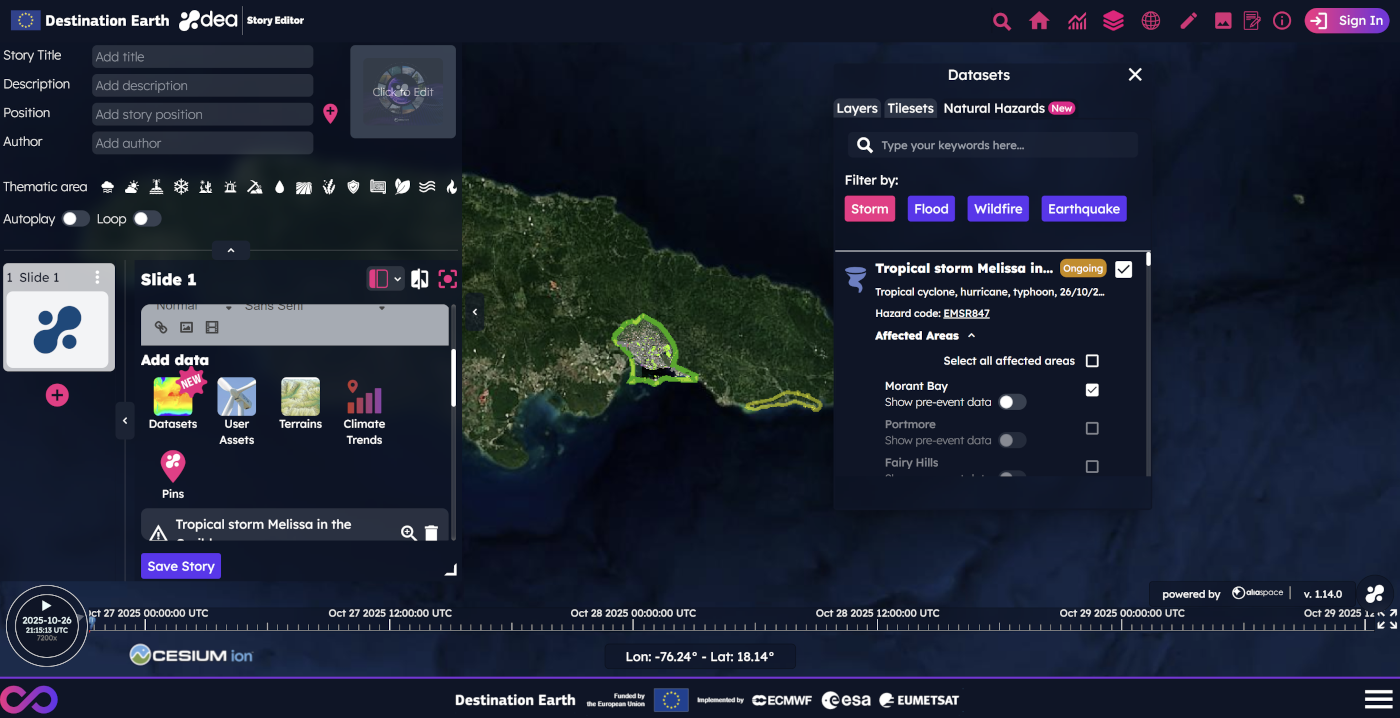
The user can select an event from the panel and then select up to 10 affected areas in a slide to see the data on the map.
Each affected area has pre-event data that can be added to the map, as indicated in the picture below.
Pre-event data includes reference layers such as buildings, transportation, and lakes that may be affected by the event.
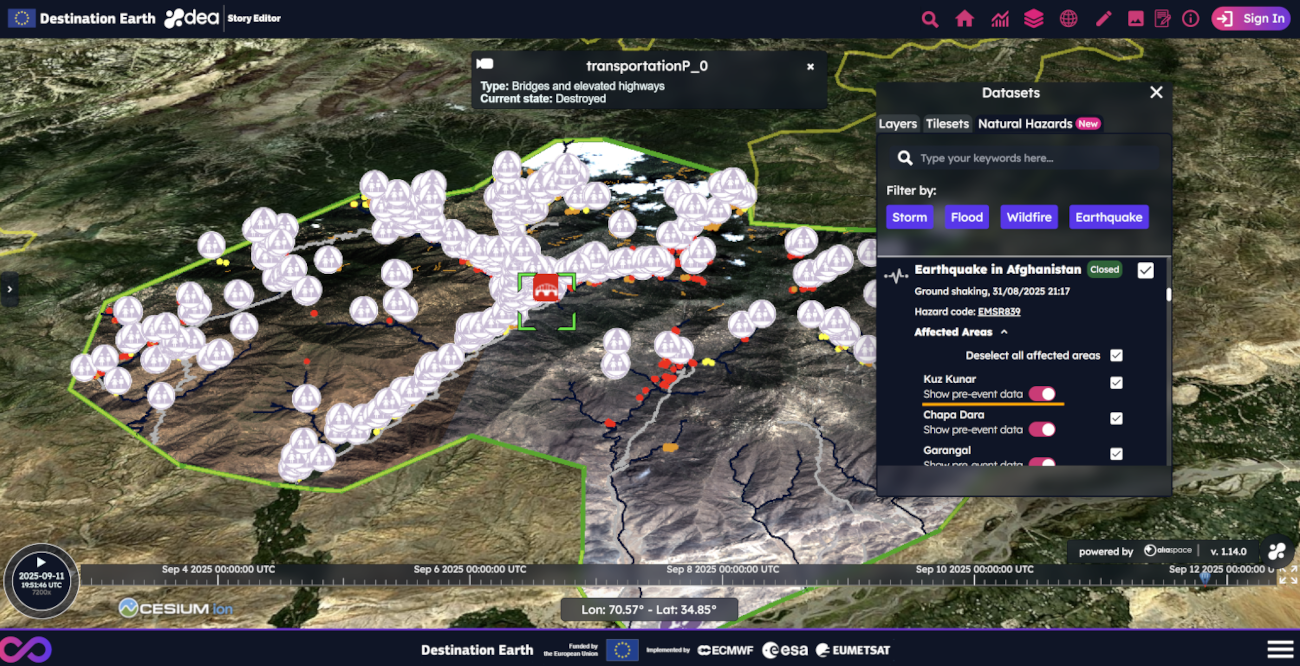
The user can move the timeline to see the evolution of the data over time. Please note that only one event can be added per slide.
Timeline autoplay and globe rotation
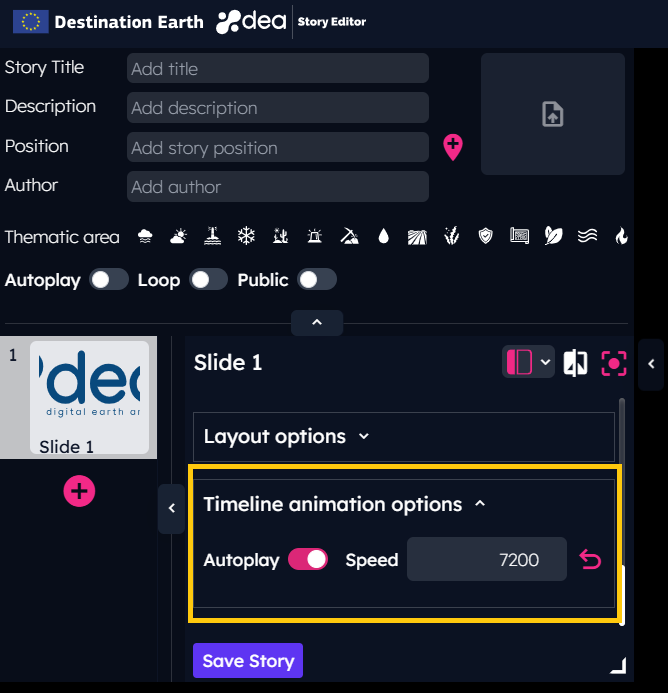
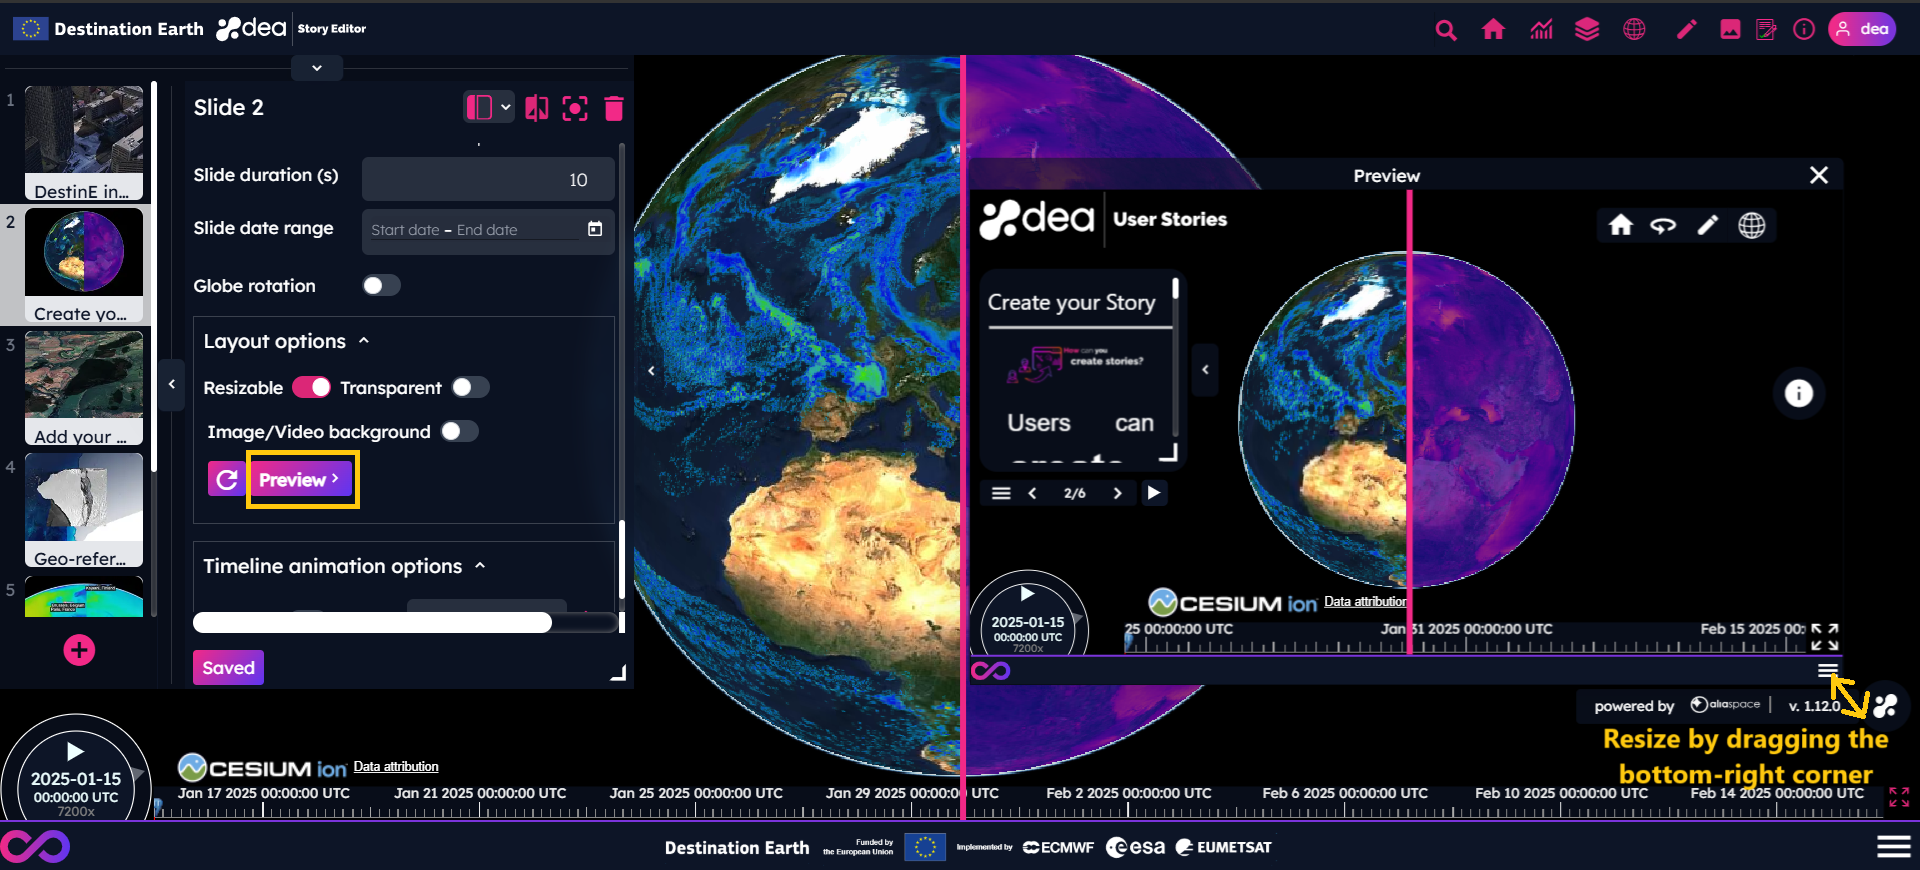
Since the DEA 1.5.0 release, the user can enable the autoplay of the timeline to start the animation of the data automatically. It is also possible to set the timeline speed, depending on the time resolution of the selected data.
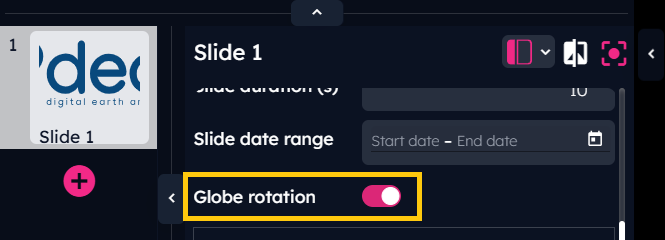
To create more attractive stories, the user can enable the globe rotation from the DEA Story Editor, as indicated below.
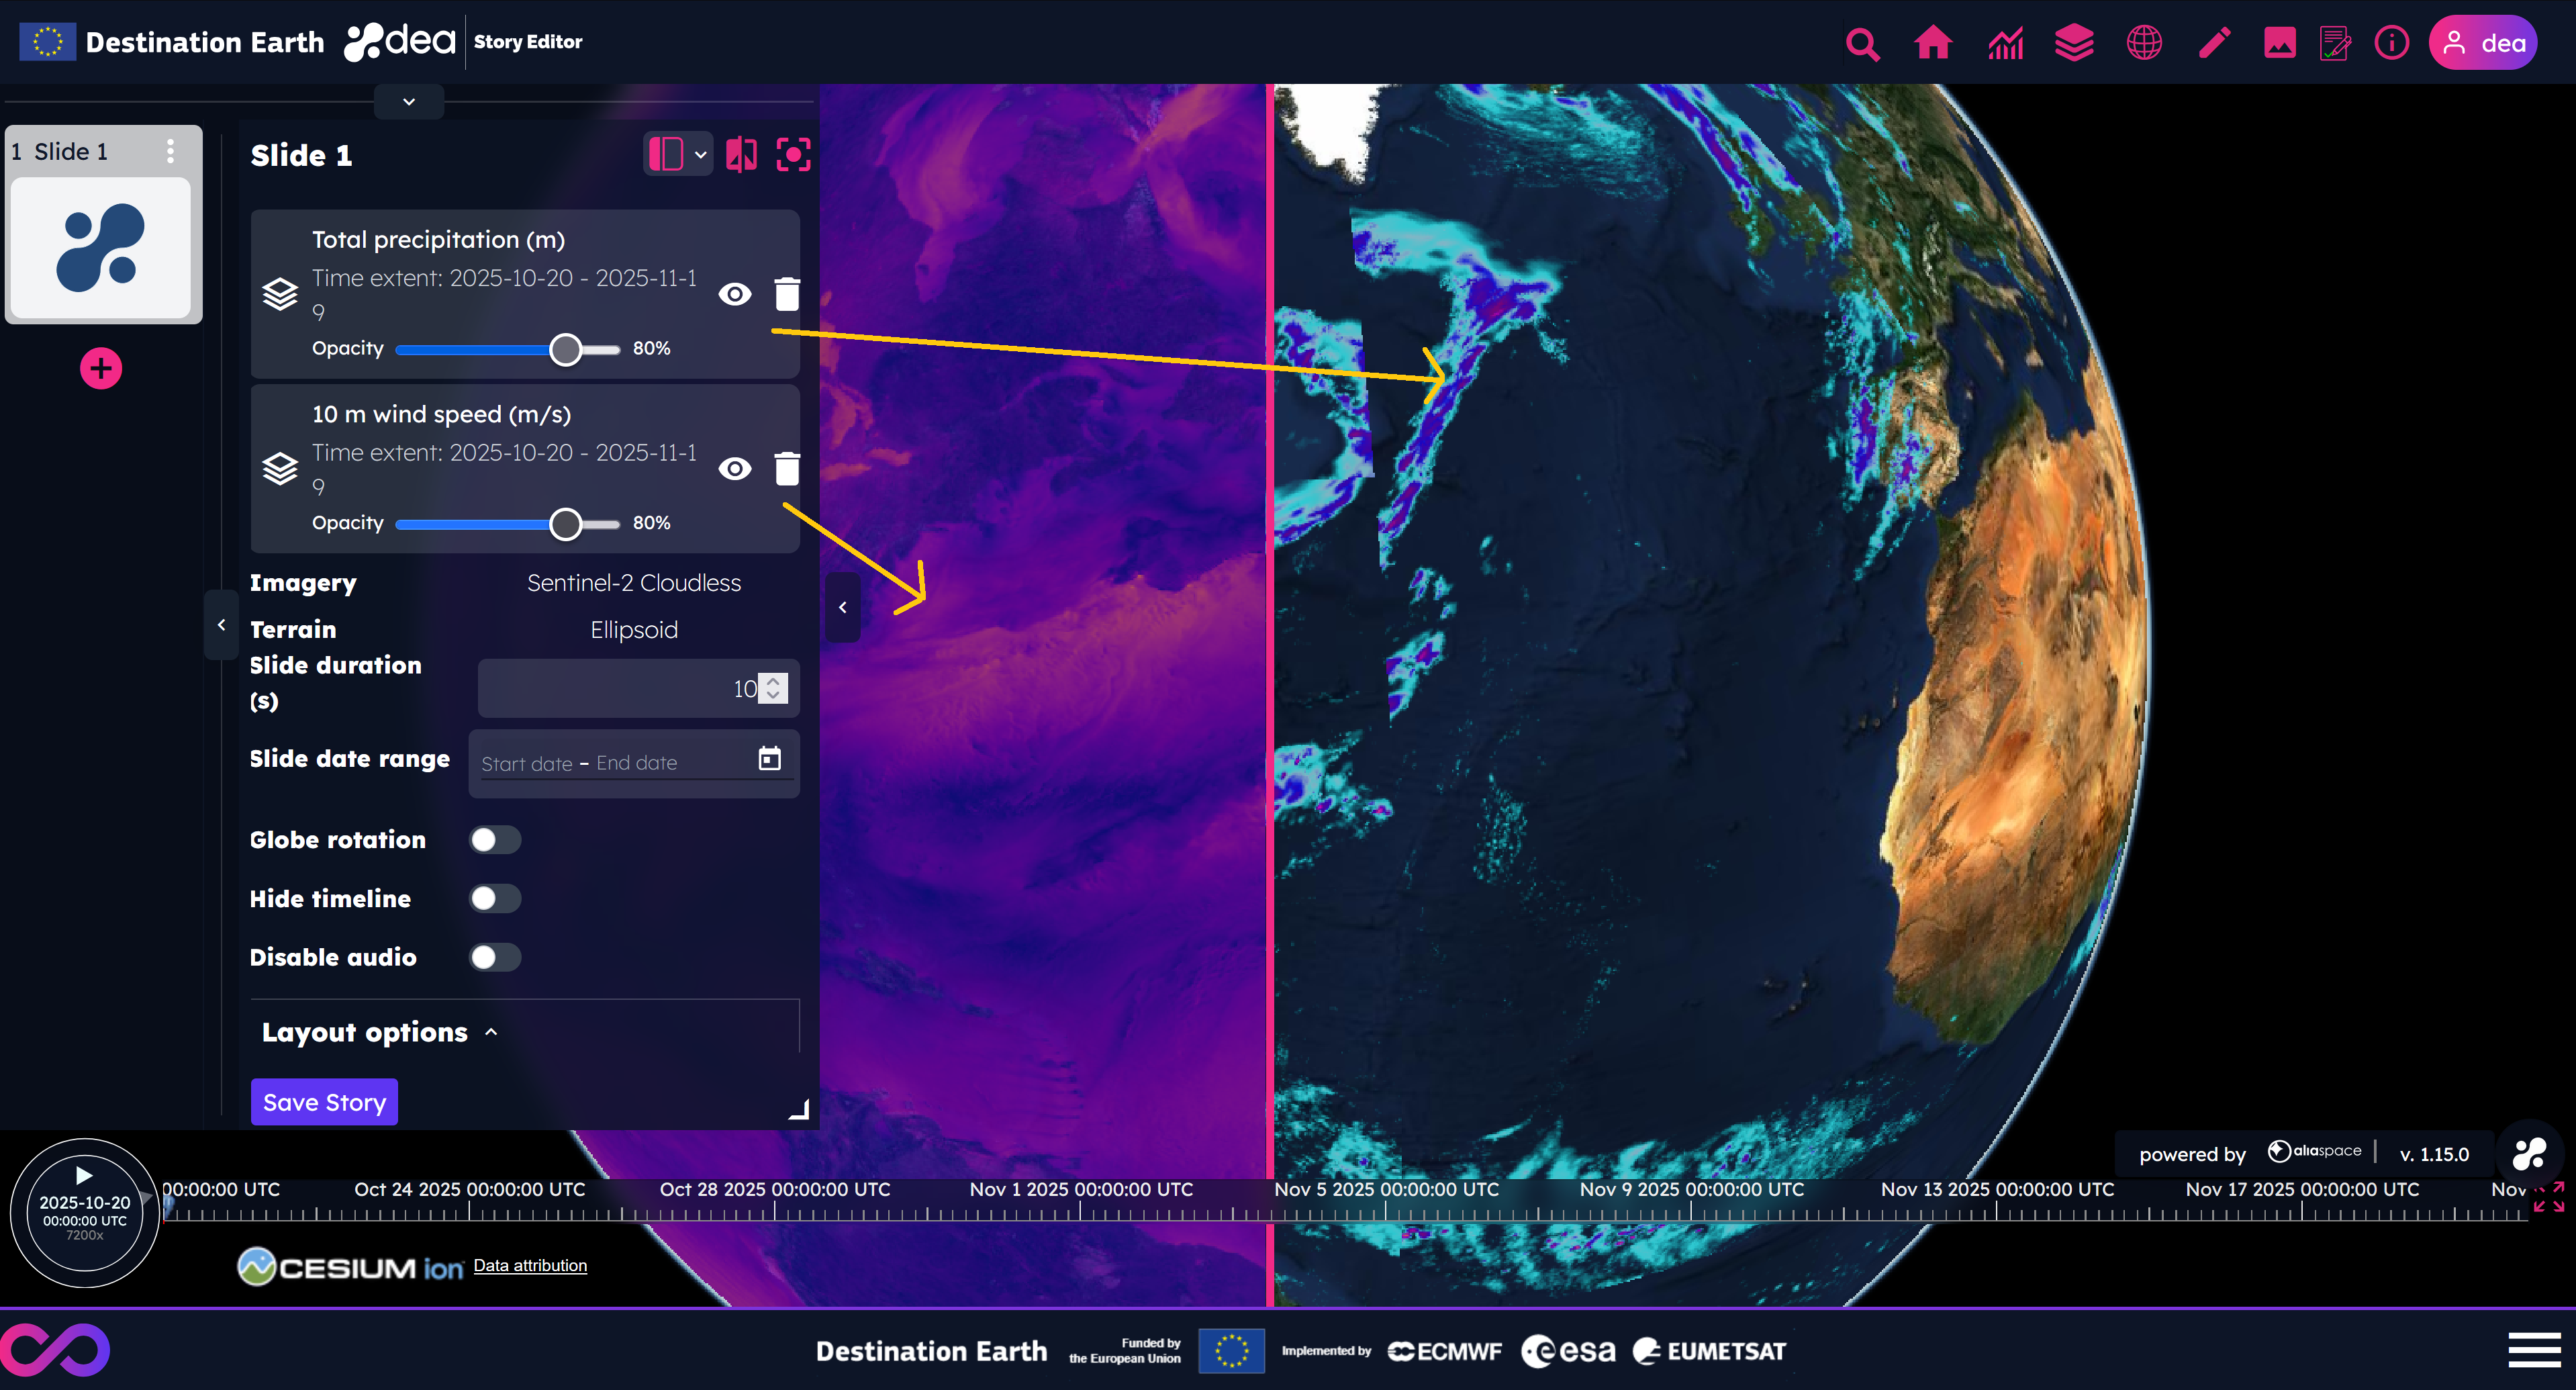
Data comparison
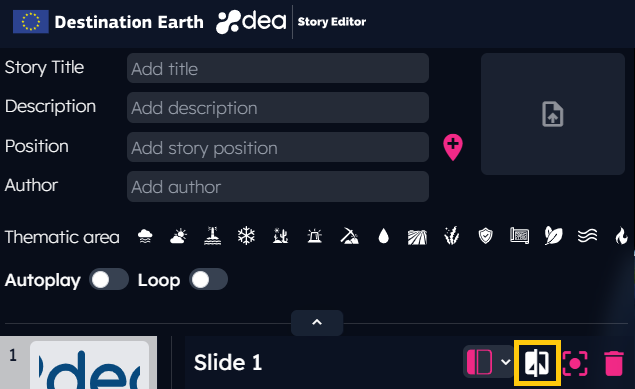
To compare different data in the same view is possible by clicking on the dedicated icon, to the right of the slide title, and then moving the split line that appears on the screen.
Odd-numbered datasets are displayed on the right side of the screen, while even-numbered datasets are displayed on the left side of the screen.
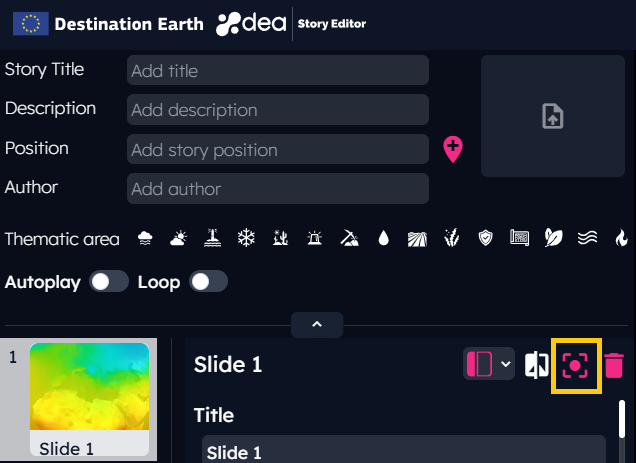
Center the map according to the user’s needs
The user can capture the slide view by clicking on the proper icon, to the right of the slide title, as shown in the picture below.
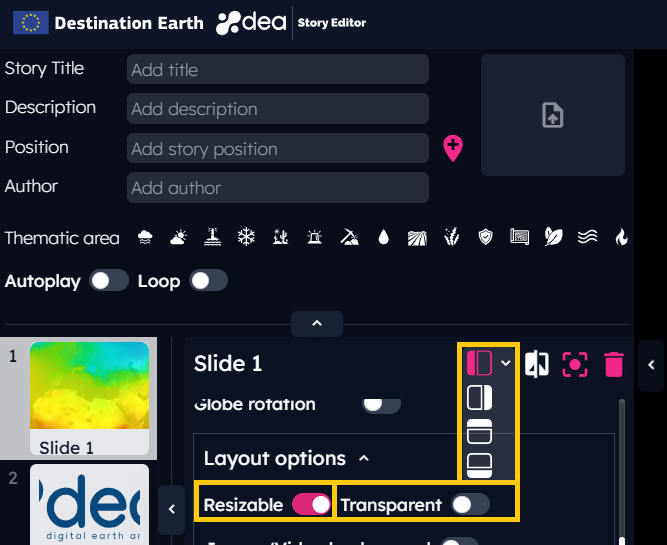
Set the slide layout
This feature allows to change the text position in a slide by clicking on the proper icon, to the right of the slide title.
It is also possible to set the text of the slide as:
Resizable
Transparent
In case of transparent background, the text of the slide will not be resizable and the title of the slide will not be visible.
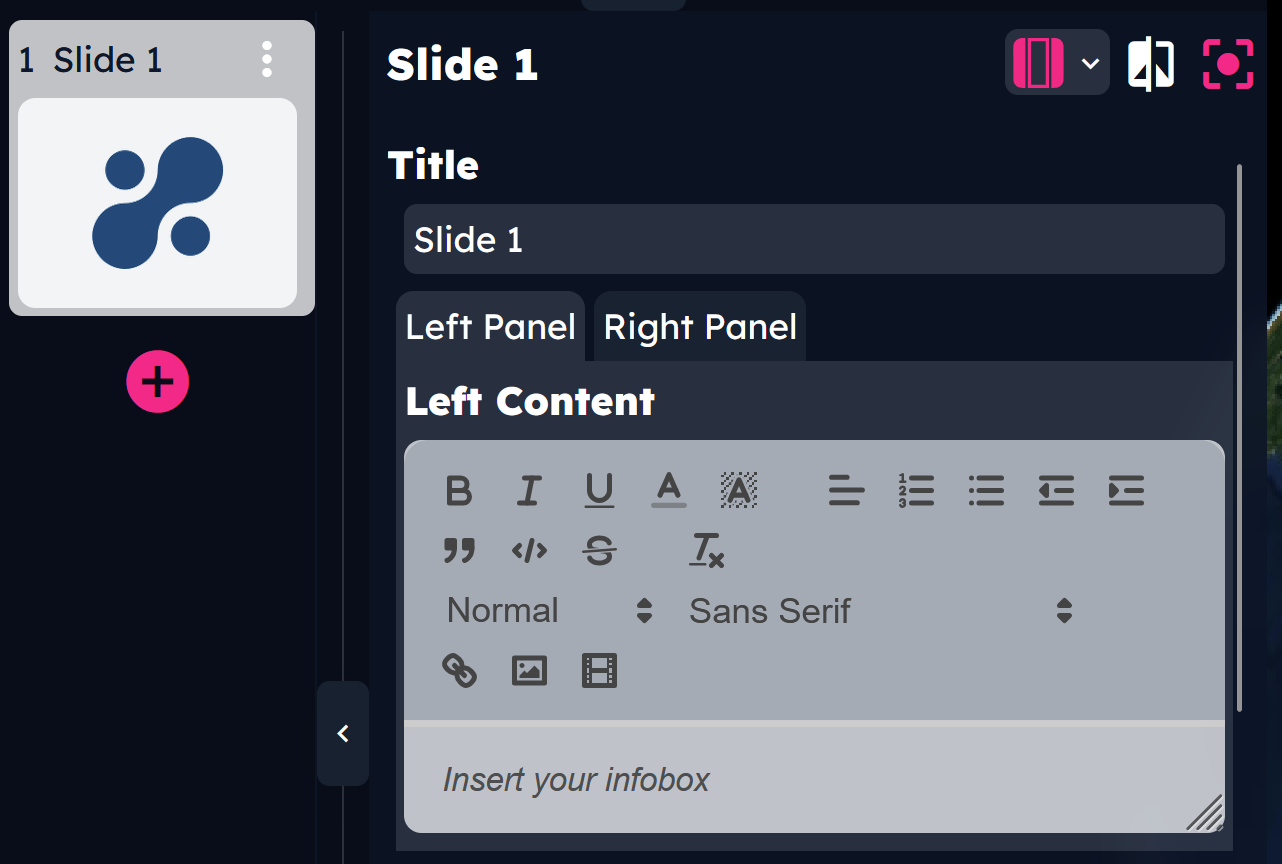
Users can write their contents in both the Left and Right panels from the DEA Story Editor. This layout can be used, for instance, to describe datasets shown on the screen in comparison mode.
Since the DEA 1.9.0 release, users can add text in the middle of the screen by selecting the new center layout: 
At this point, the story can be saved by clicking on the Save Story button at the bottom of the editing section.
Once the story is saved, a resizable slide preview can be displayed directly in the DEA Story Editor to check if it looks as expected.
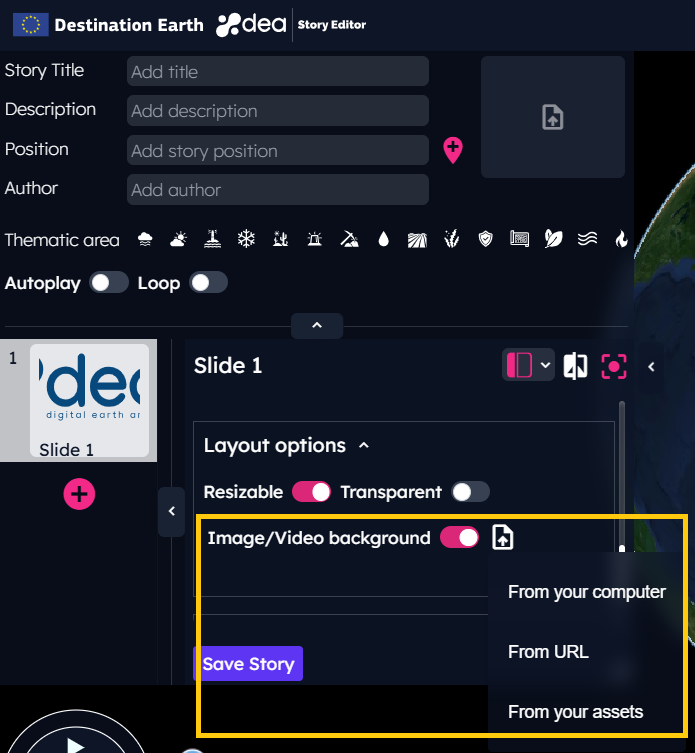
Set images or videos as slide background
This feature allows to add an image or a video as slide background replacing the globe.
The user can upload an image or a video from local computer [1], select an image or a video from User Assets or add an external URL [2].
Story autoplay and loop
In case of need to show the story as a video without loosing the interactive features of the DEA Story Viewer, it is possible to enable the story autoplay and the story loop from the DEA Story Editor.
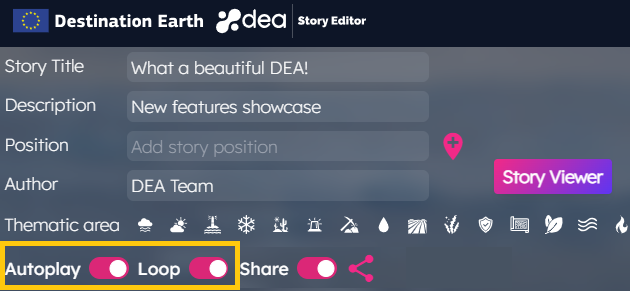
The autoplay allows the automatic loading of the slides of a story, without the need to interact with the menu buttons. It is always possible to interrupt the autoplay by clicking on the pause icon of the viewer.
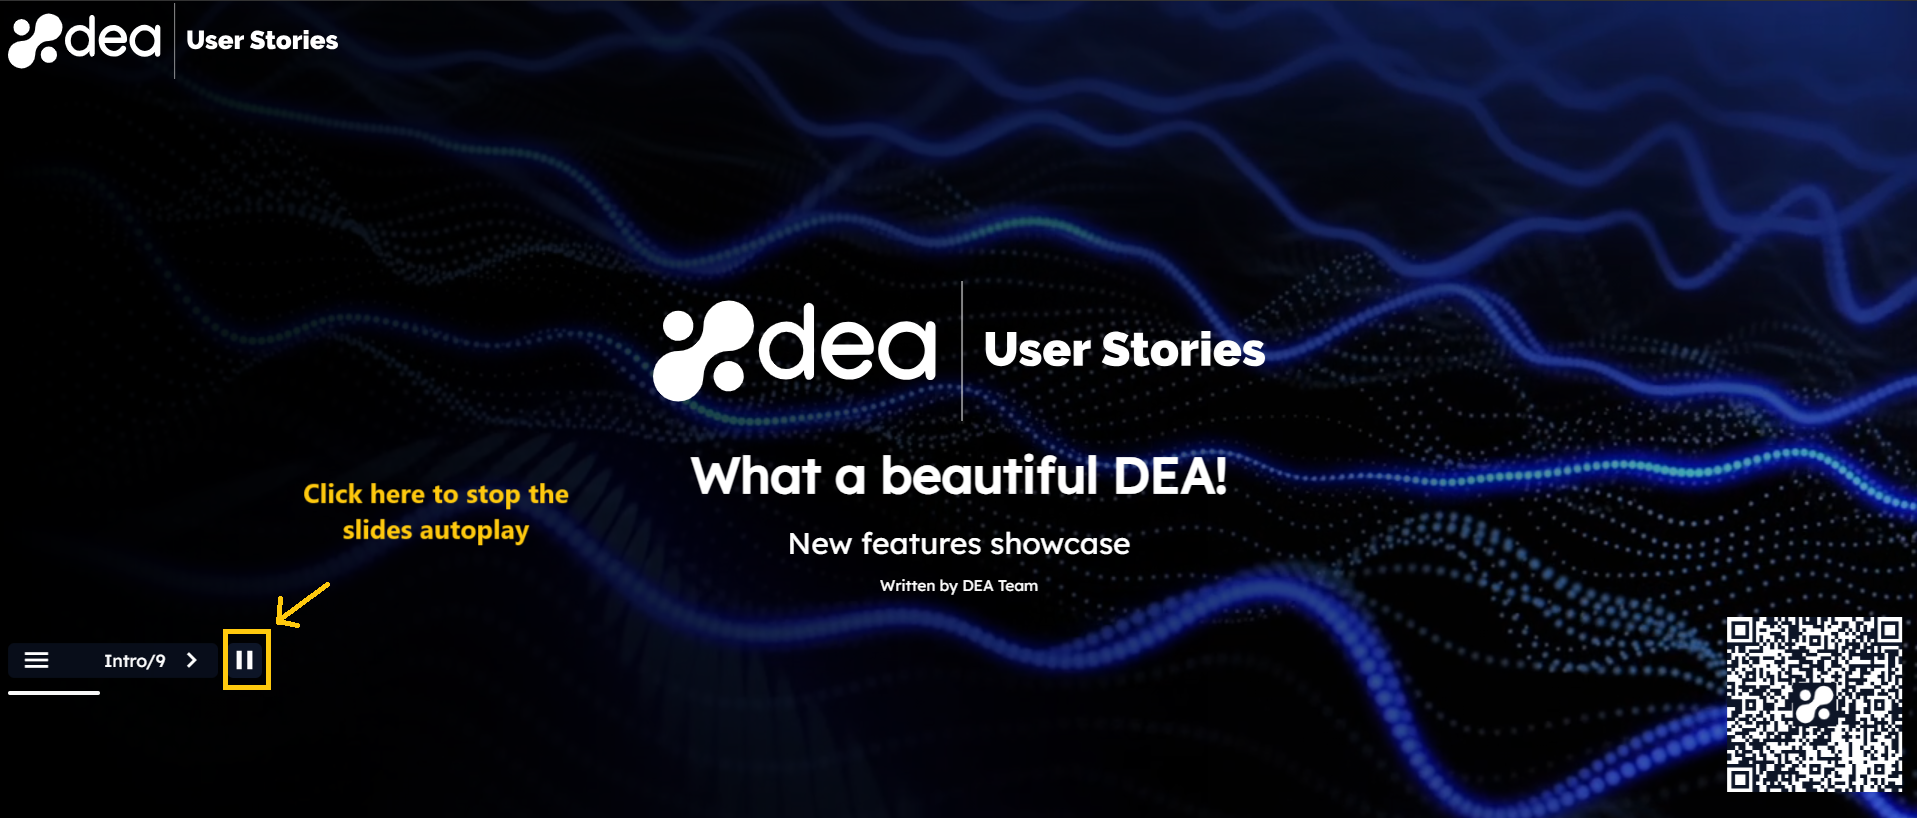
The loop option allows to restart the story from the beginning when the last slide’s time expires.
Add new slides to the story
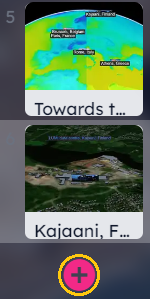
To add more slides to the story, it is needed to click on the + button, below the last slide preview of the story.
To sort the slides in a different way the user can simply drag and drop them to the desired position.
Slide Duplication
Since the DEA 1.6.0 release, users can duplicate an existing slide by clicking on the Duplicate slide option of the slide menu.
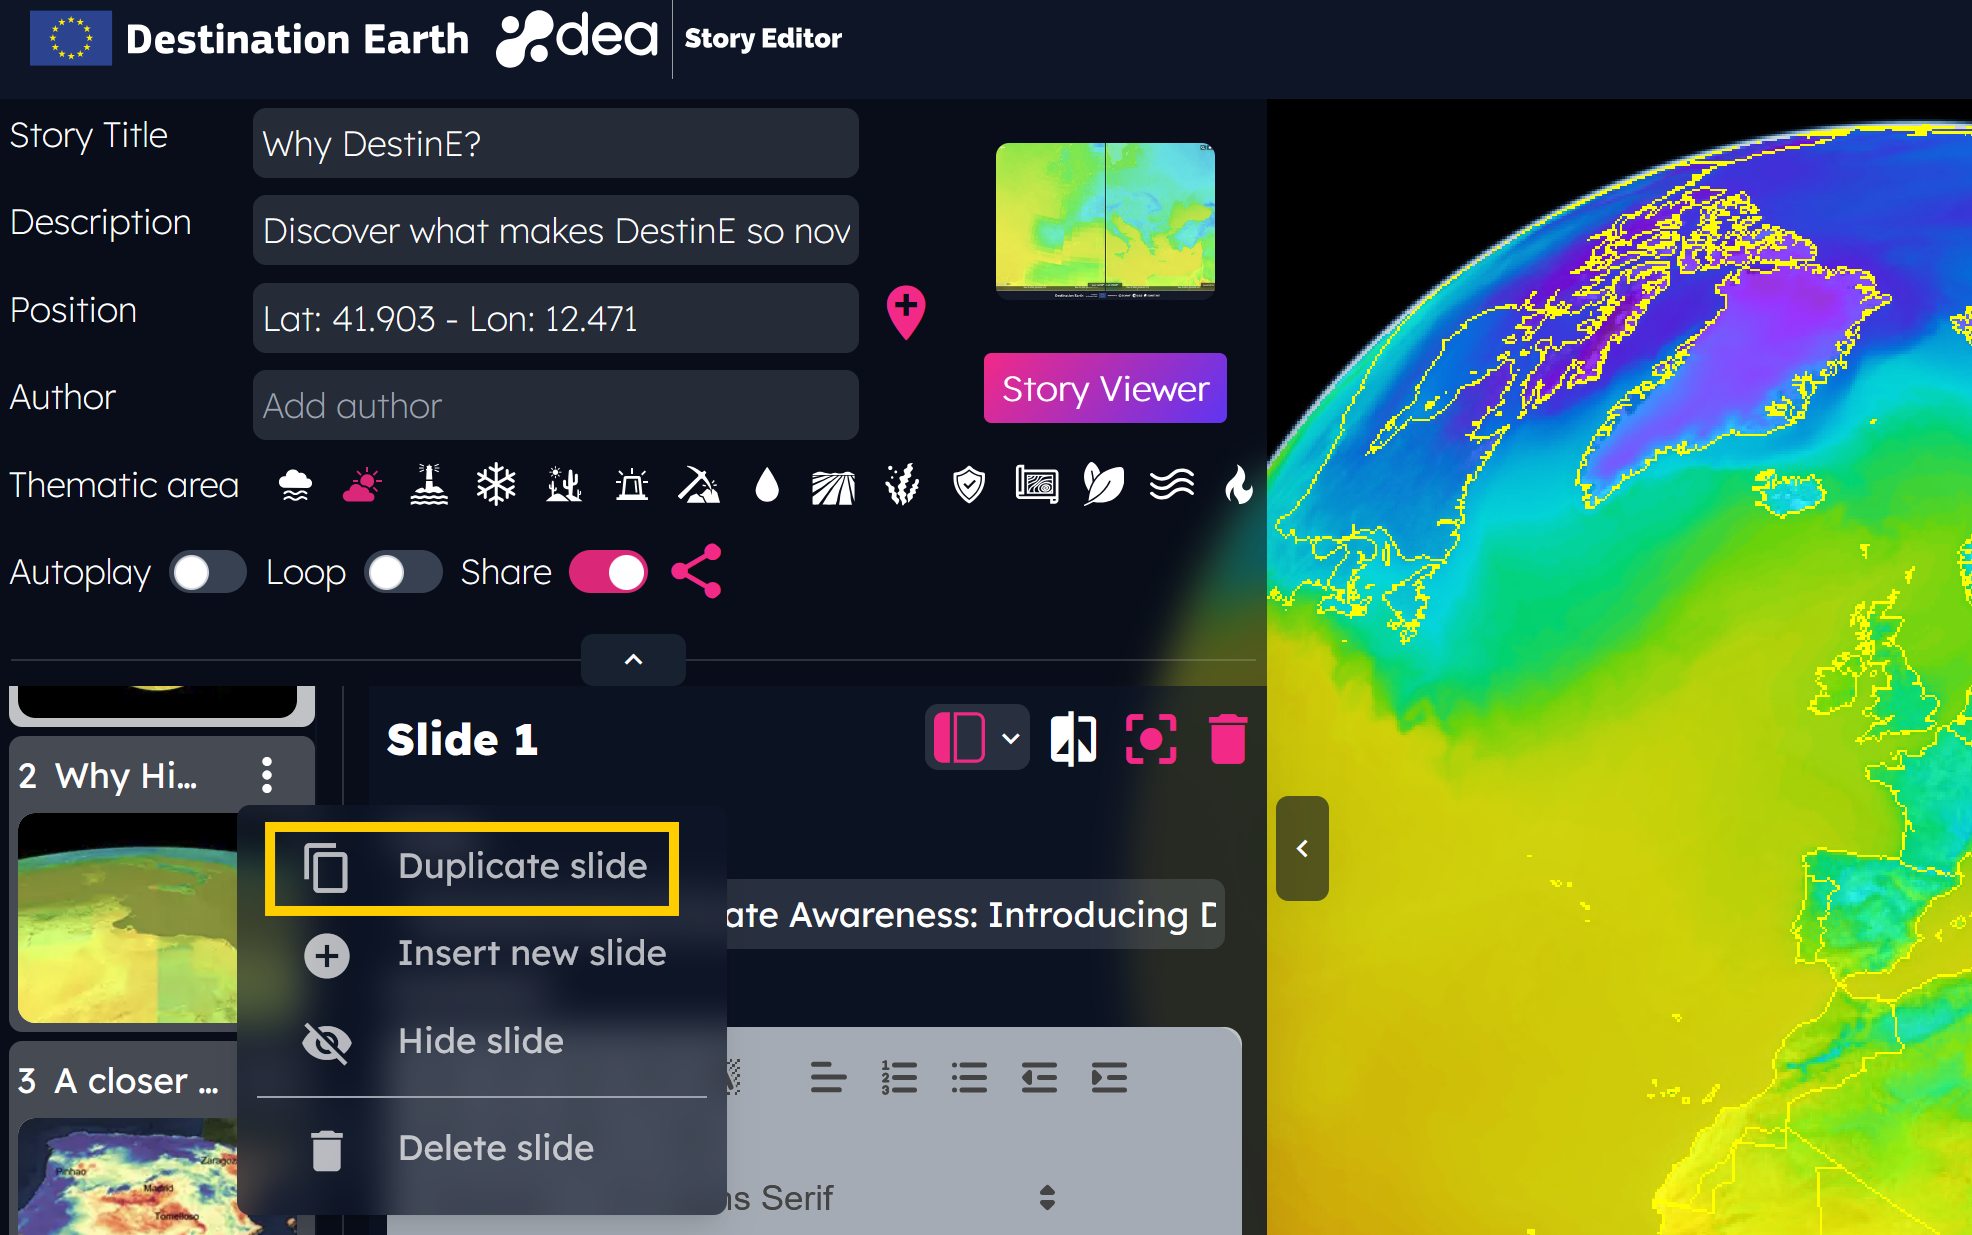
The slide menu is shown by clicking the ⋮ button on the slide preview.
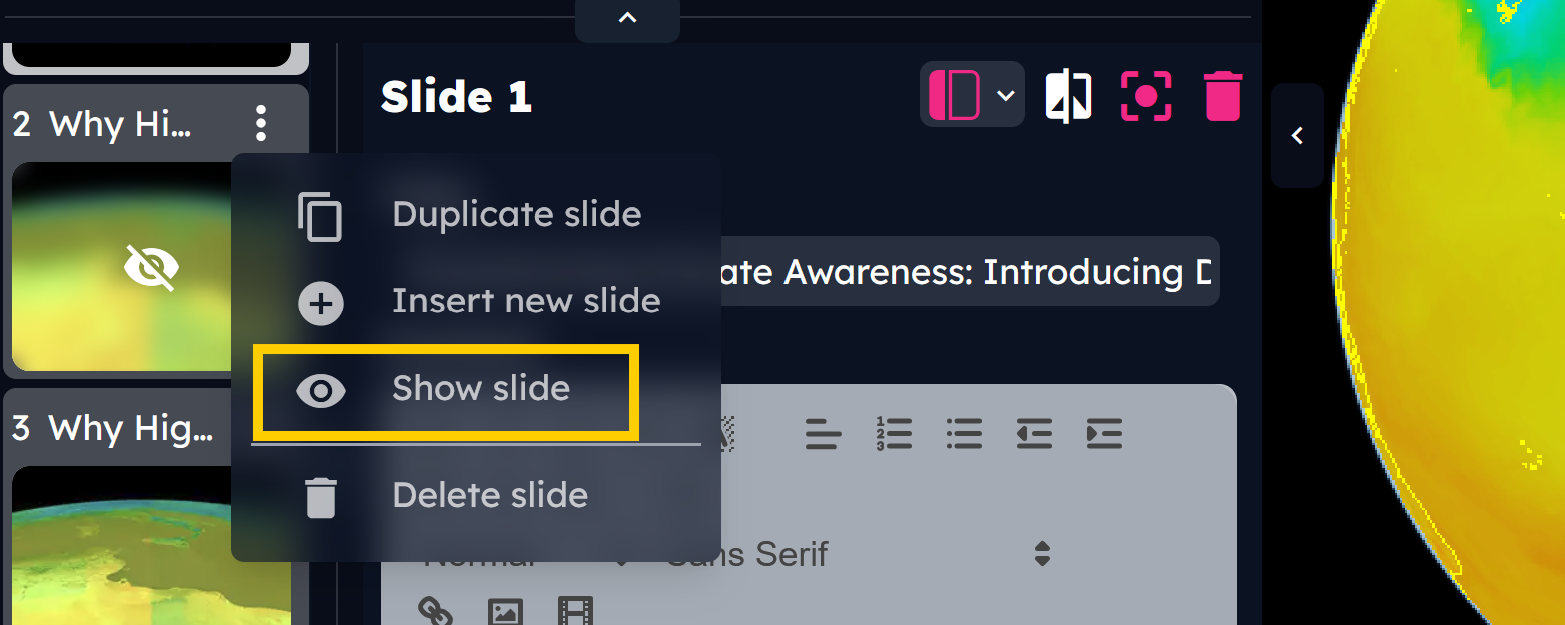
Slide Show/Hide
With this new feature, users can hide a slide by clicking on the slide menu’s Hide slide option.
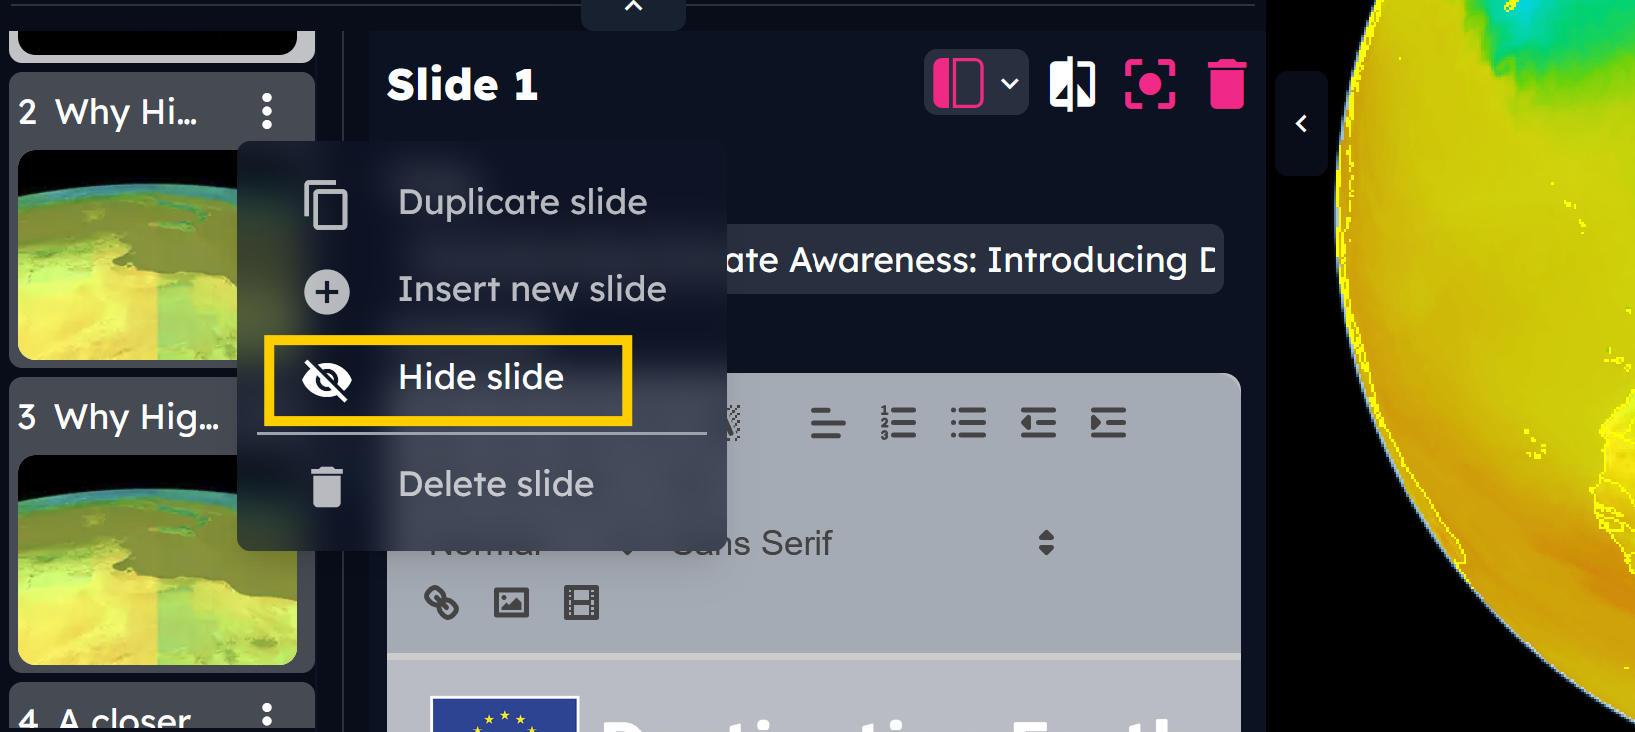
Hidden slides are not shown in the DEA Story Viewer.
It is possible to restore a hidden slide by clicking on the Show slide option of the hidden slide menu.
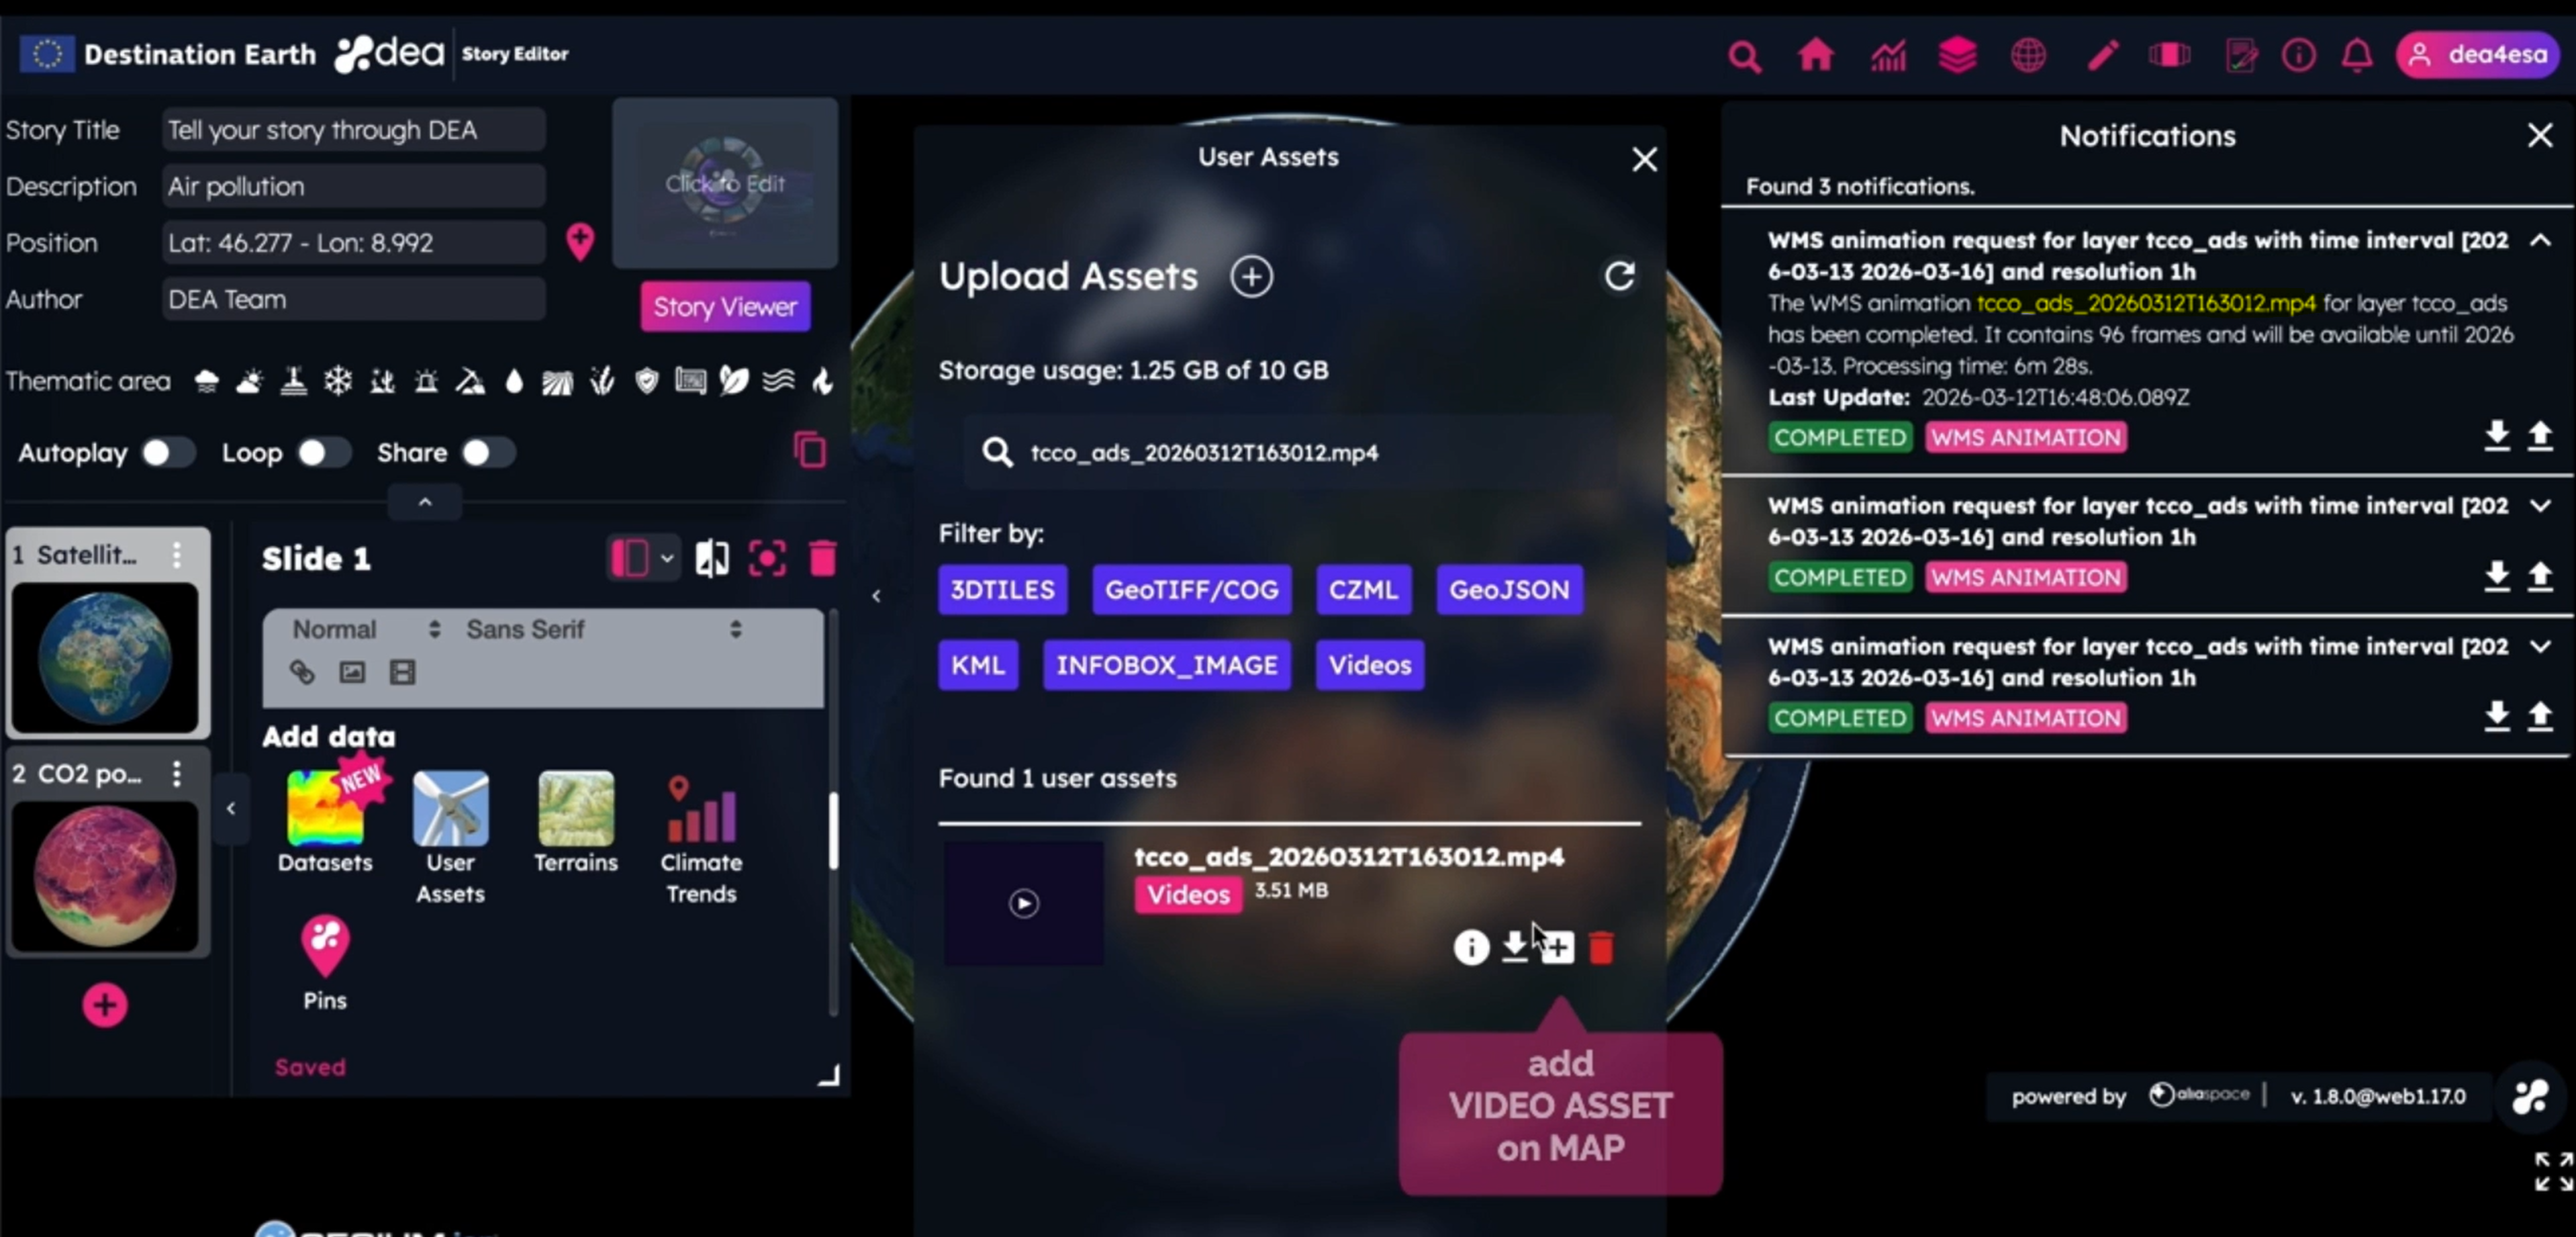
Add user-own assets
As a user registered on the DestinE Platform, users can integrate the DEA data portfolio with their own assets, stored on their private workspace with a size of 10 GB.
Clicking on the User Assets button available in the DEA Story Editor, the list of uploaded files is shown.
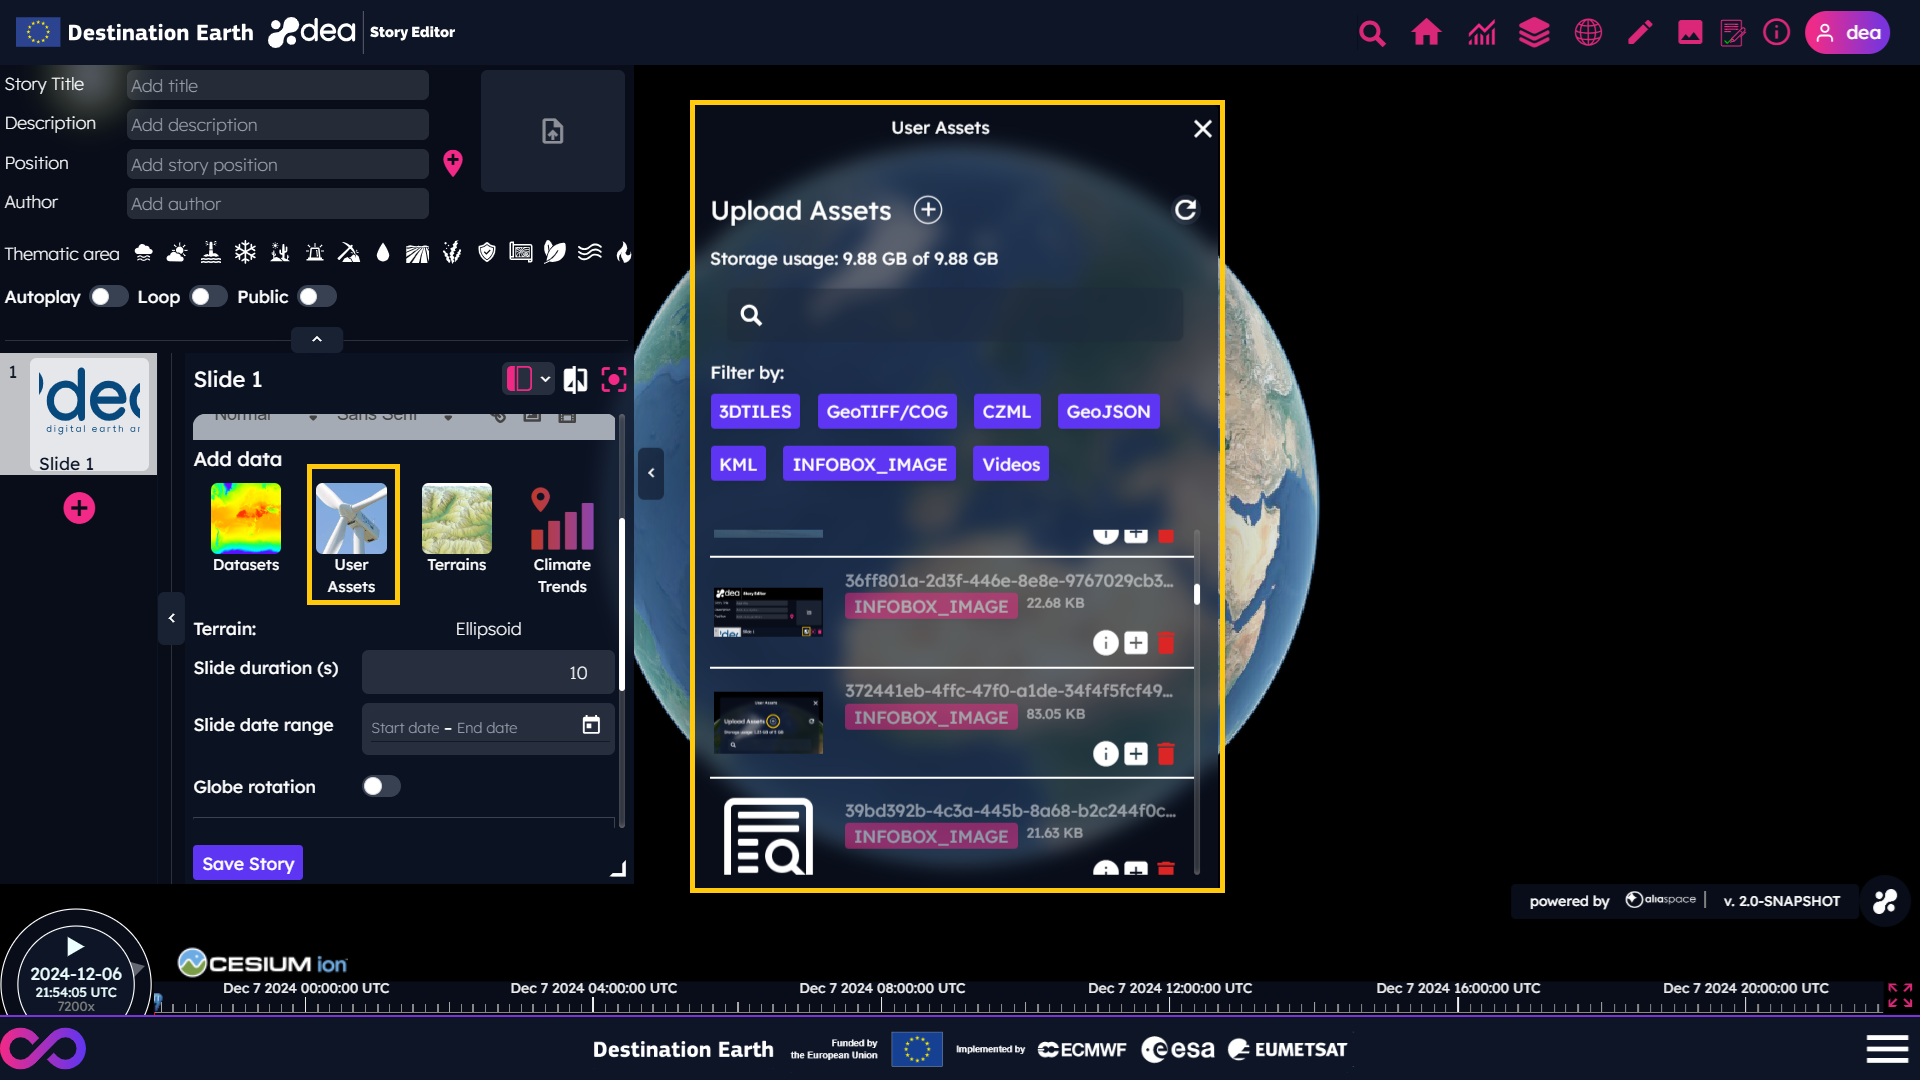
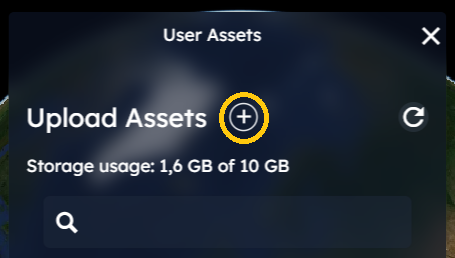
The user can upload his/her assets by clicking on the + button of the User Assets panel and by following the instructions on screen.
By clicking on the info icon  of the User Assets panel, the user can access the details and a preview of an already uploaded asset.
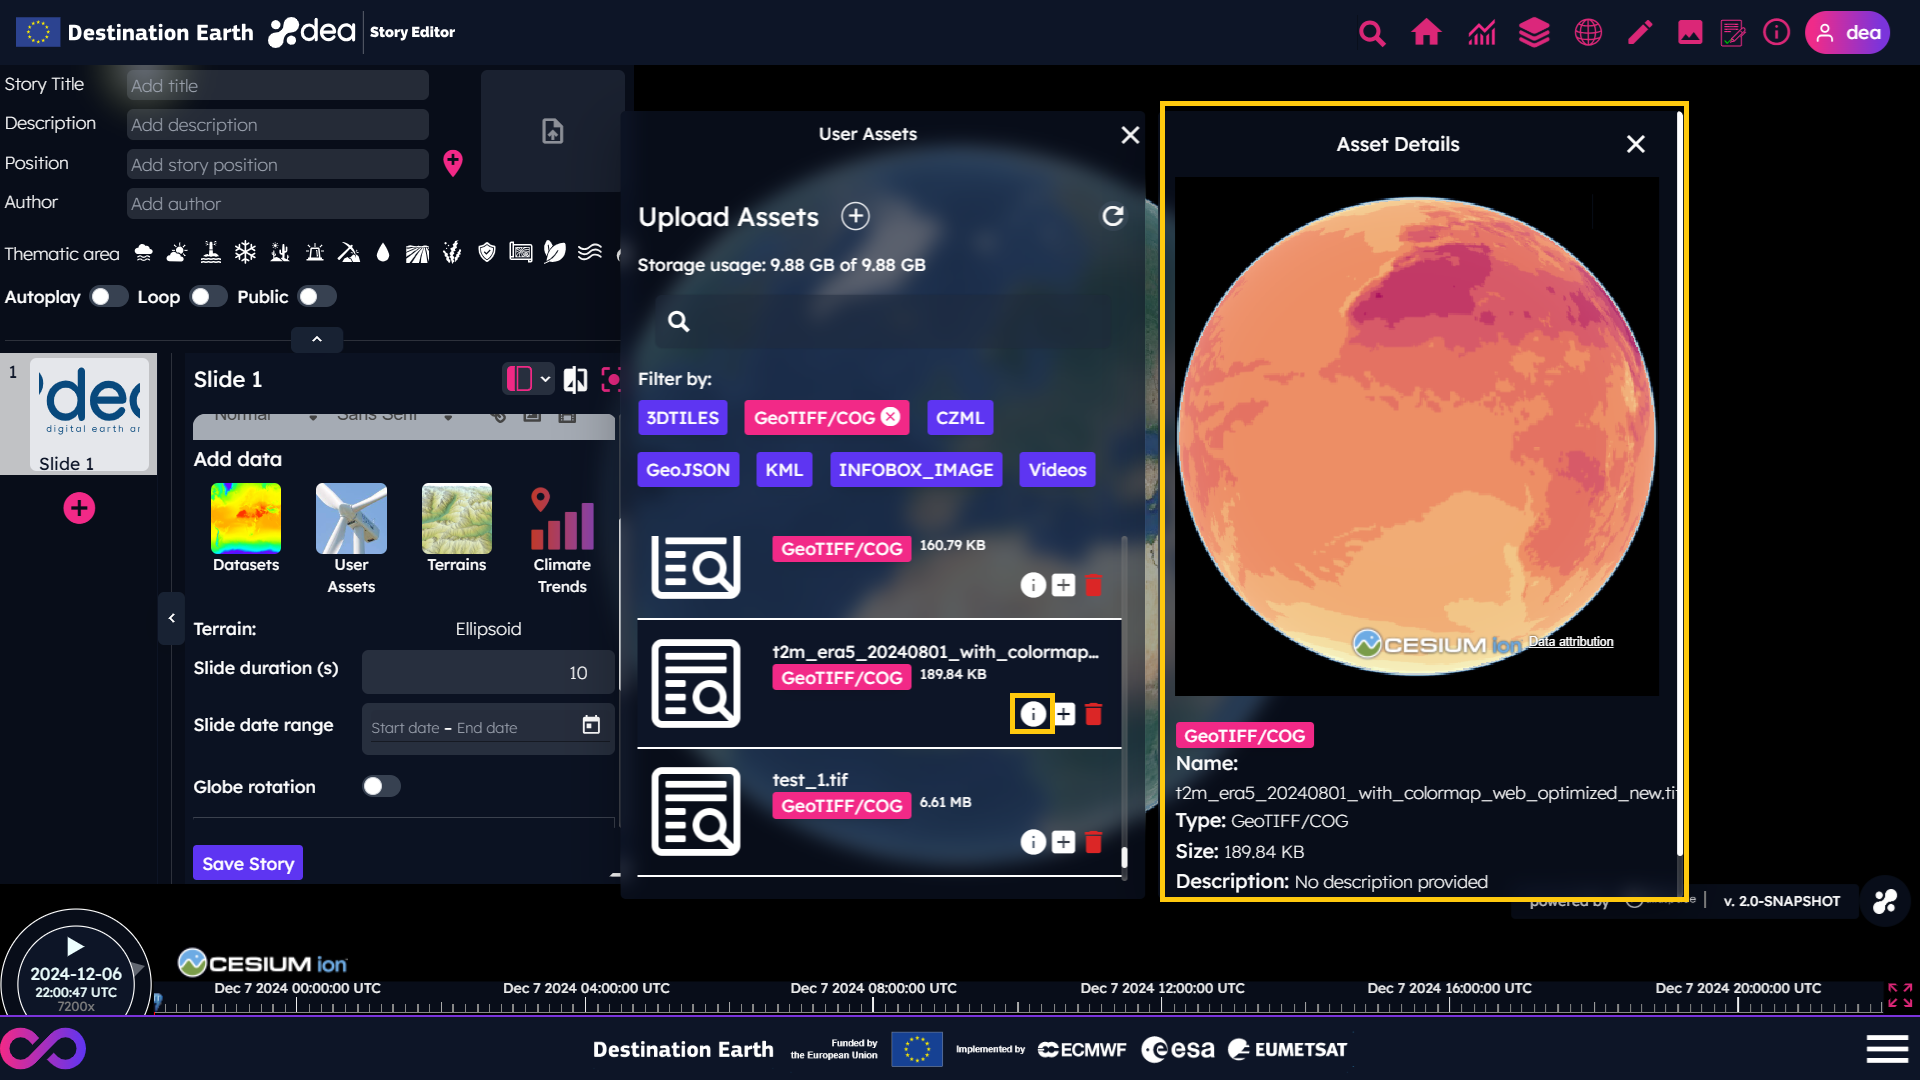
The types of supported assets, as shown in the filter section of the User Assets panel, are:
3D models in GLB (Graphics Library Transmission Format Binary) format
Vector formats such as GeoJSON, TopoJSON, KML (Keyhole Markup Language) and CZML (Cesium Language)
Videos [3] in MP4, QuickTime File Format or WebM formats (please note that the videos accessed from the User Assets panel will be uploaded on the 2D/3D map)
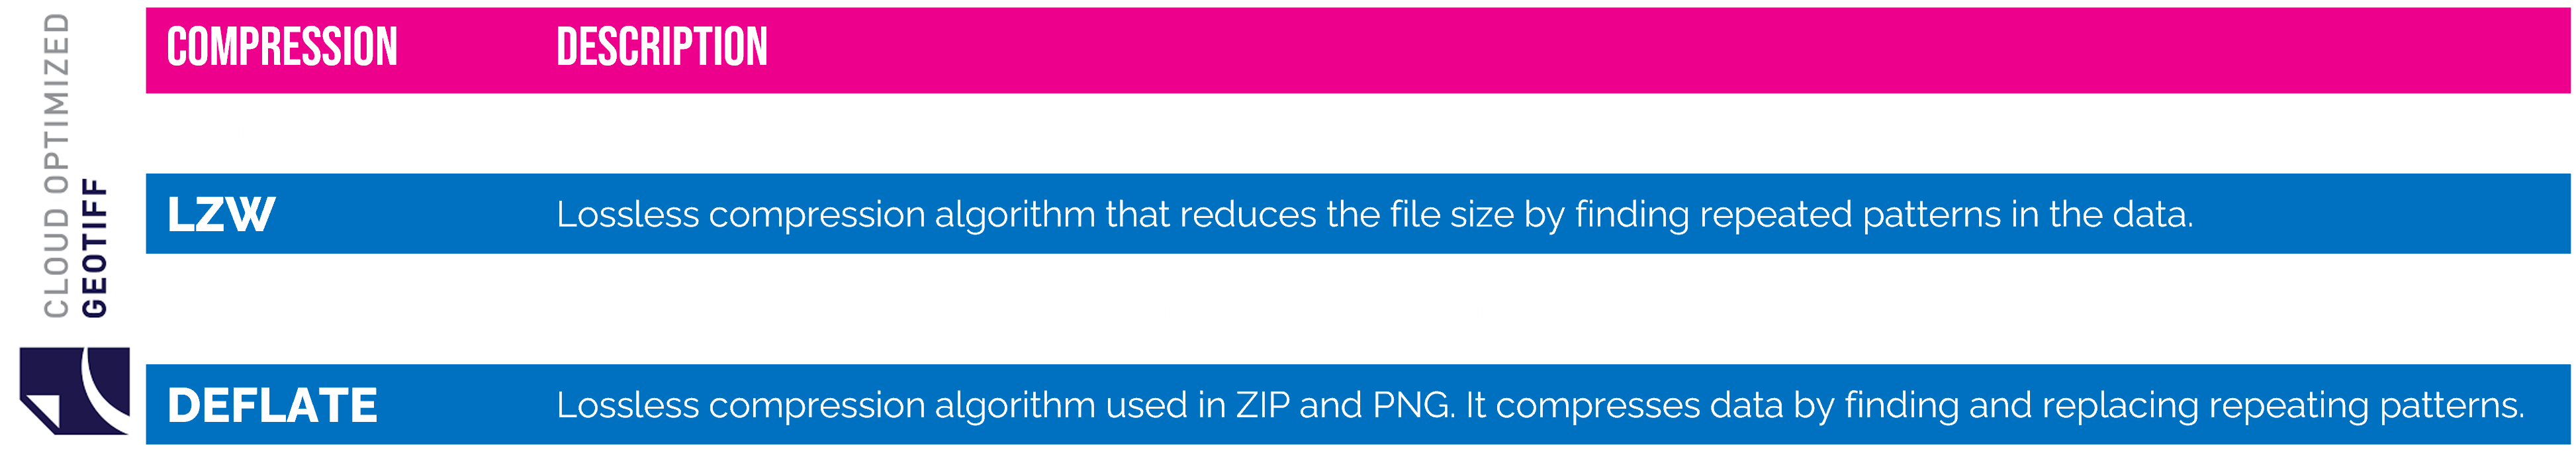
Cloud Optimized GeoTIFF (COG), with the compressions listed below [4]
 The comparison feature is supported only for assets of type Cloud Optimized GeoTIFF.
An example of how to create a raster time series from raster files is available on an INSULA’s Notebook.
Note
Please note that DEA supports only the WGS 84 Coordinate Reference System (CRS) for Cloud Optimized GeoTIFF.
If your COG files are not using WGS 84 as CRS, you should apply a proper transformation.
With GDAL, the commands useful to convert a GeoTIFF file in a WGS 84 COG file are:
1. Convert to WGS 84 projection
gdalwarp -t_srs EPSG:4326 input.tif output_4326.tif
2. Convert to COG format
gdal_translate input.tif output_cog.tif -of COG -co COMPRESS=LZW -co OVERVIEWS=AUTO
Assets containing time information, as KML or CZML, are visualized according to the current time of the timeline. The time window is automatically set based on the overall timespan of the assets added to a slide, so, if time interval do not overlap, it is possible to see only an asset at a time.
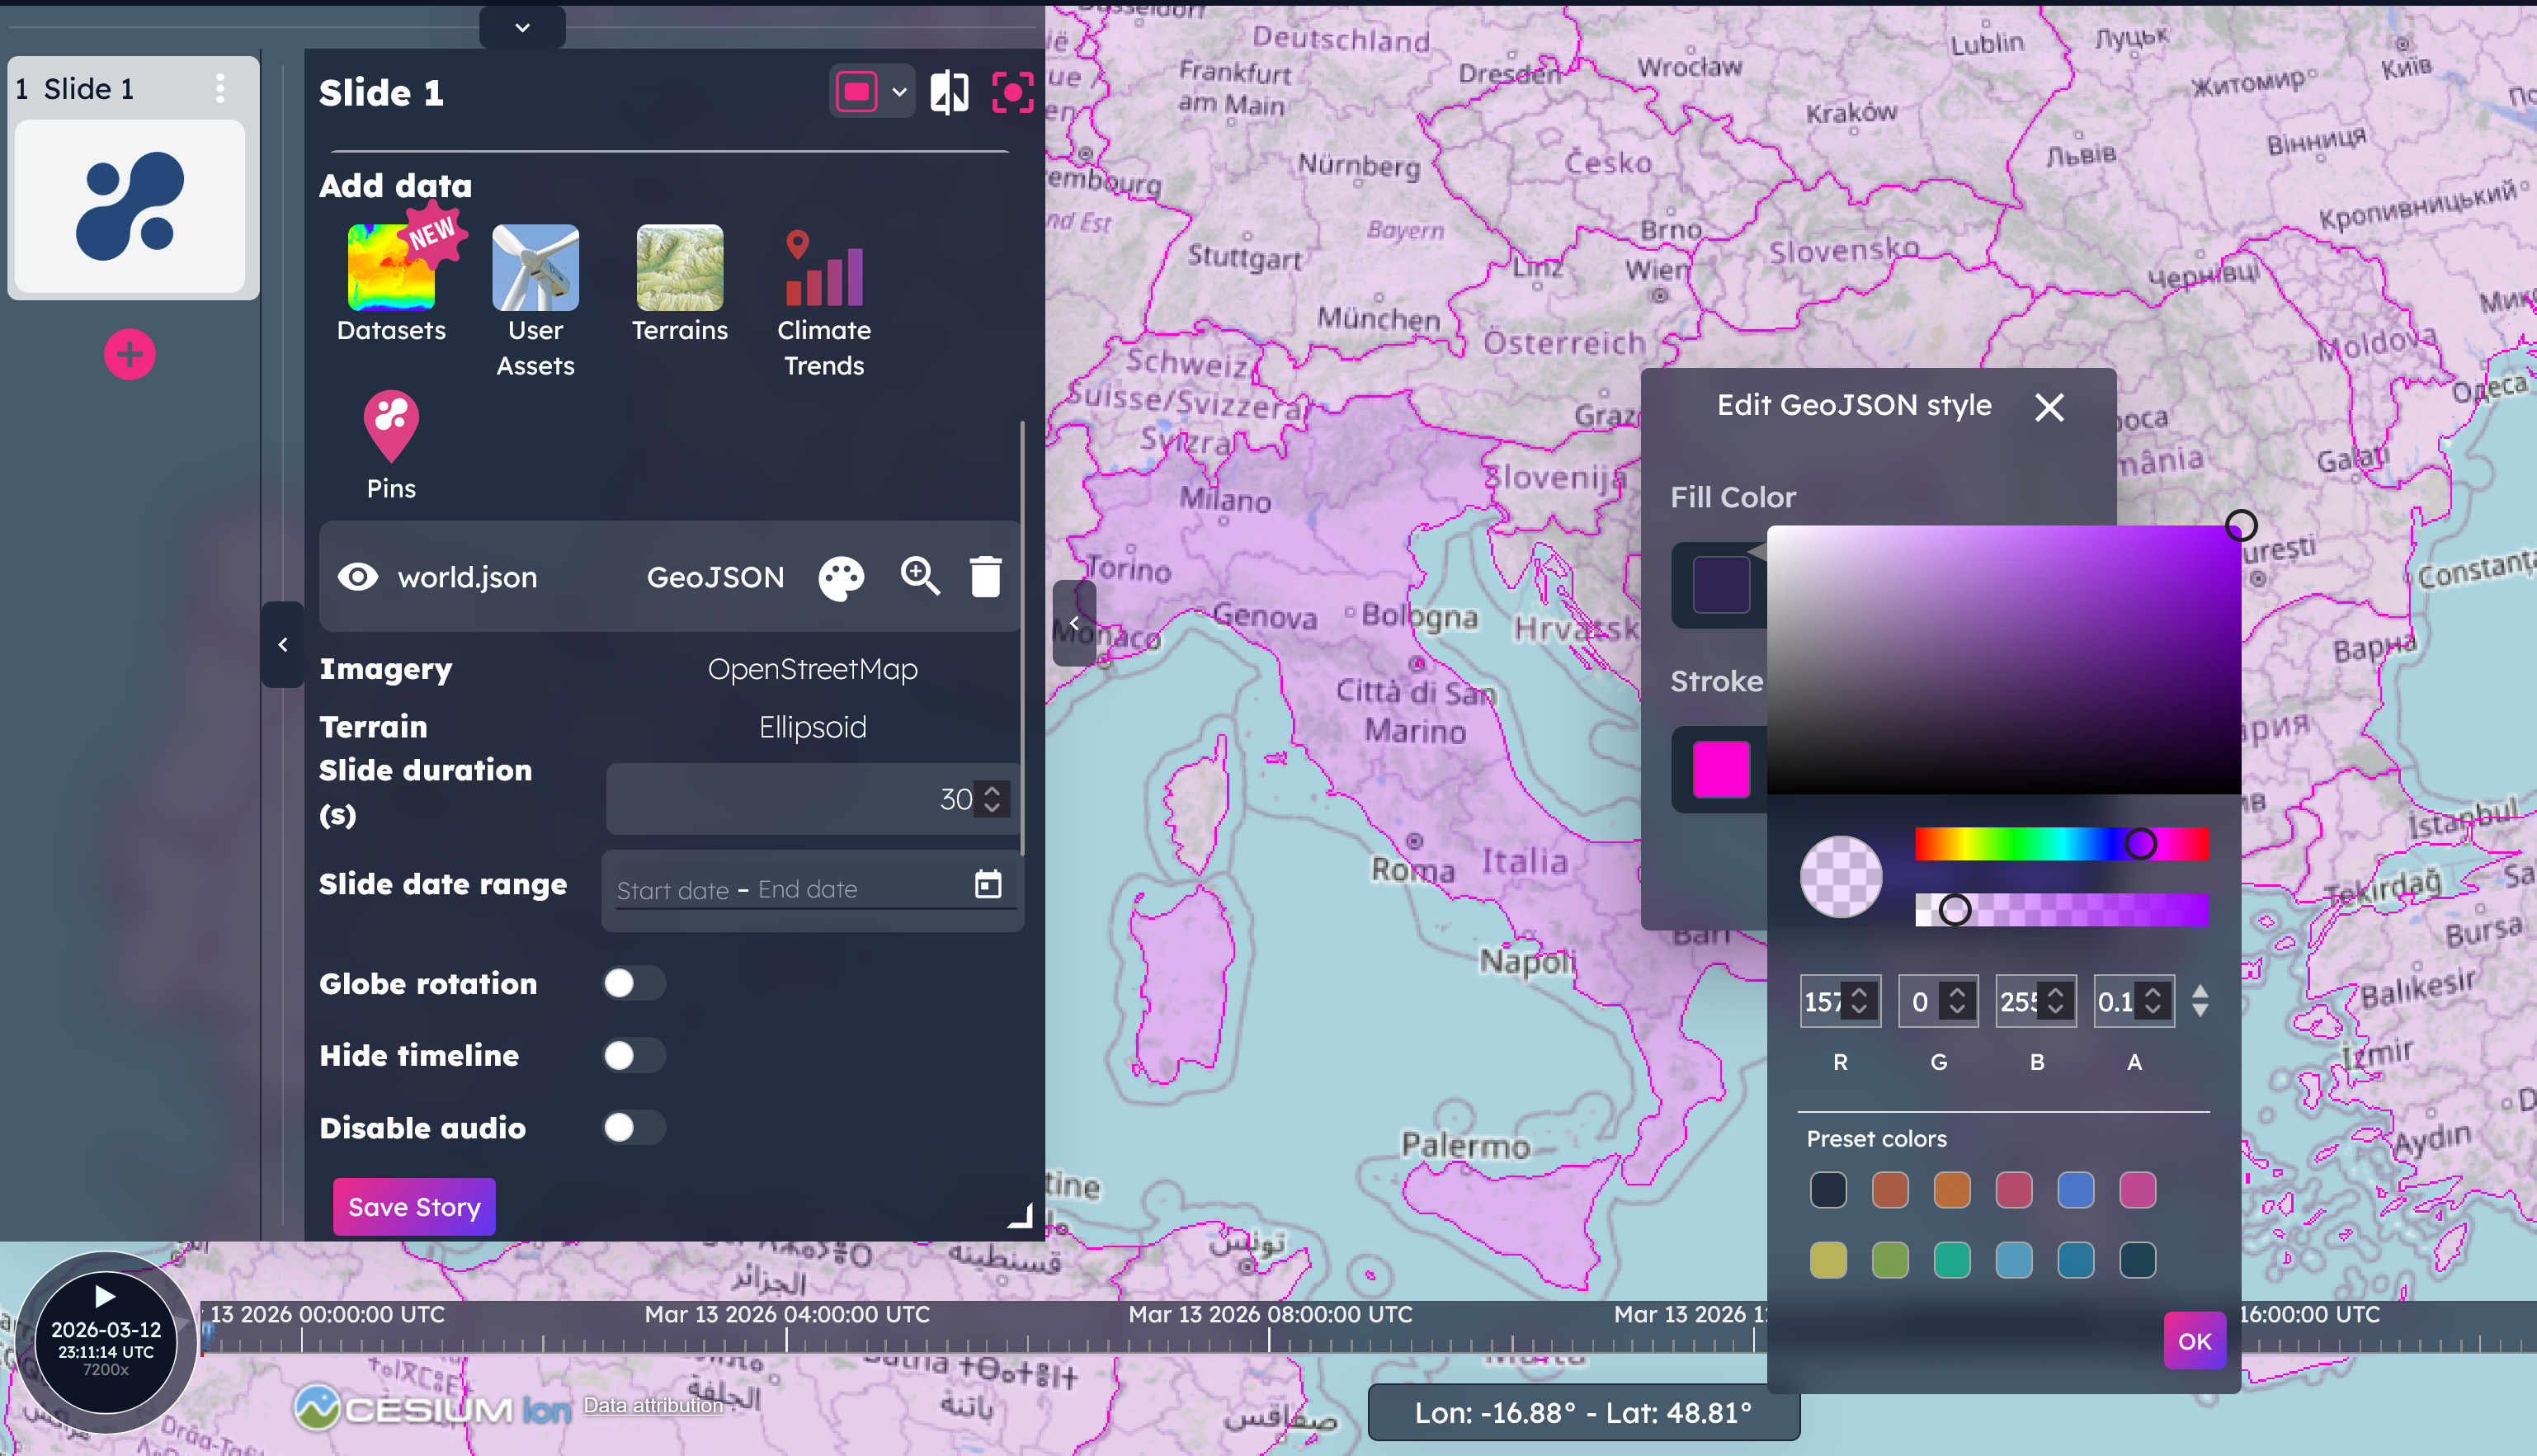
Since the DEA 1.9.0 release, users can customize the stroke and fill color of GeoJSON assets and change the opacity of GeoTIFF/COG files.
Generate plots
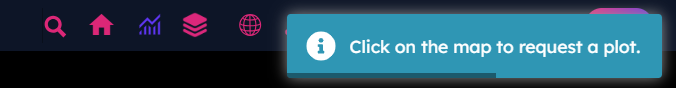
Measures evolve over time! Through DEA, the user can enable the plot feature by selecting the proper icon placed in the header of the Story Editor. Please note that it is needed to add on the map a measure of interest from the Datasets panel before asking for the corresponding plot generation.

Once the plot feature is enabled, the user can click on a location on the map to trigger the generation of the plot.
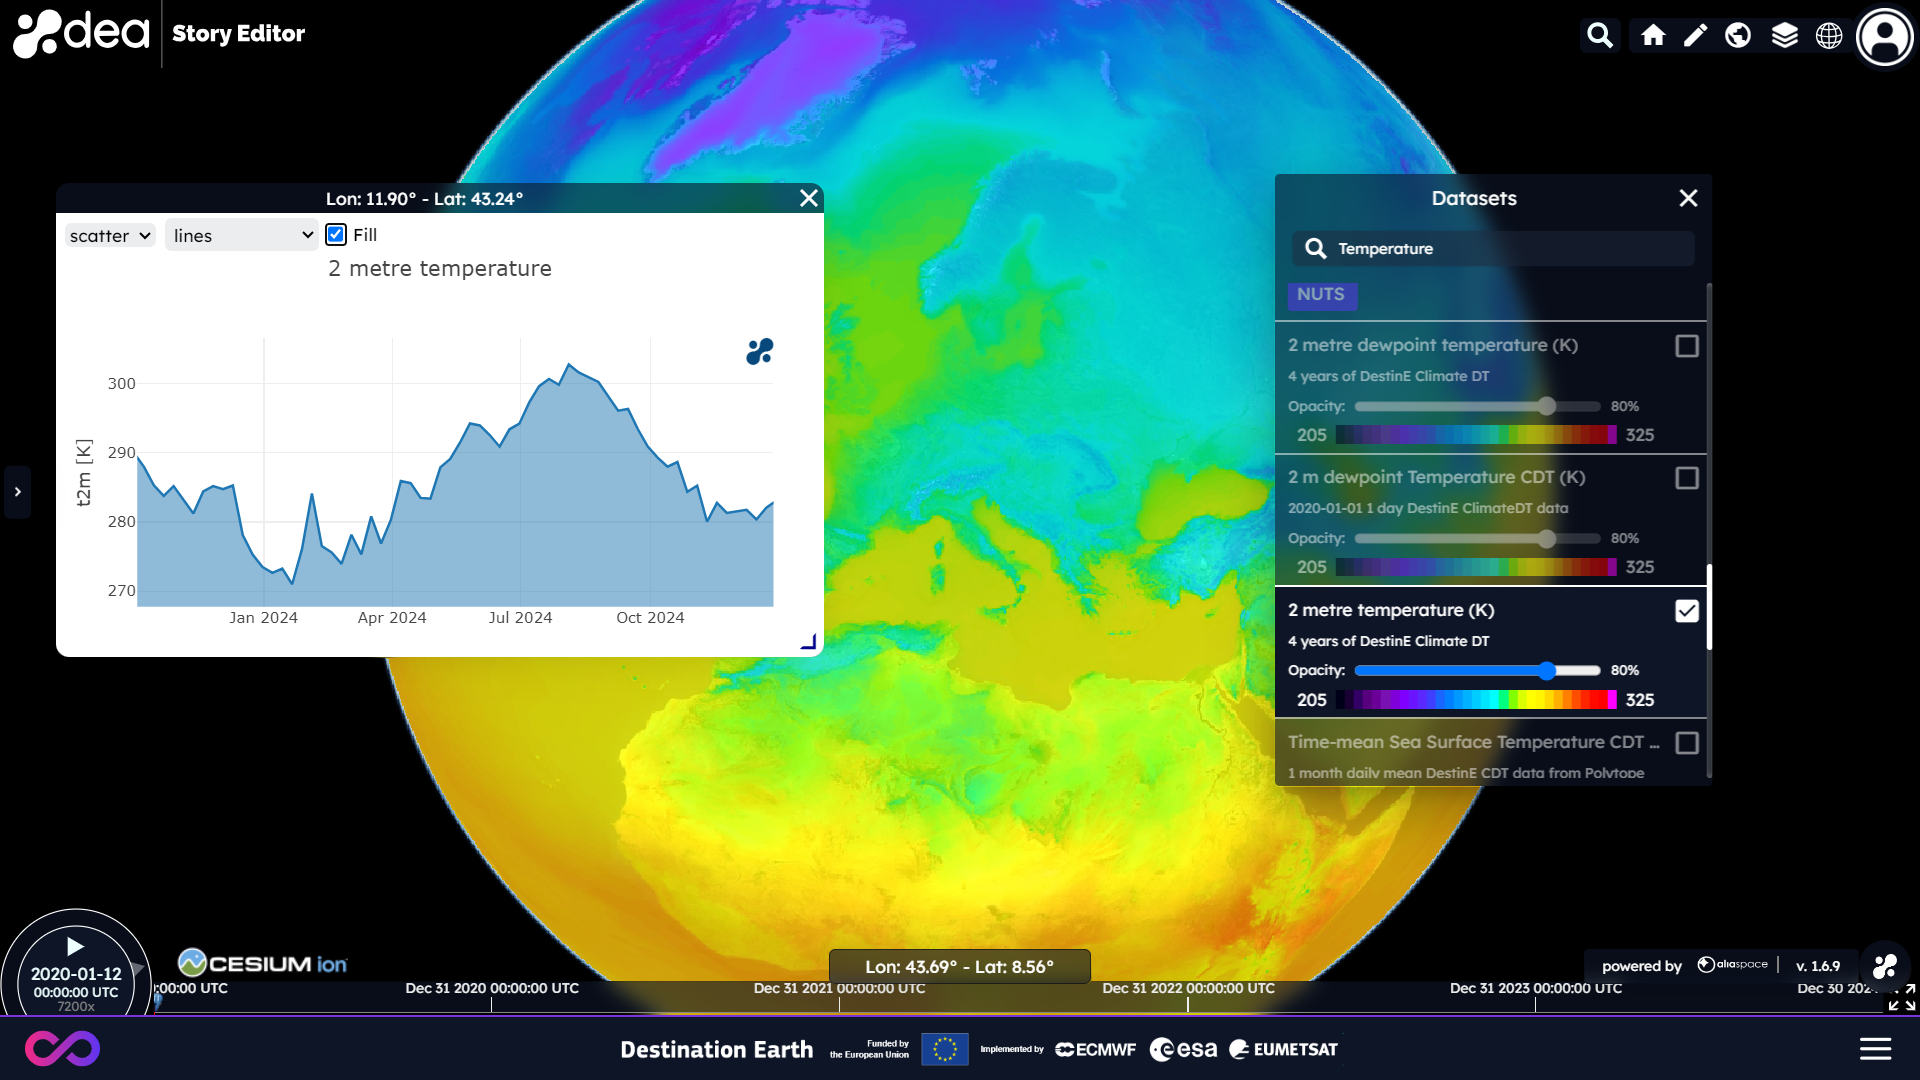
Please note that the time window available to achieve this is limited. If the time window expires, please click again on the plot icon to re-enable the feature.
The plots can be added in the rich text editor to be displayed in the textual section of the story or, in case the user knows how to deal with KML, he/she can add them as markups on the map (click here to get an example of KML editor online).
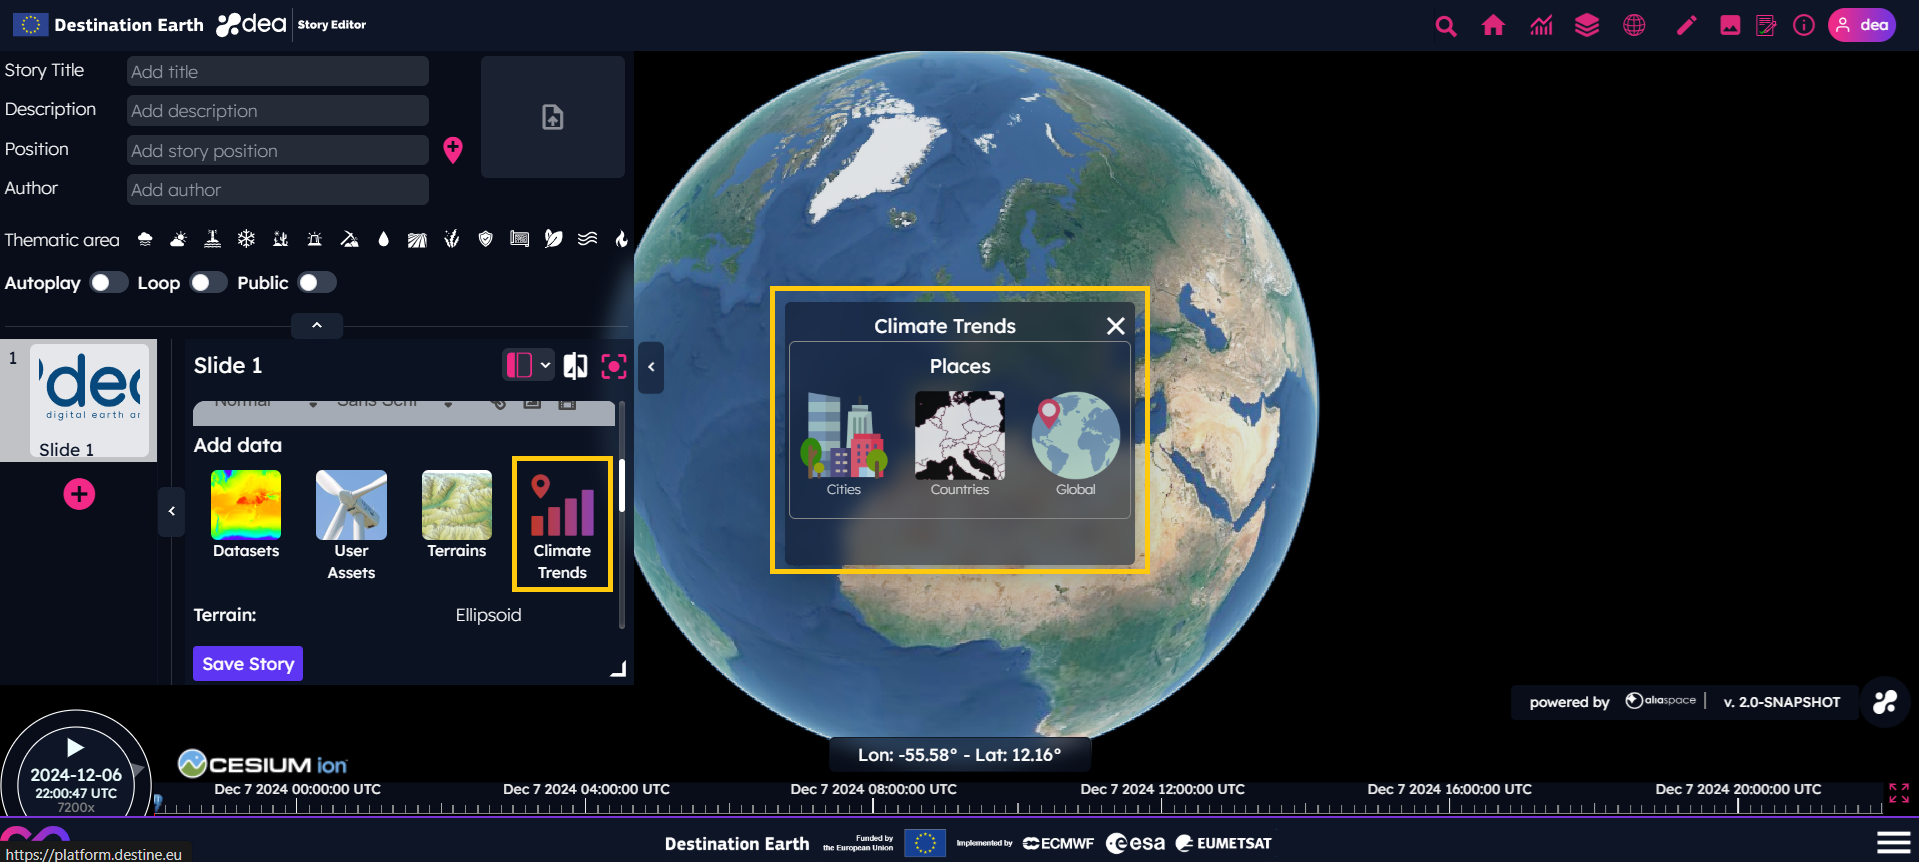
Get Climate Trends
With the new release 1.5.0 of DEA, we provided a fancy tool to support climate change stories with qualitative plots.
By clicking on the Climate Trends button of the DEA Story Editor, the list of places for which this feature is available will appear.
For instance, by clicking on the Climate Trends > Countries button, the countries for which the climate trends are available are highlighted on the map.
Then, a menu with the type of anomaly plots is shown by clicking on one of these countries.
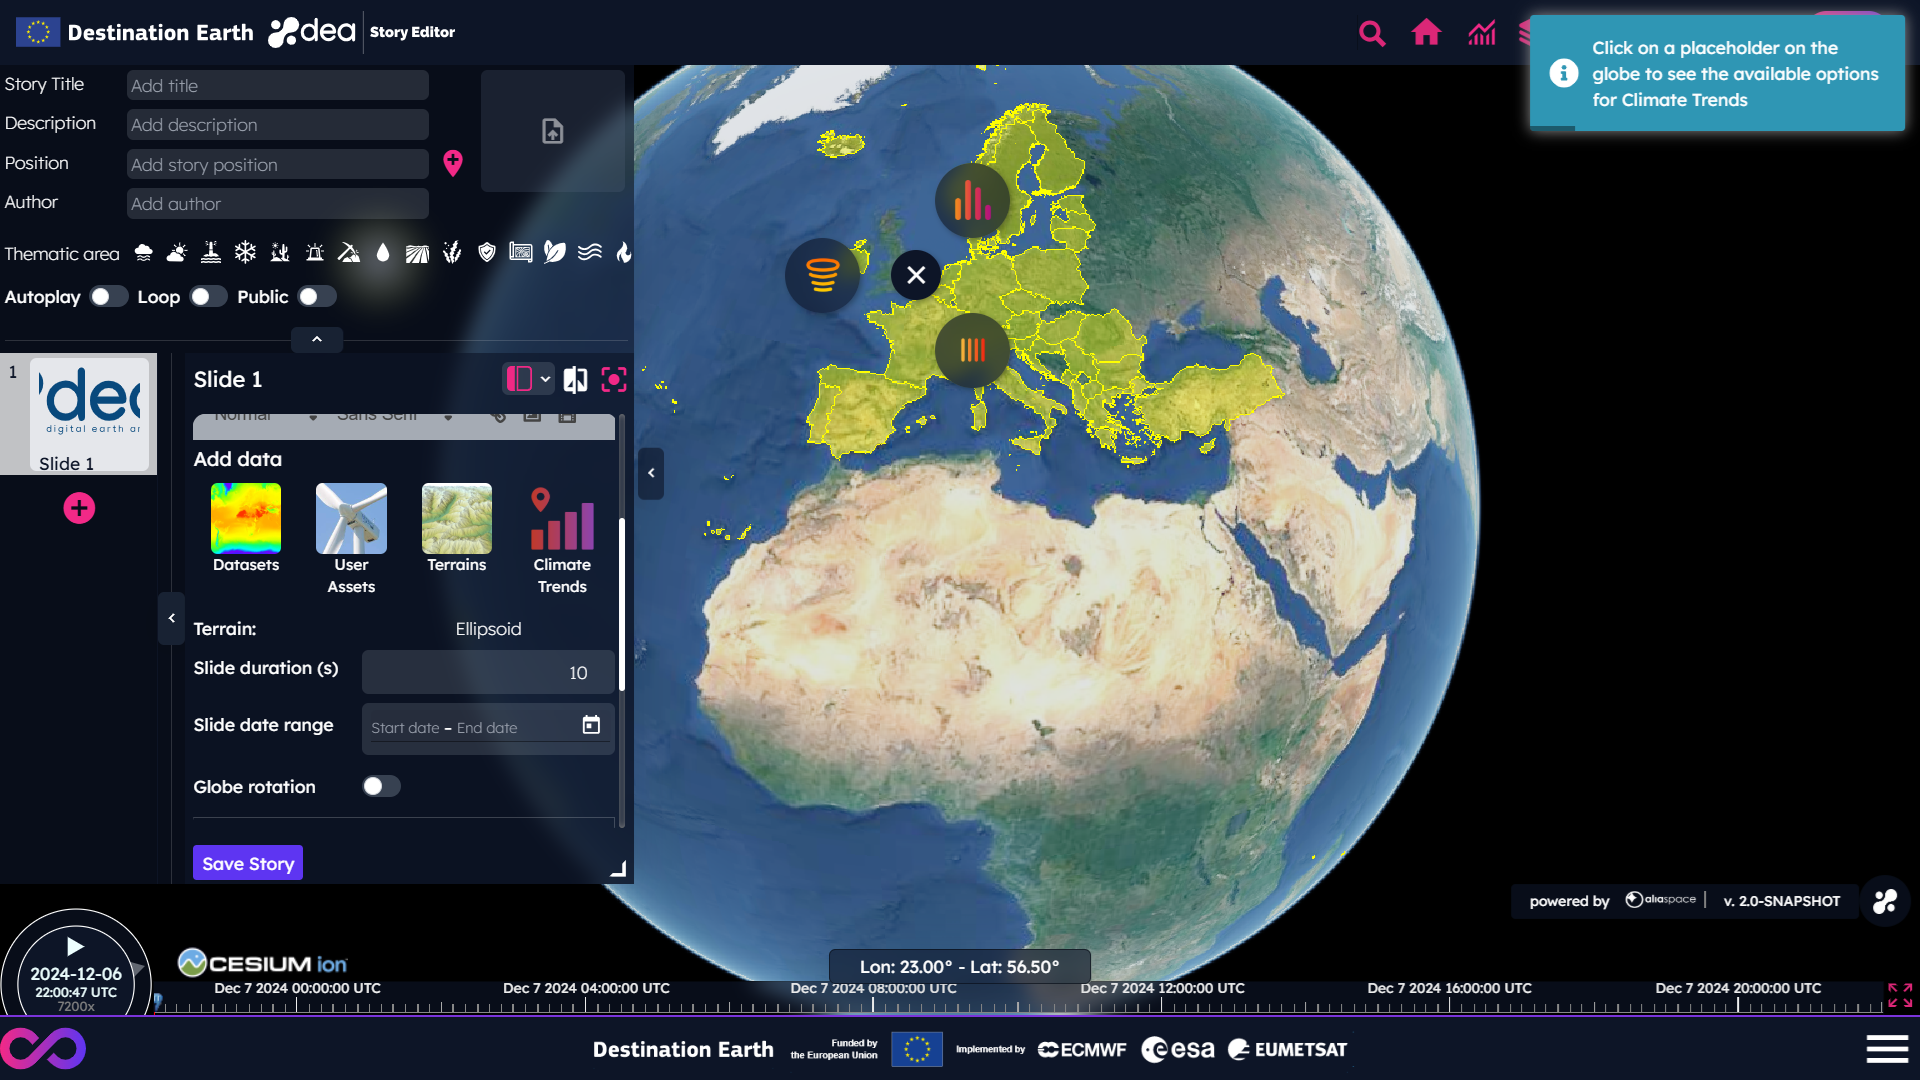
This feature allows to select select:
Spiral plots
Stripes plots
Bar plots
For instance, by selecting the Spiral button, the Climate Spiral of the selected country is shown. Please note that the video option is available only for Climate Spiral plots.
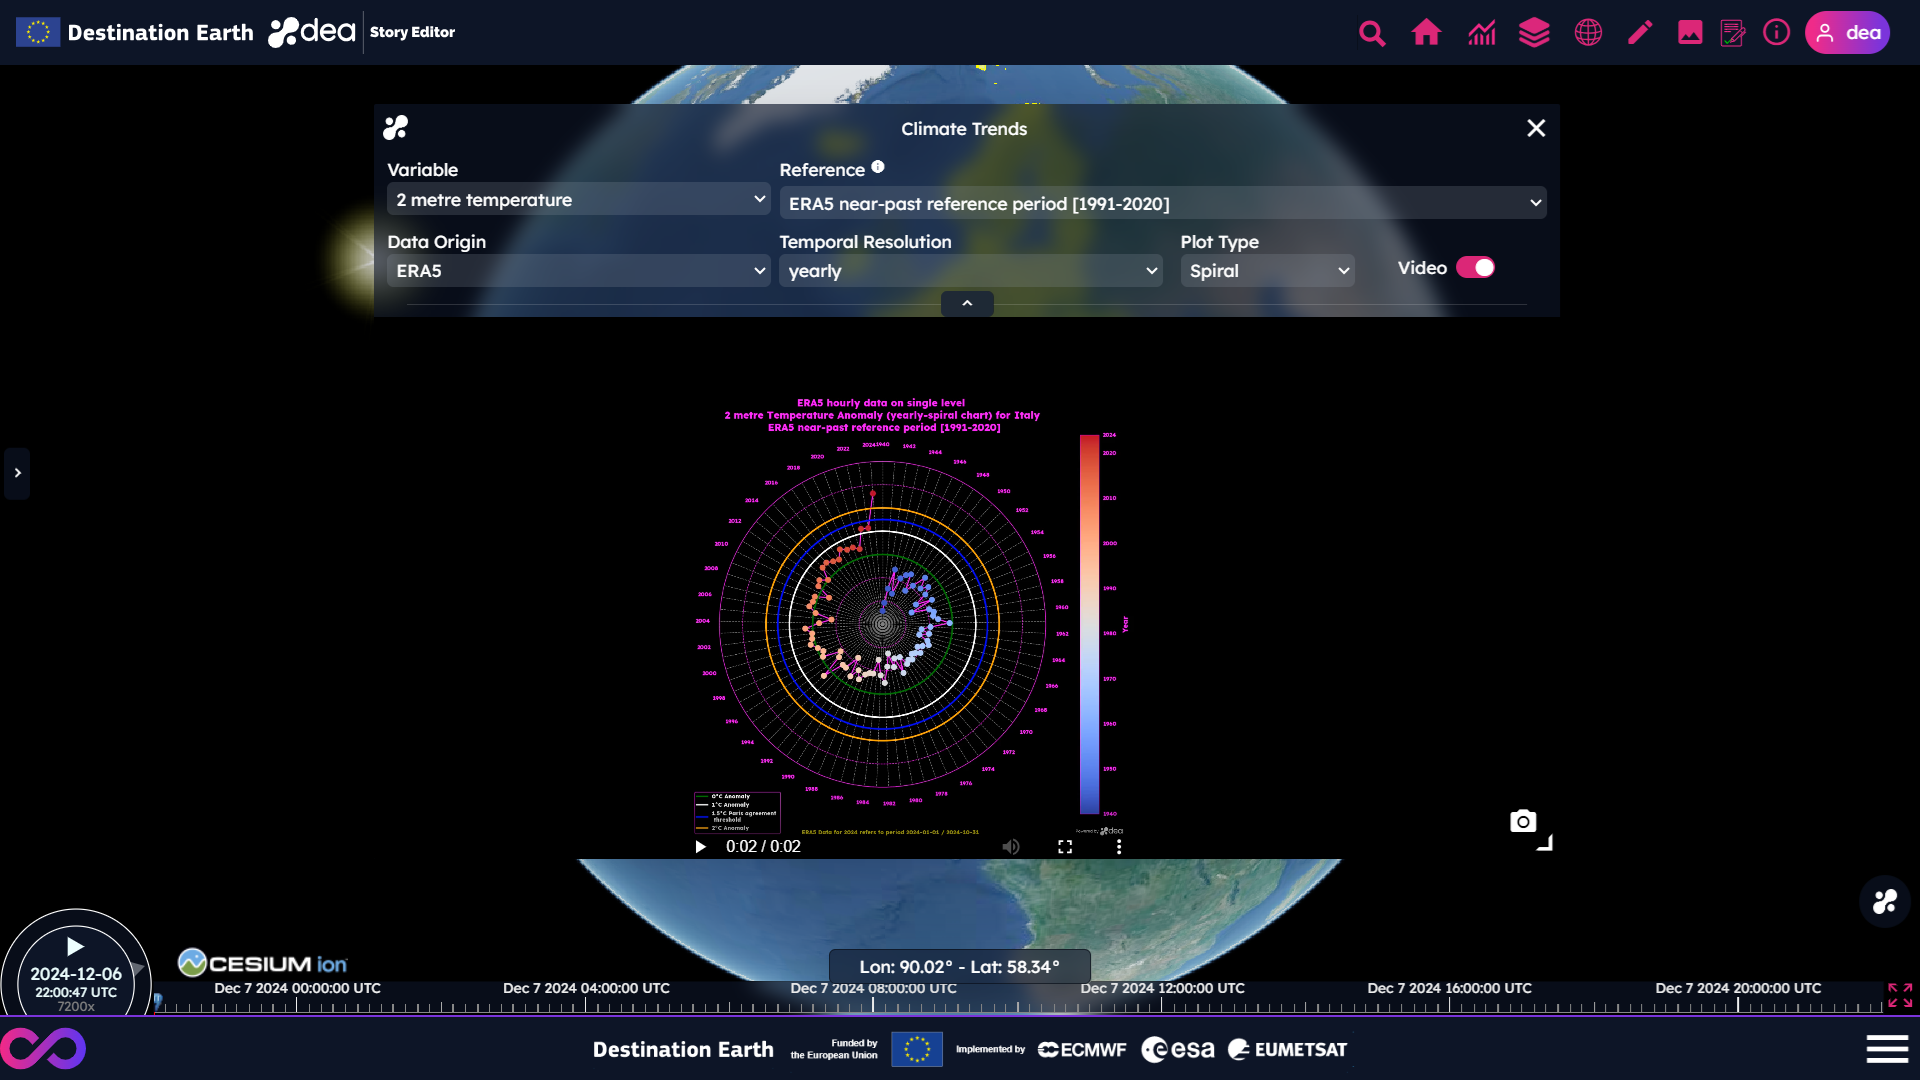
The parameters of the Climate Trends panel can be modified depending on the user’s needs:
The “Variable”, which can be 2 metre temperature or sea surface temperature (the latter only for climate trends on global scale)
The “Reference”, which can be pre-industrial reference period (1850-1900) or near-past reference period (1991-2020)
The “Data Origin”, which can be ERA5, DestinE or a combination of them
The “Temporal Resolution”, which can be yearly or monthly (the latter only for spiral plots)
The “Plot Type”, which can be Spiral, Stripe or Bar
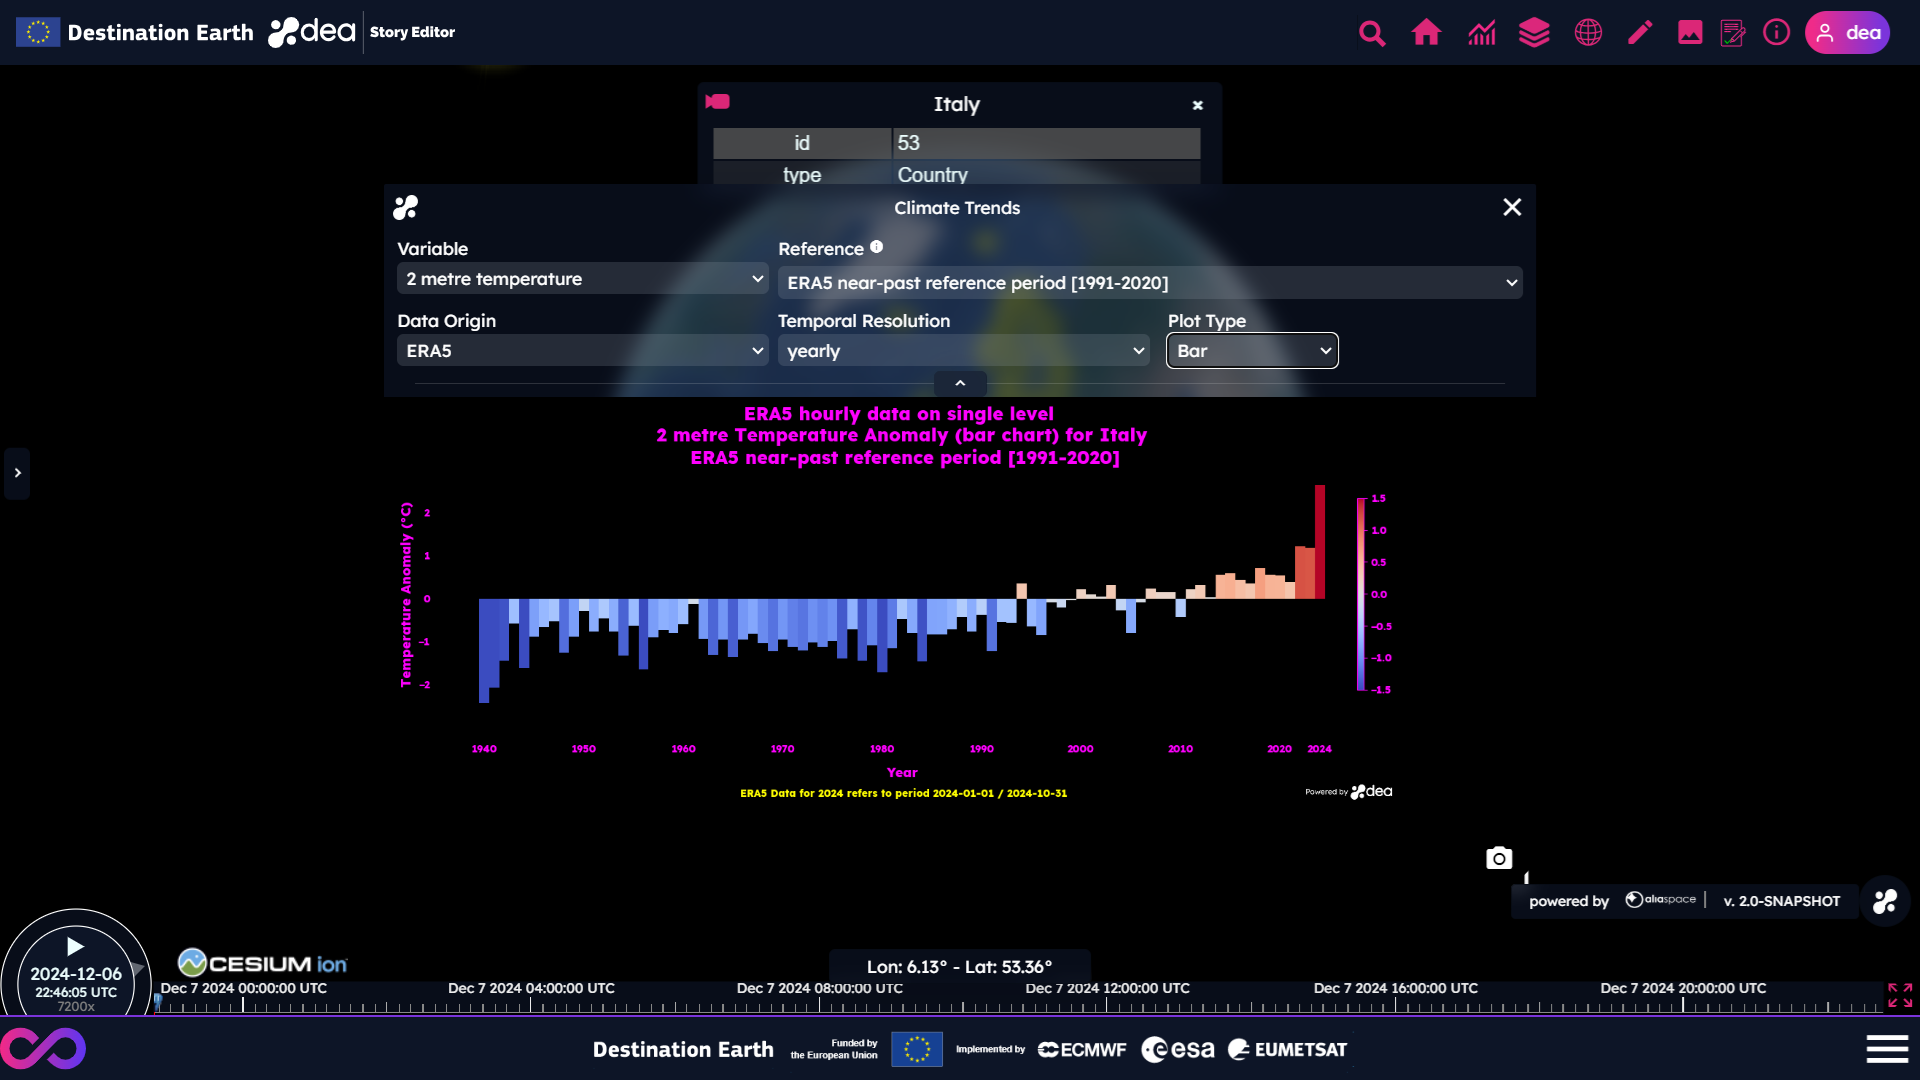
The user can save the trends by clicking on this  icon and use the image or video in his/her stories.
By clicking outside the globe, the current selection of the places is reset.
Map Pins
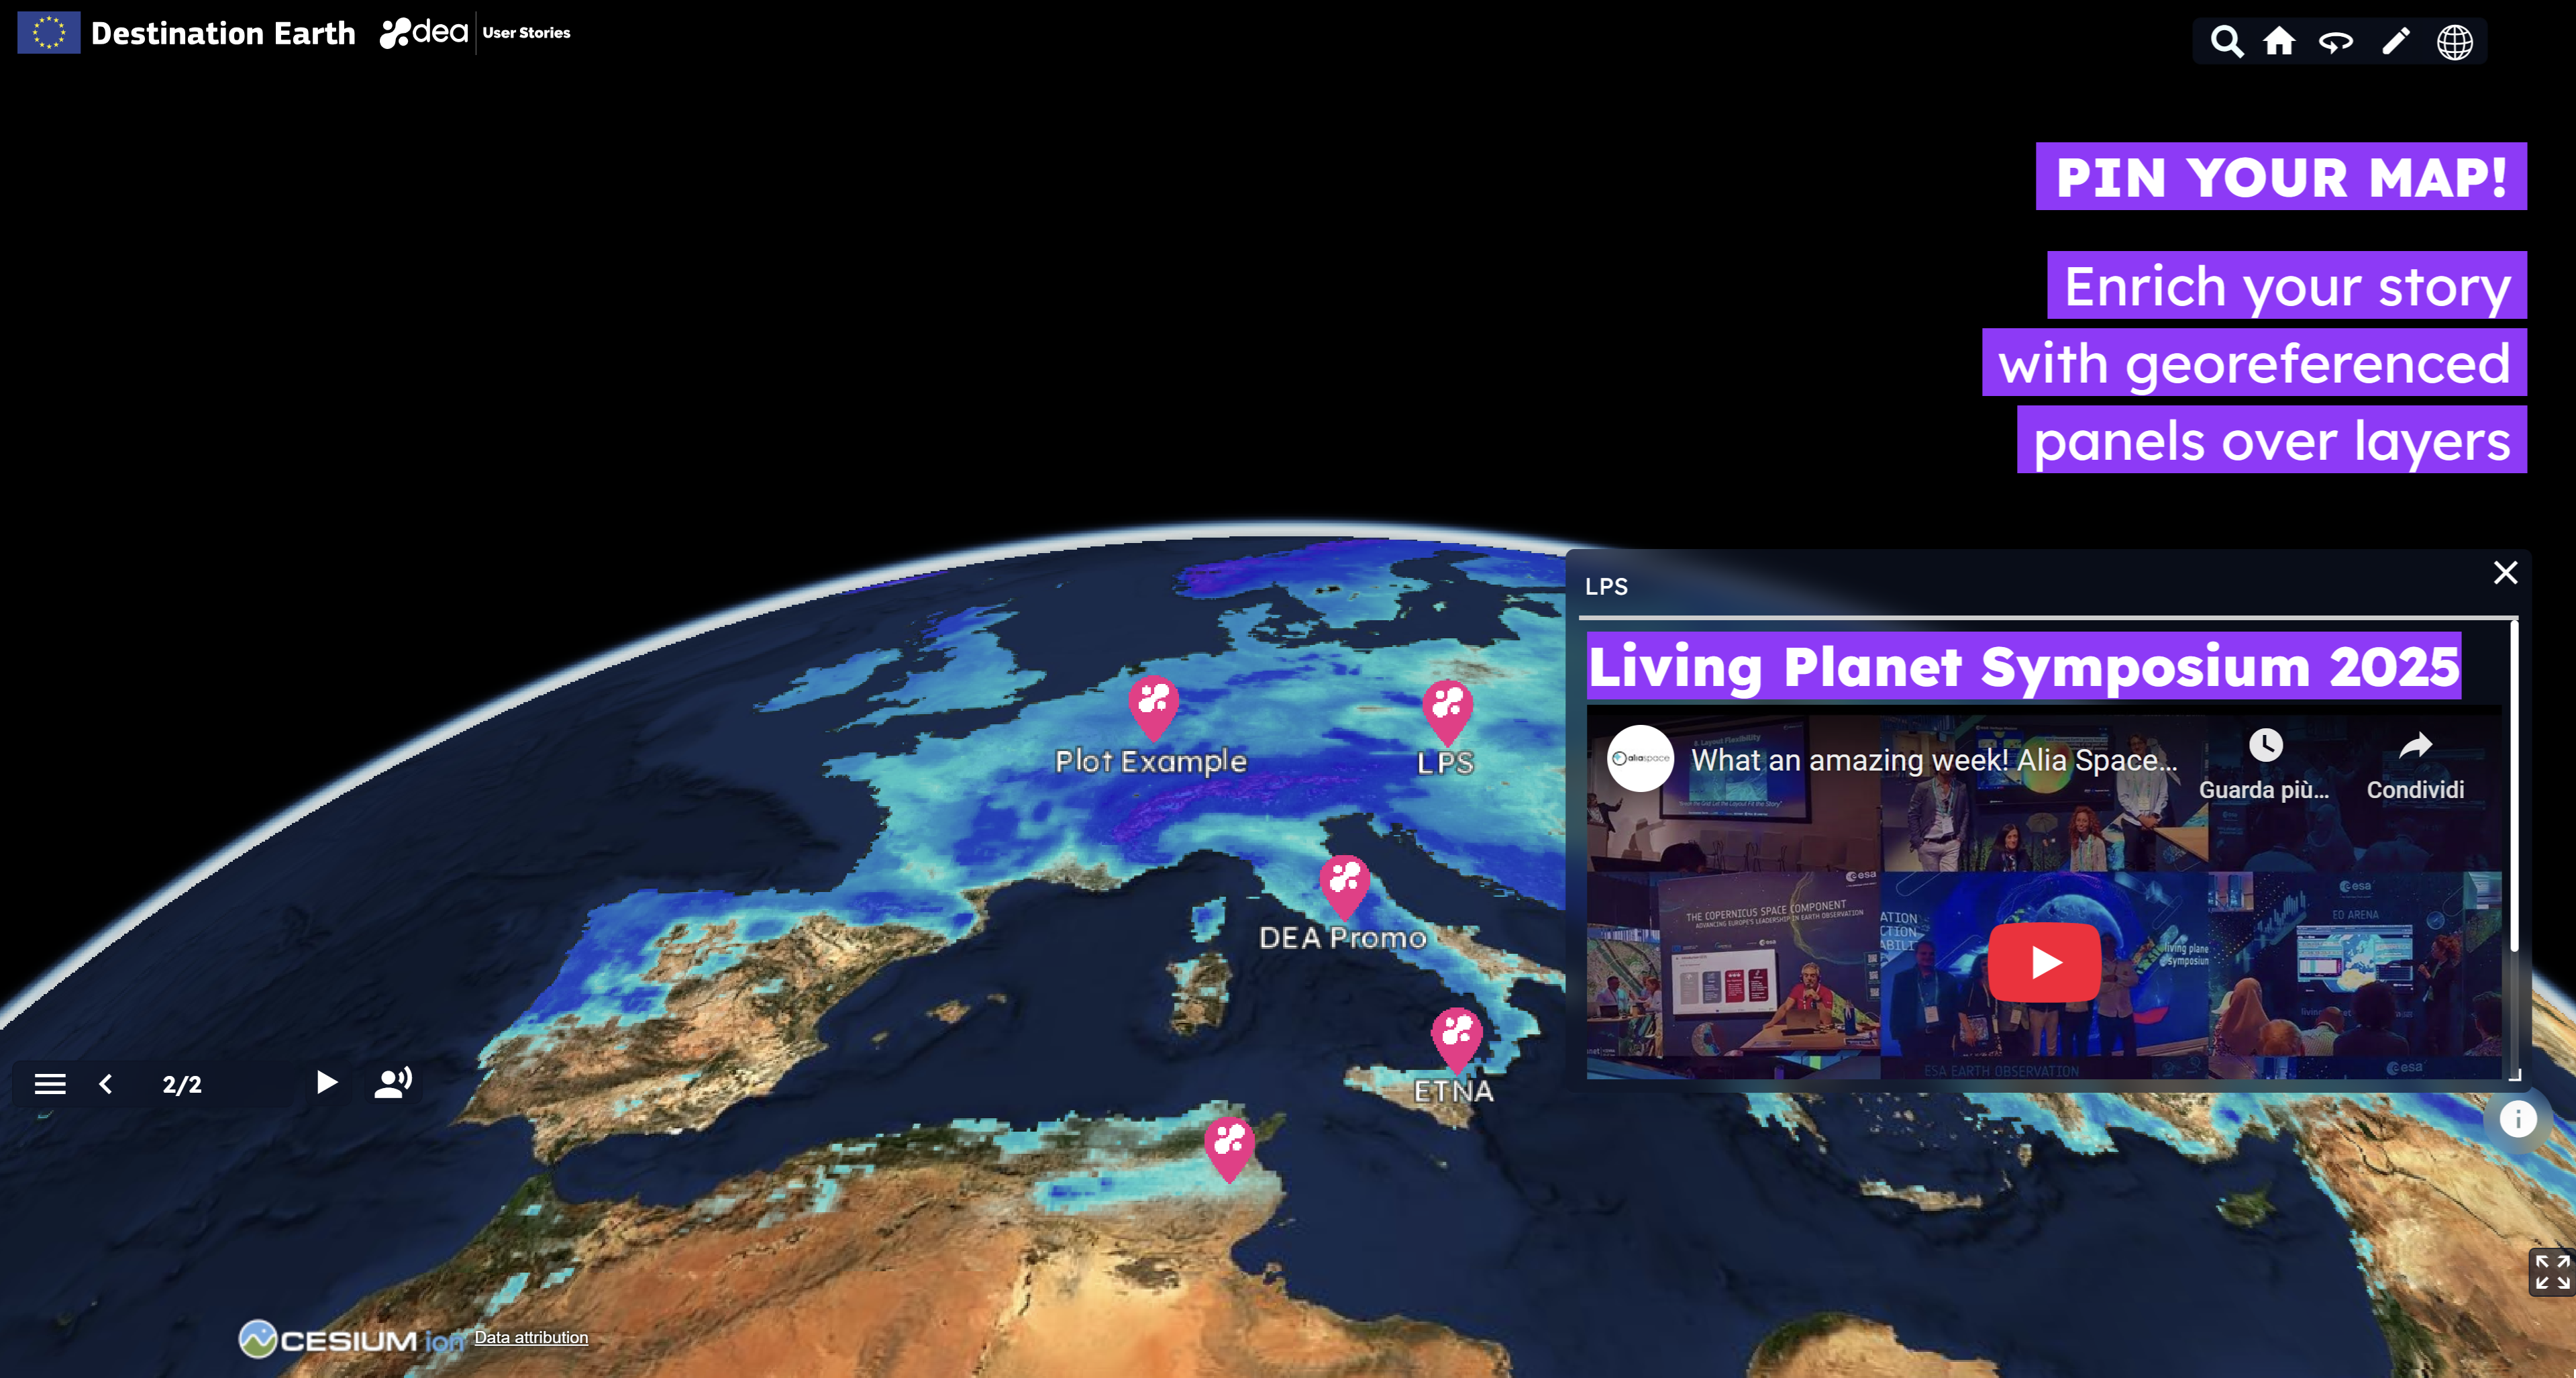
Since the DEA 1.7.0 release, users can pin the map to add interactive location elements.
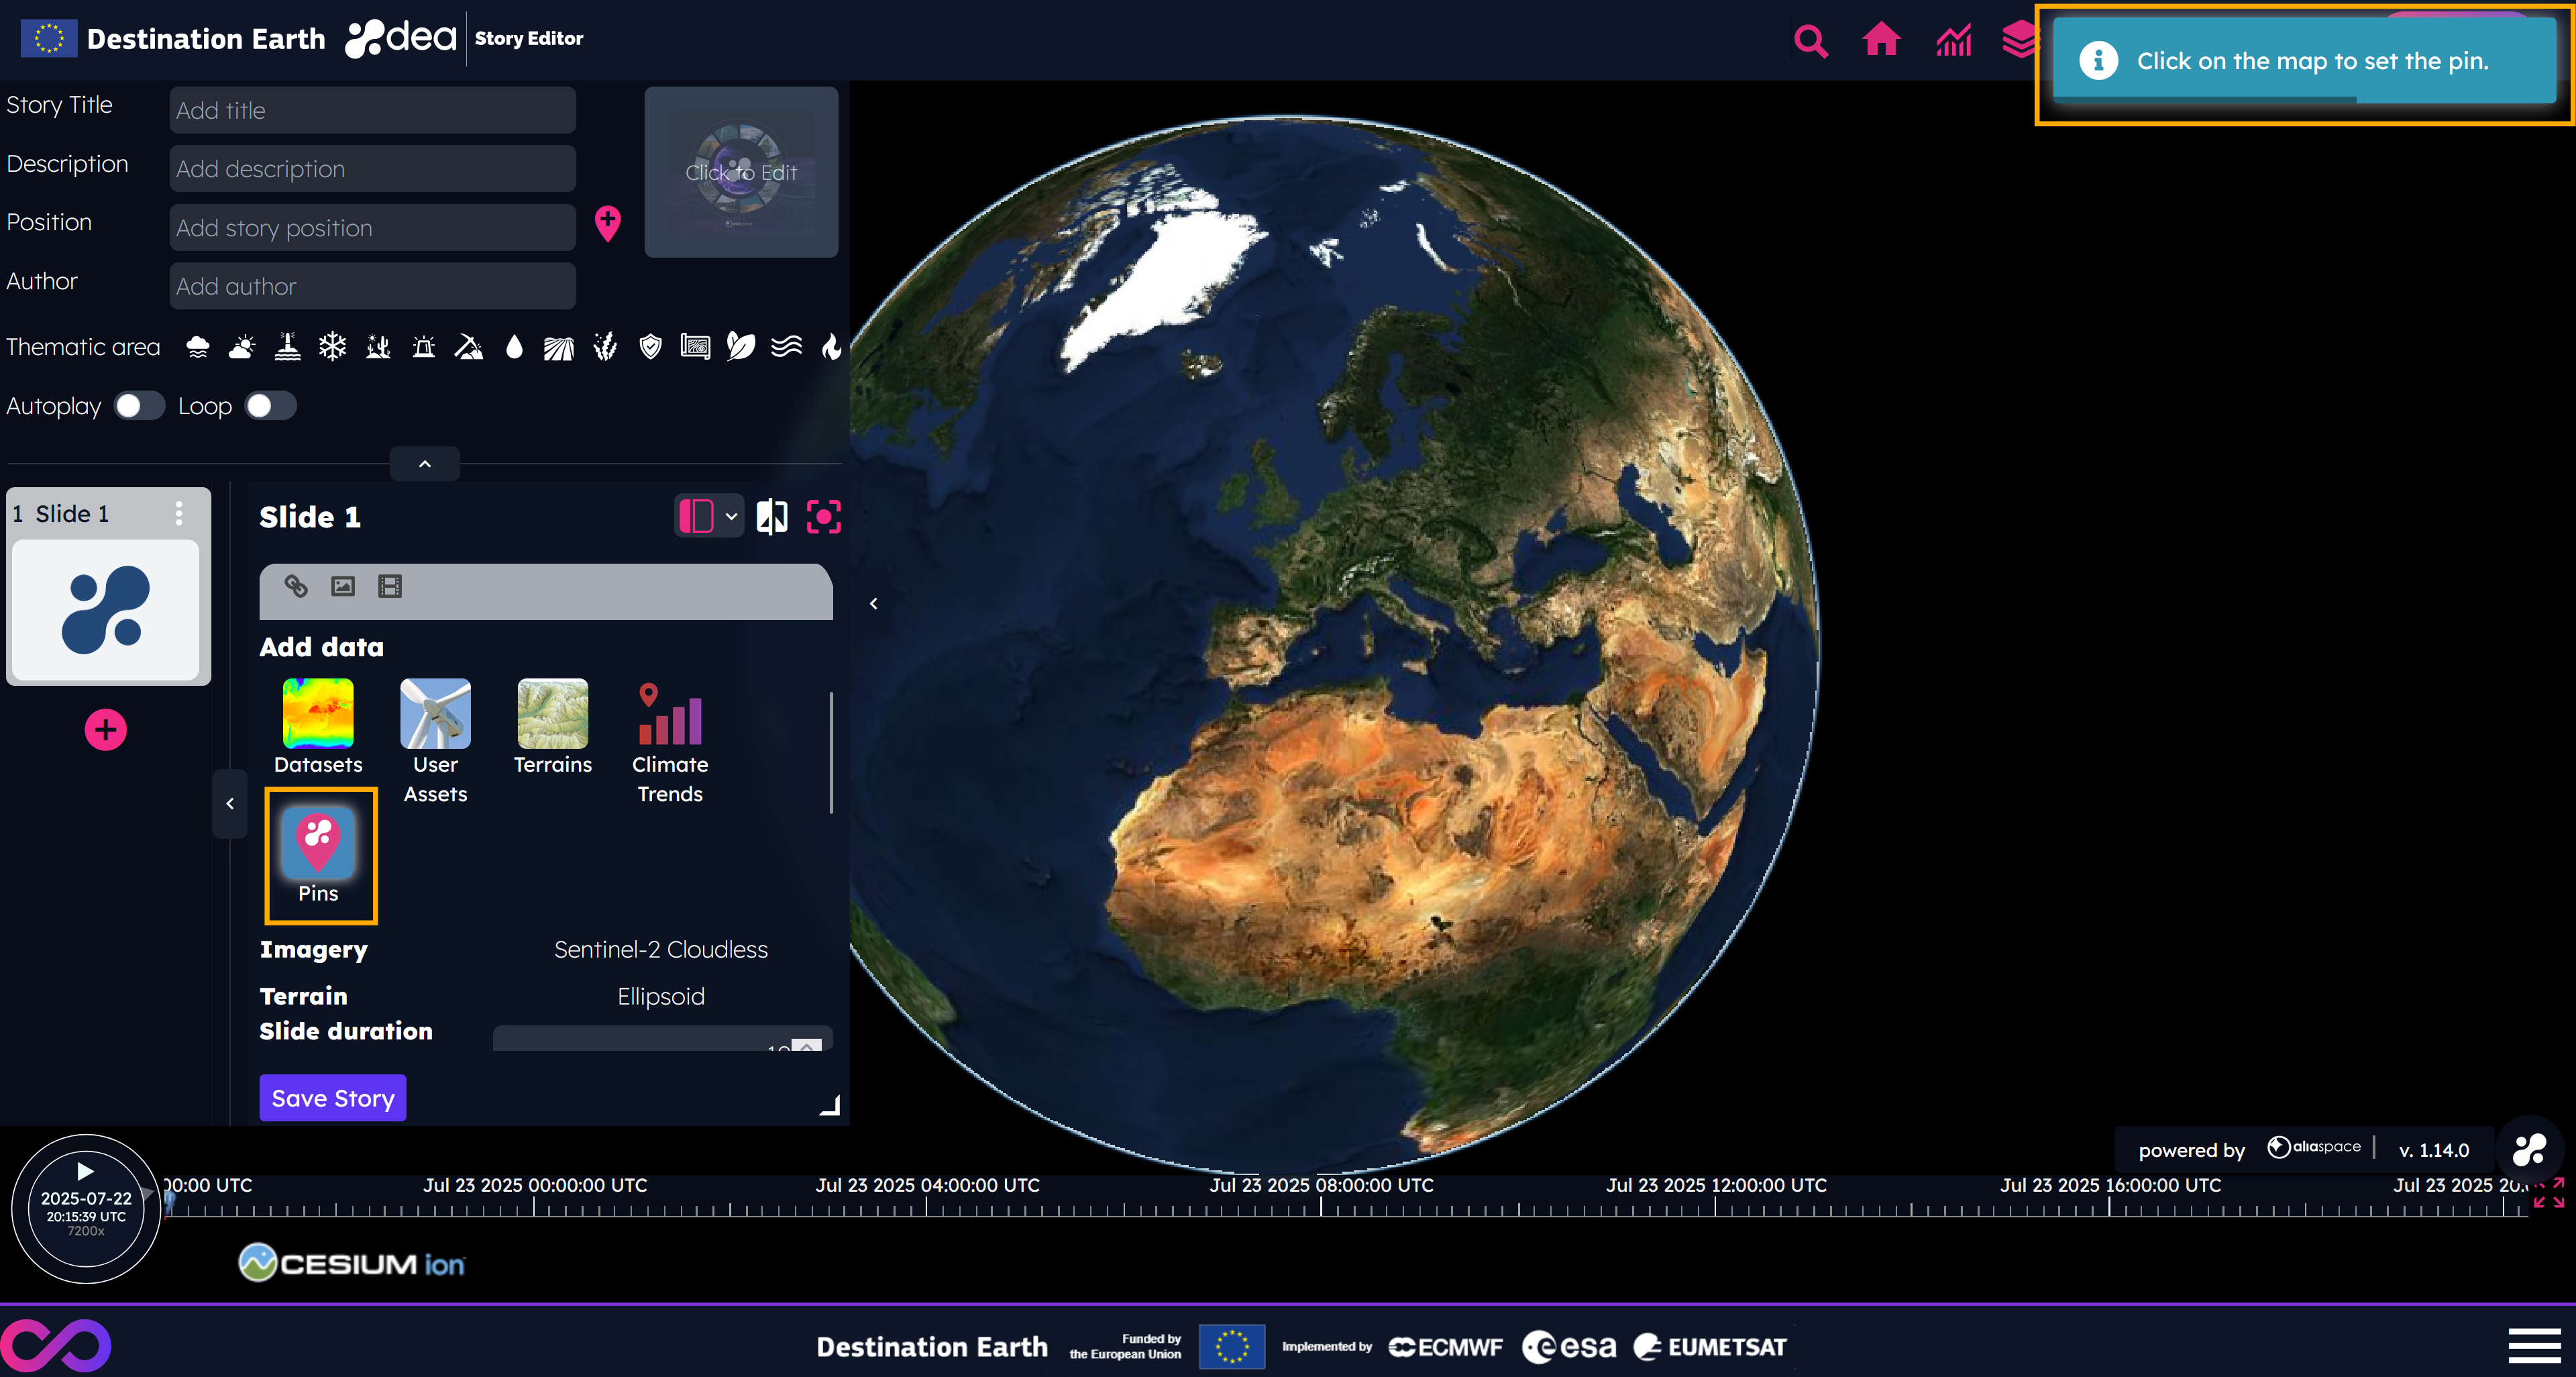
By clicking on the Pins button of the DEA Story Editor and then clicking on the map, a pin is added on the globe, anchored to a panel in which it is possible to add text, images, and videos, using an interface similar to the one available for writing the content of the slides.
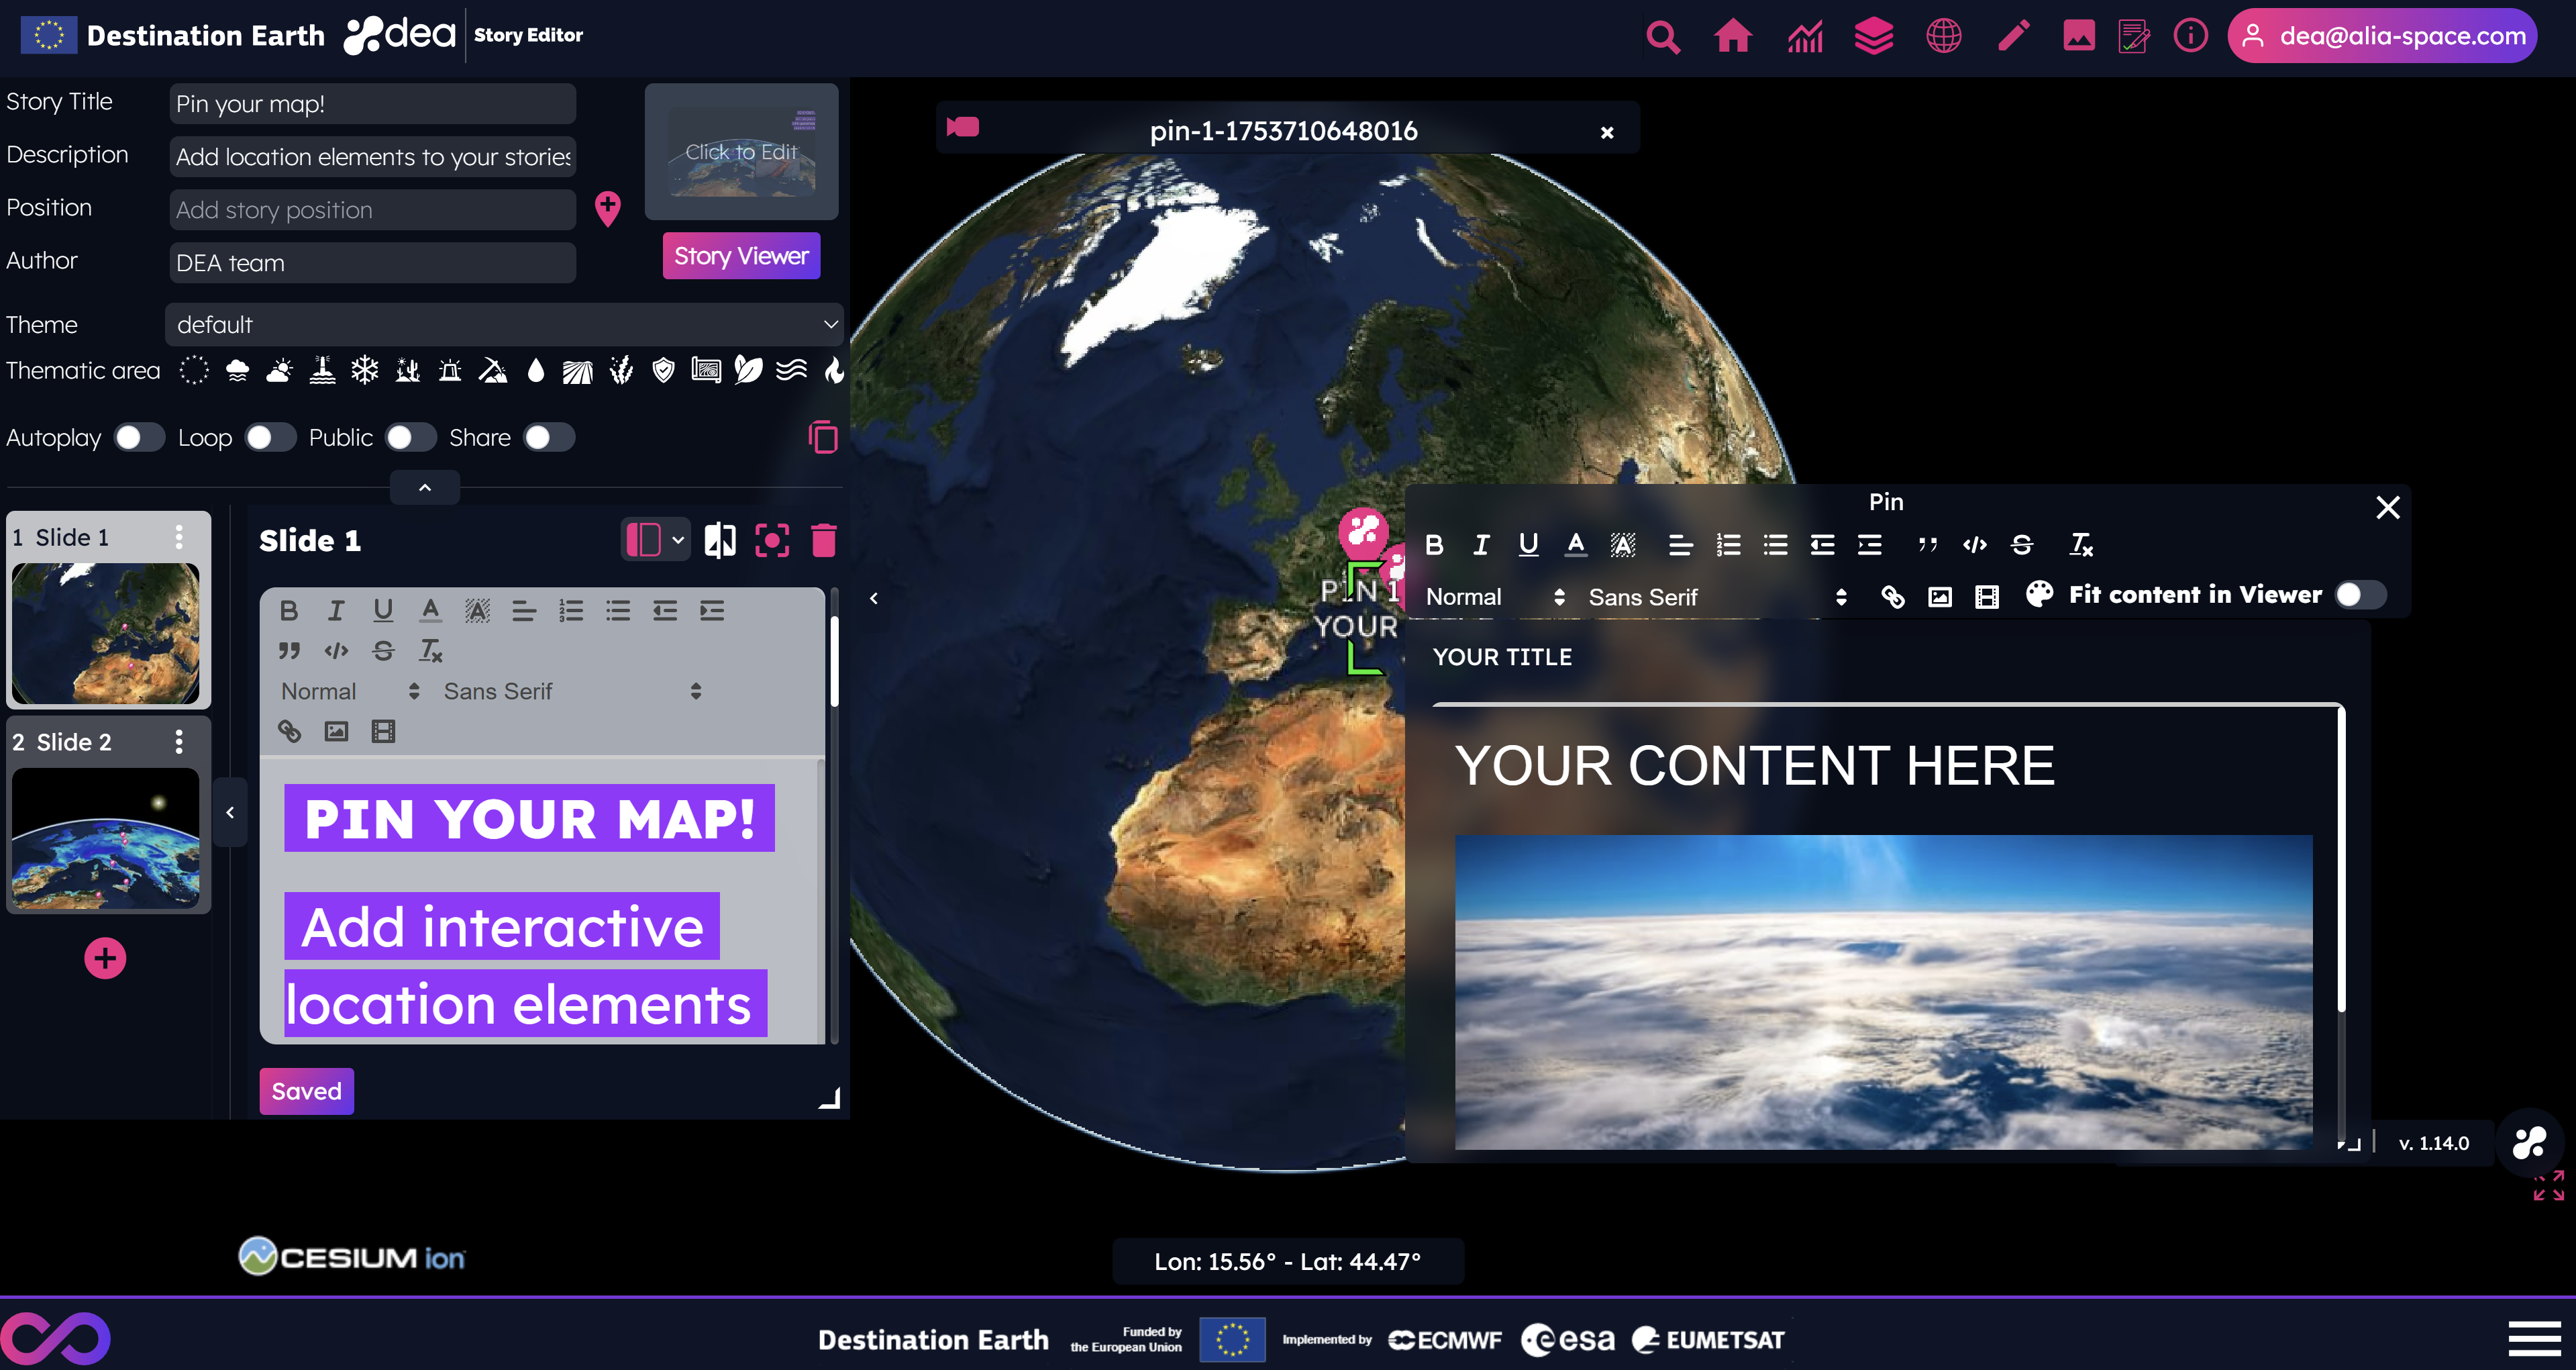
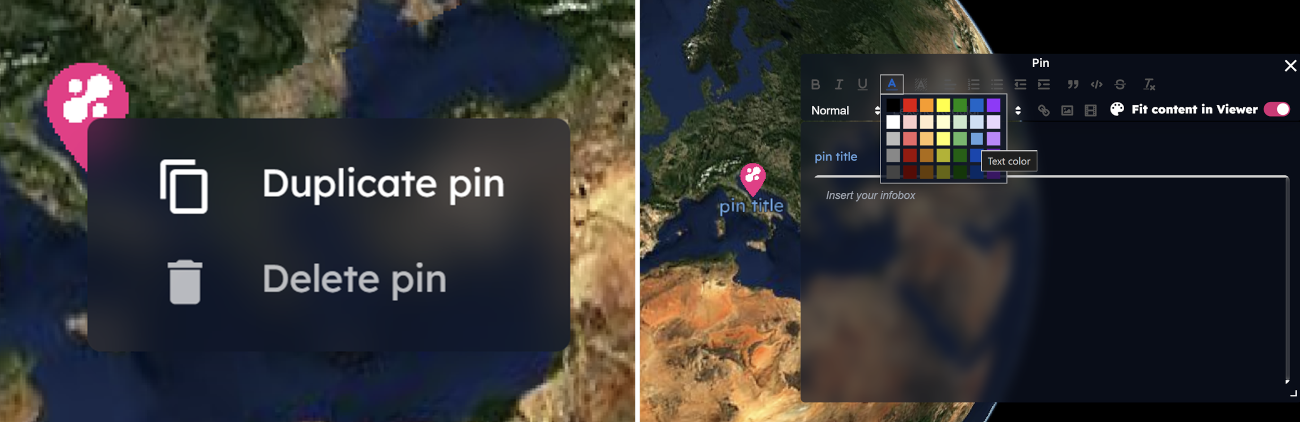
By default, the size of the panel linked to the pin fits the content and it is fixed. If users want to resize the content of the panel, they have to disable the option Fit content in Viewer and drag the bottom-right corner of the panel to set the chosen dimension.
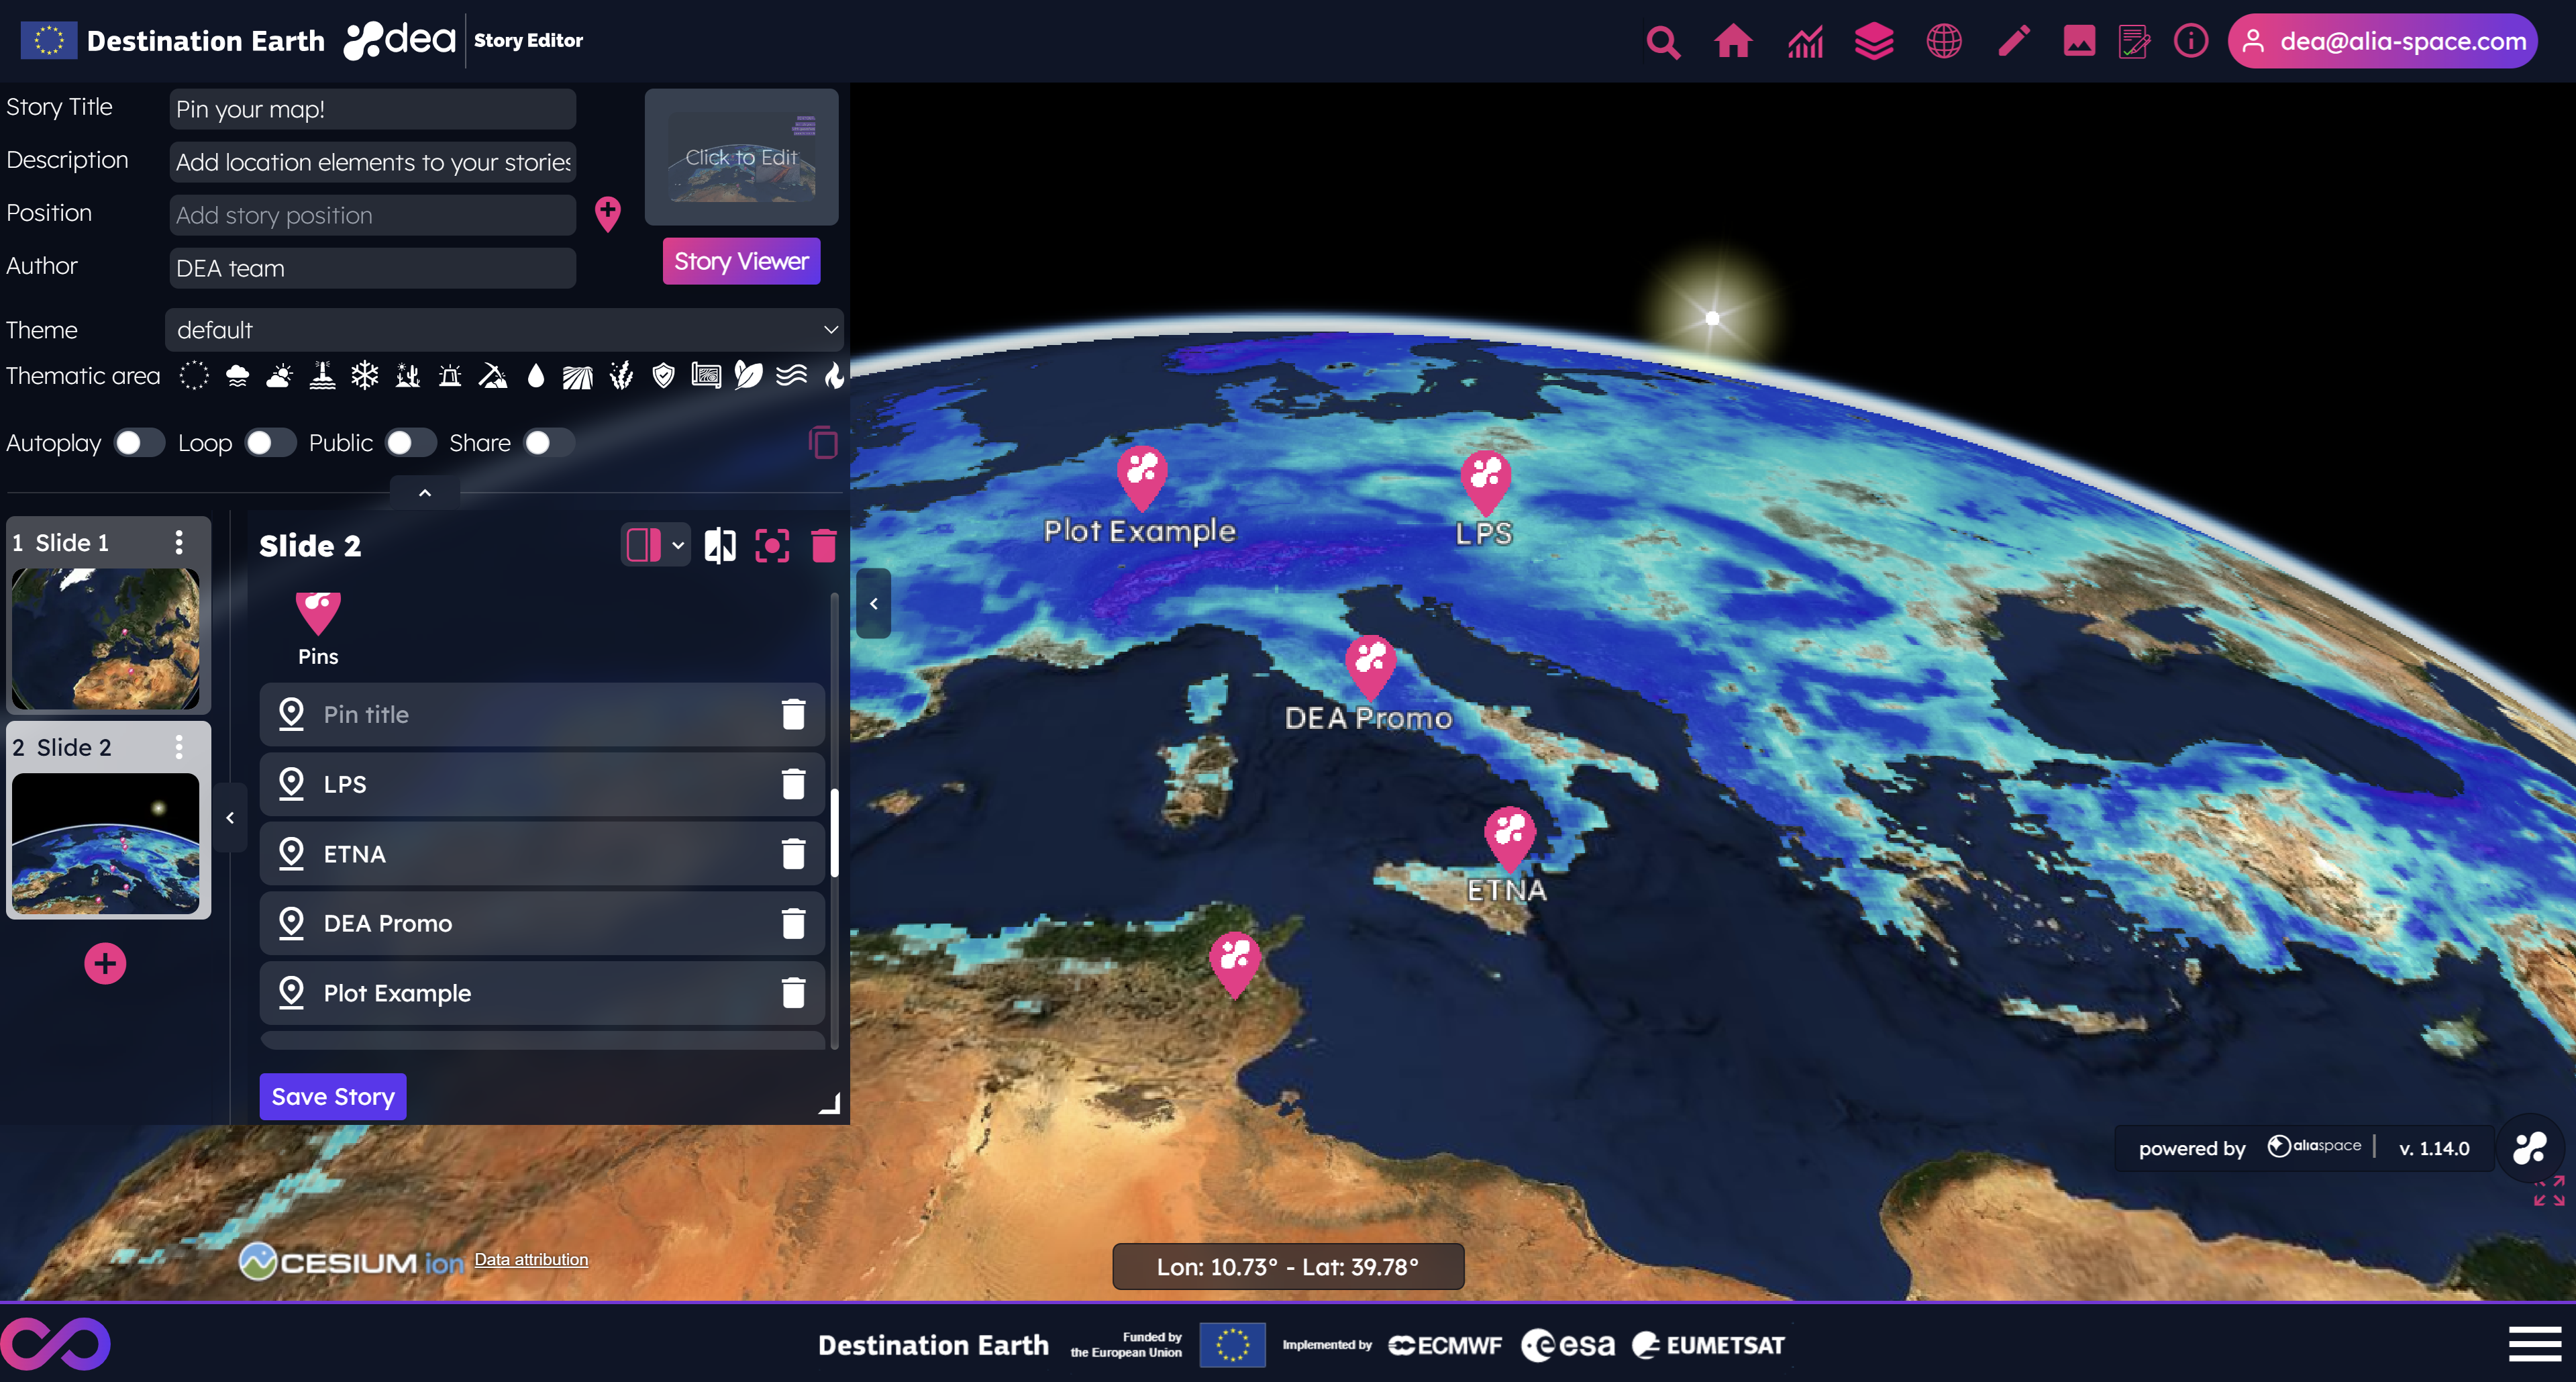
The map pins can be combined with datasets, terrains, base layers and assets.
The title of the pin will be shown on the map, on the bottom of the marker. Users have to save their stories to see the pins in the Story Viewer.
The content of the pin, which can be dragged from the header, is shown by clicking on the pin itself, both in the Story Editor and in the Story Viewer. If no content is defined for a pin, the panel will not be visualized by clicking on the pin. Similarly, if no title is defined for a pin, no label will be shown on the map for the corresponding marker.
Update pins’ position by dragging them on the map.
Duplicate an existing pin, selecting the option from the context menu shown by right-clicking the pin.
Change the font size, font family and font color of the pin’s title.
Generate animations from layers
Datasets panel of the Story Editor.Layers tab, the Generate Video panel is displayed.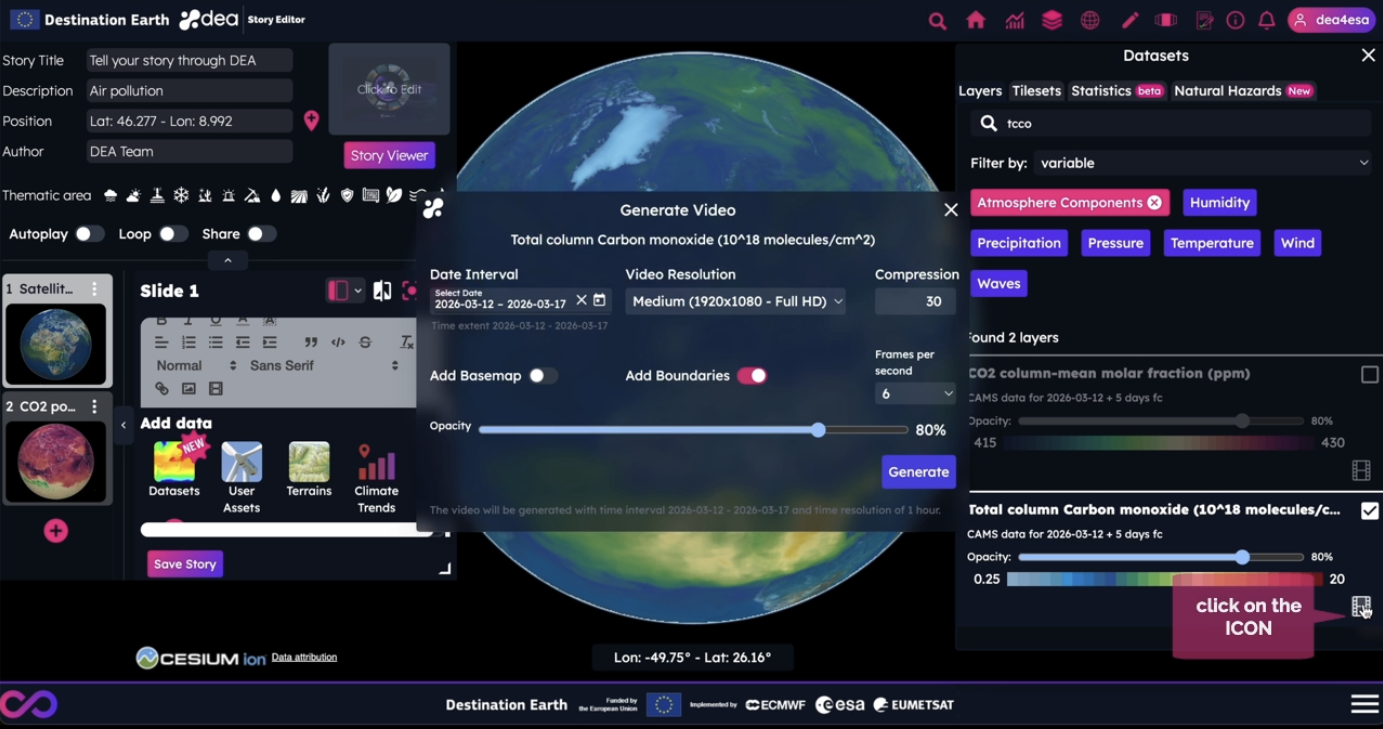
Users can set the following video parameters:
Date interval, as a subset of the date range reported in the panel
Resolution, which can be 4K, Full HD, or HD
Compression (from 23 to 38)
Frames per second, which possible values are 6, 12, 18, 24
Layer opacity
Sentinel-2 cloudless imagery background (if not set, the video background will be black)
White country boundaries
Generate button
Note
Please note that each user can generate up to five videos per day.
 Where is my text?
Footnotes