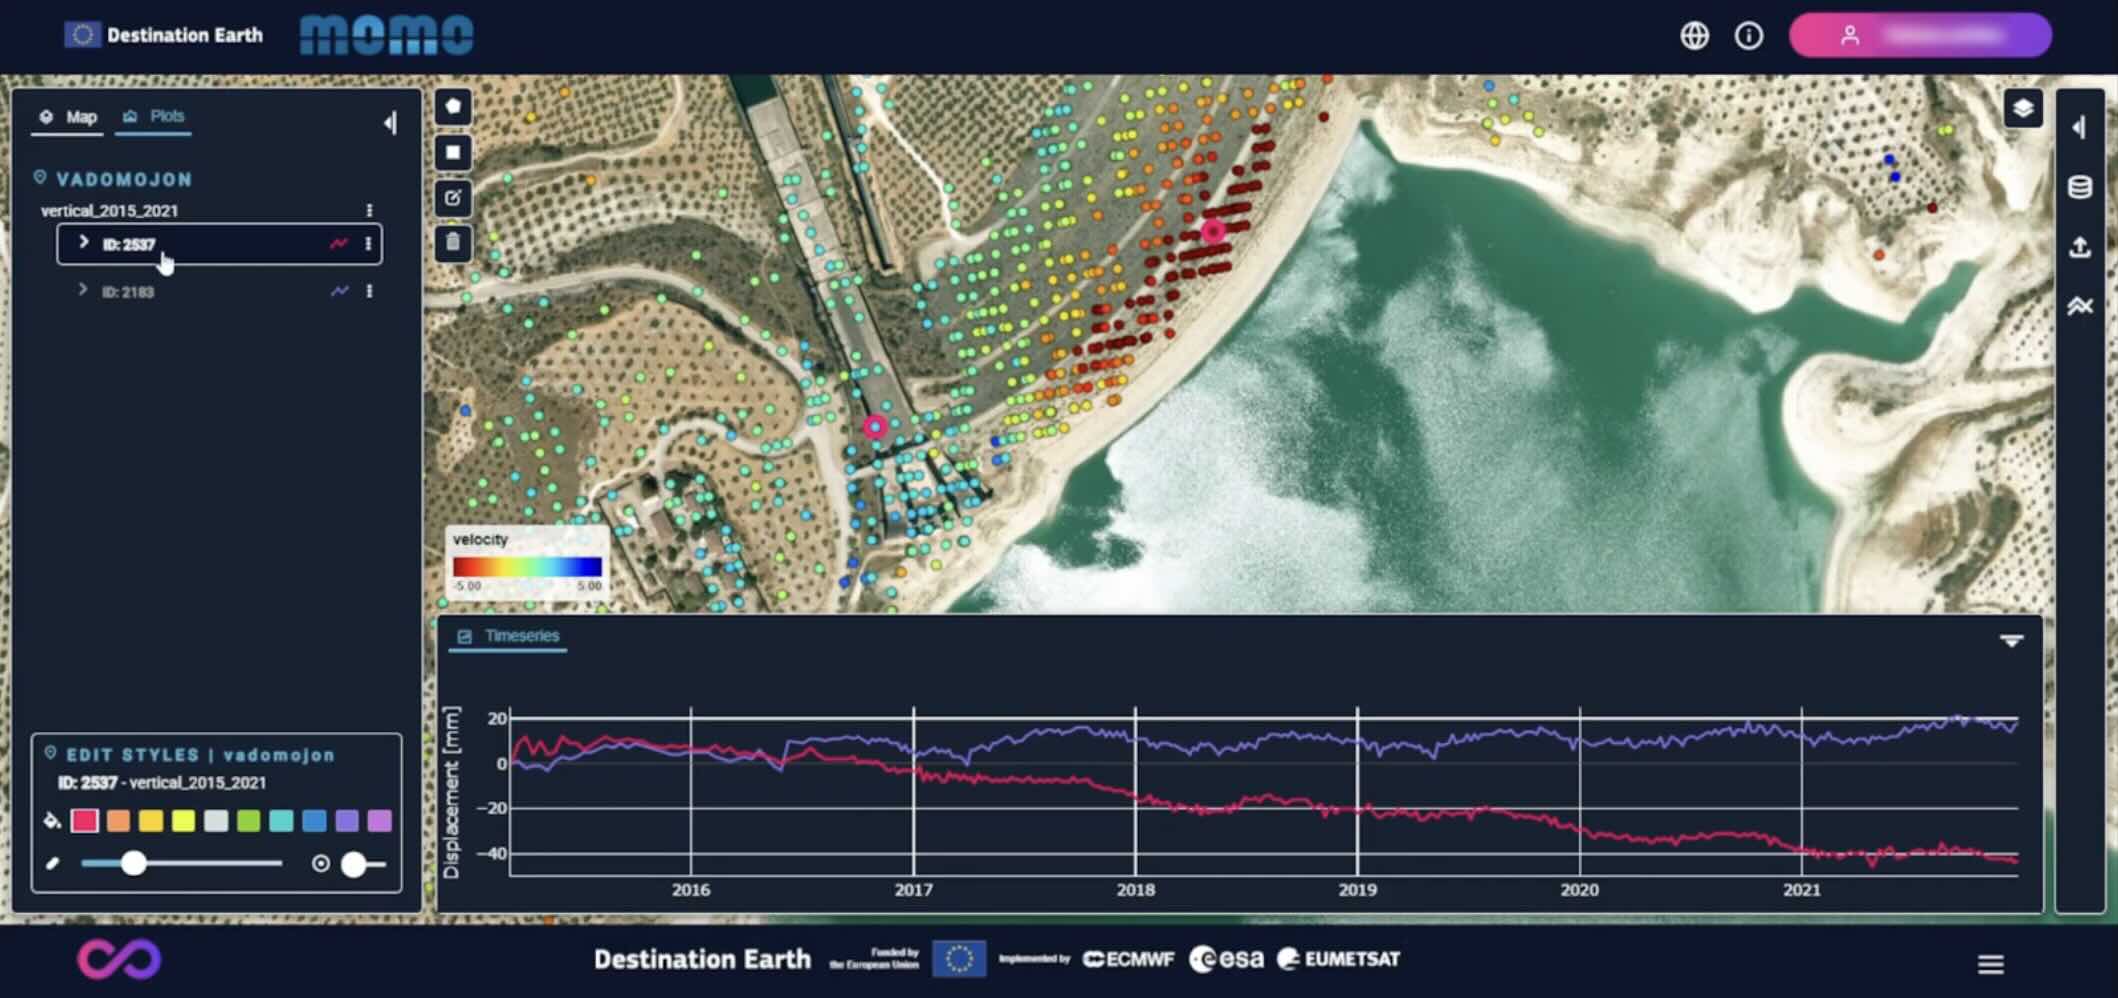
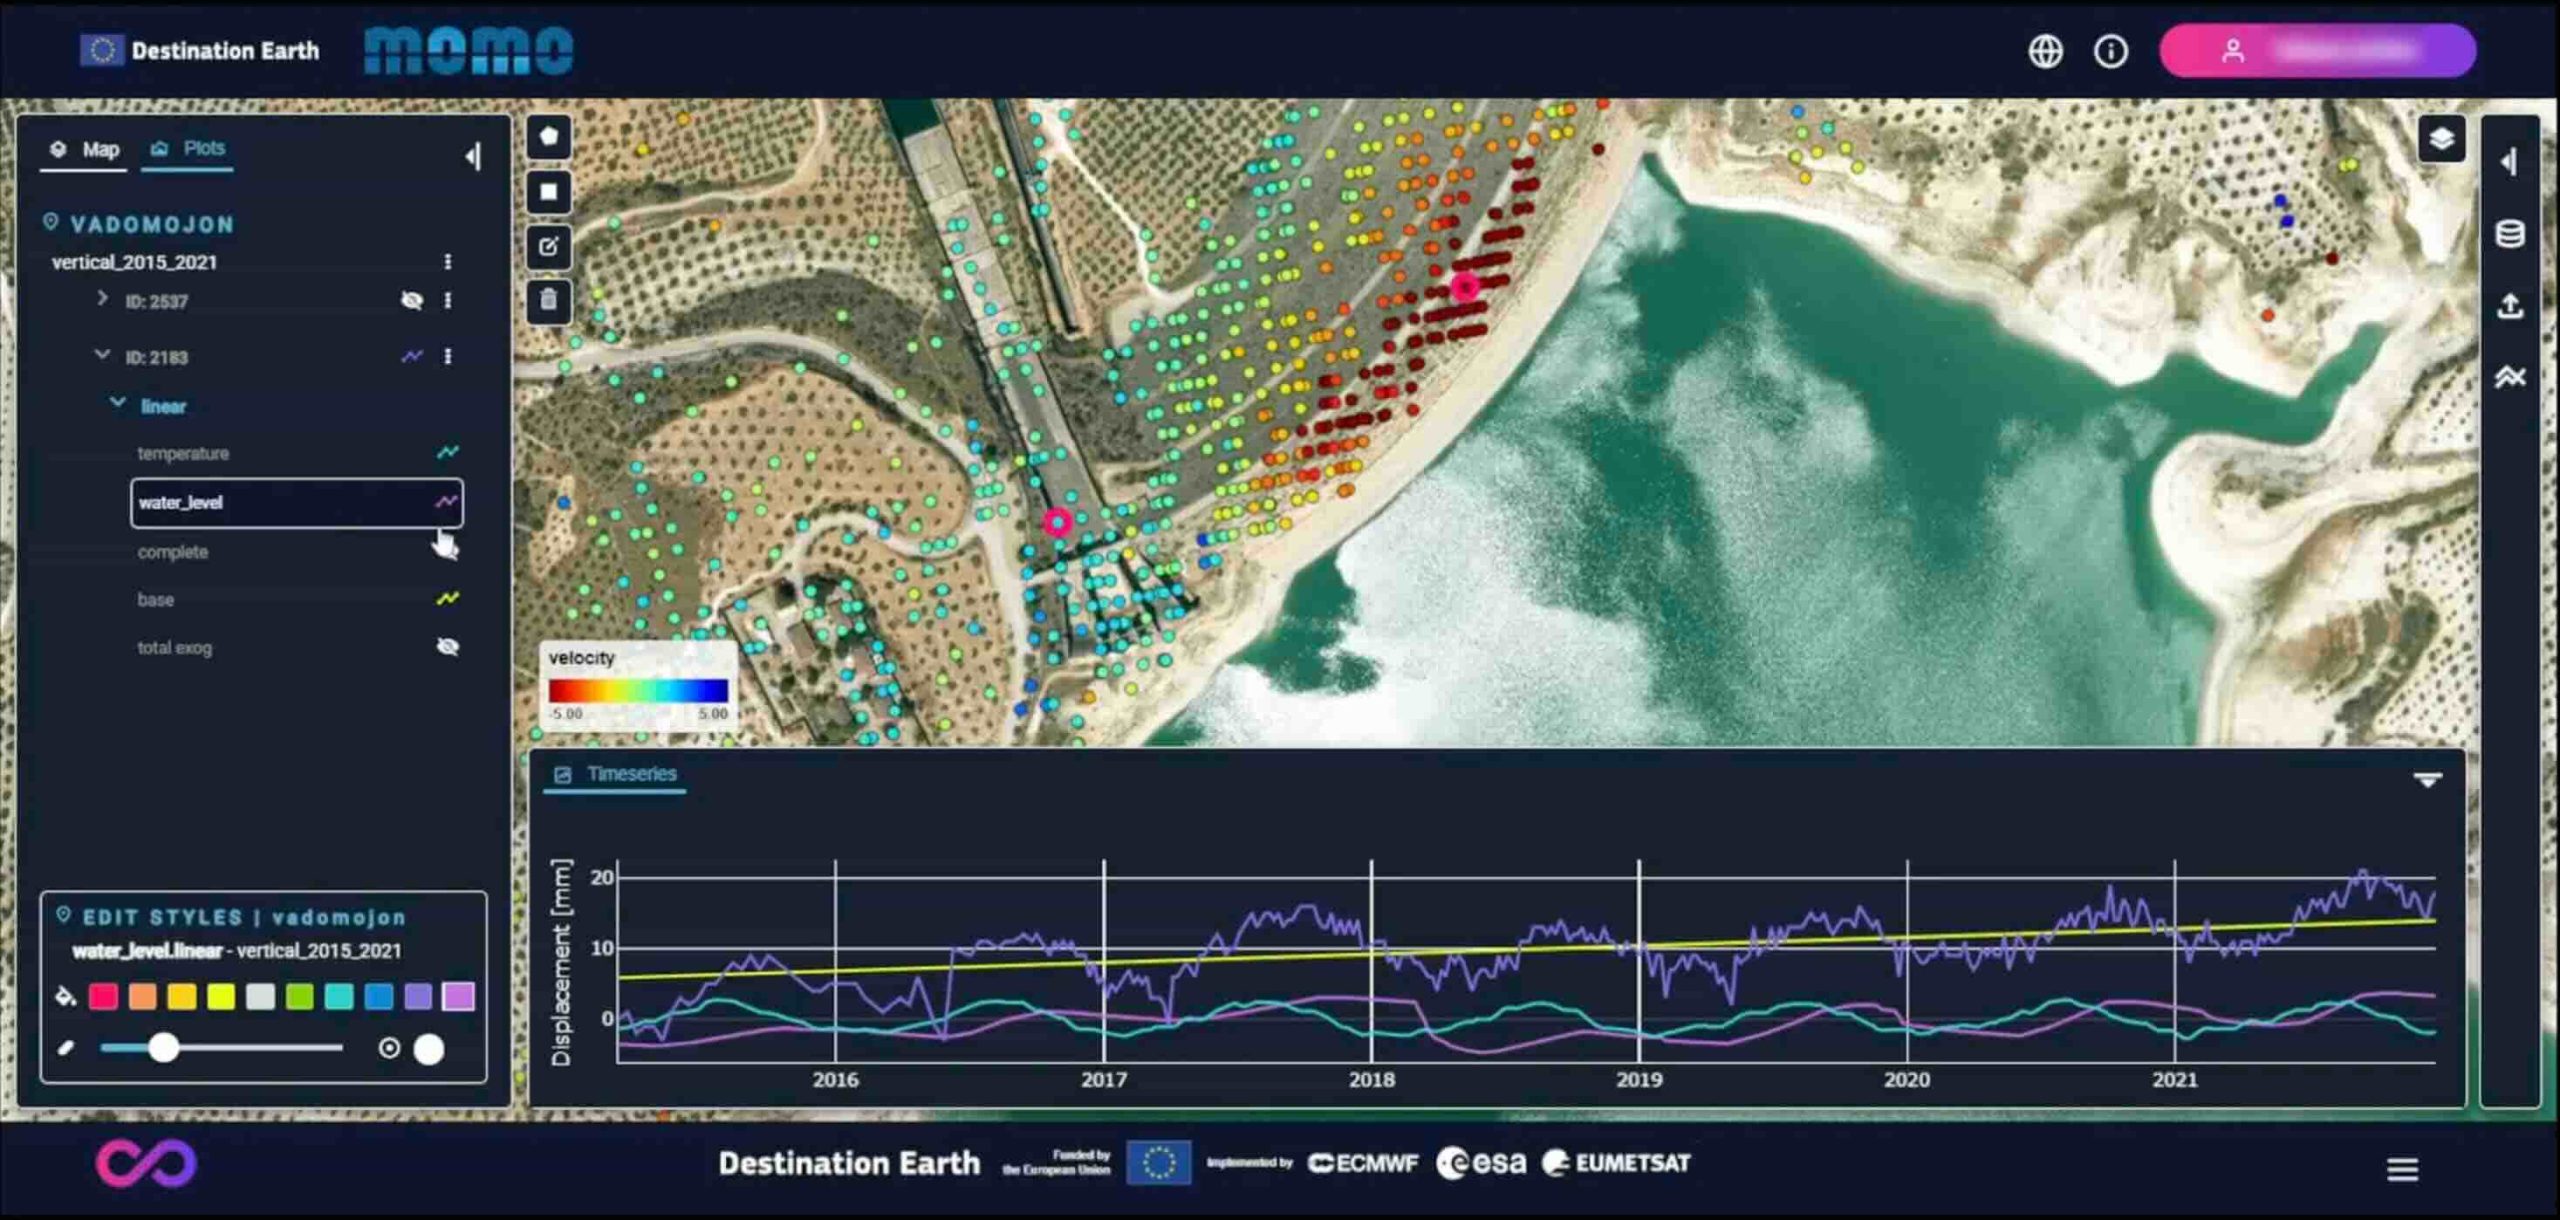
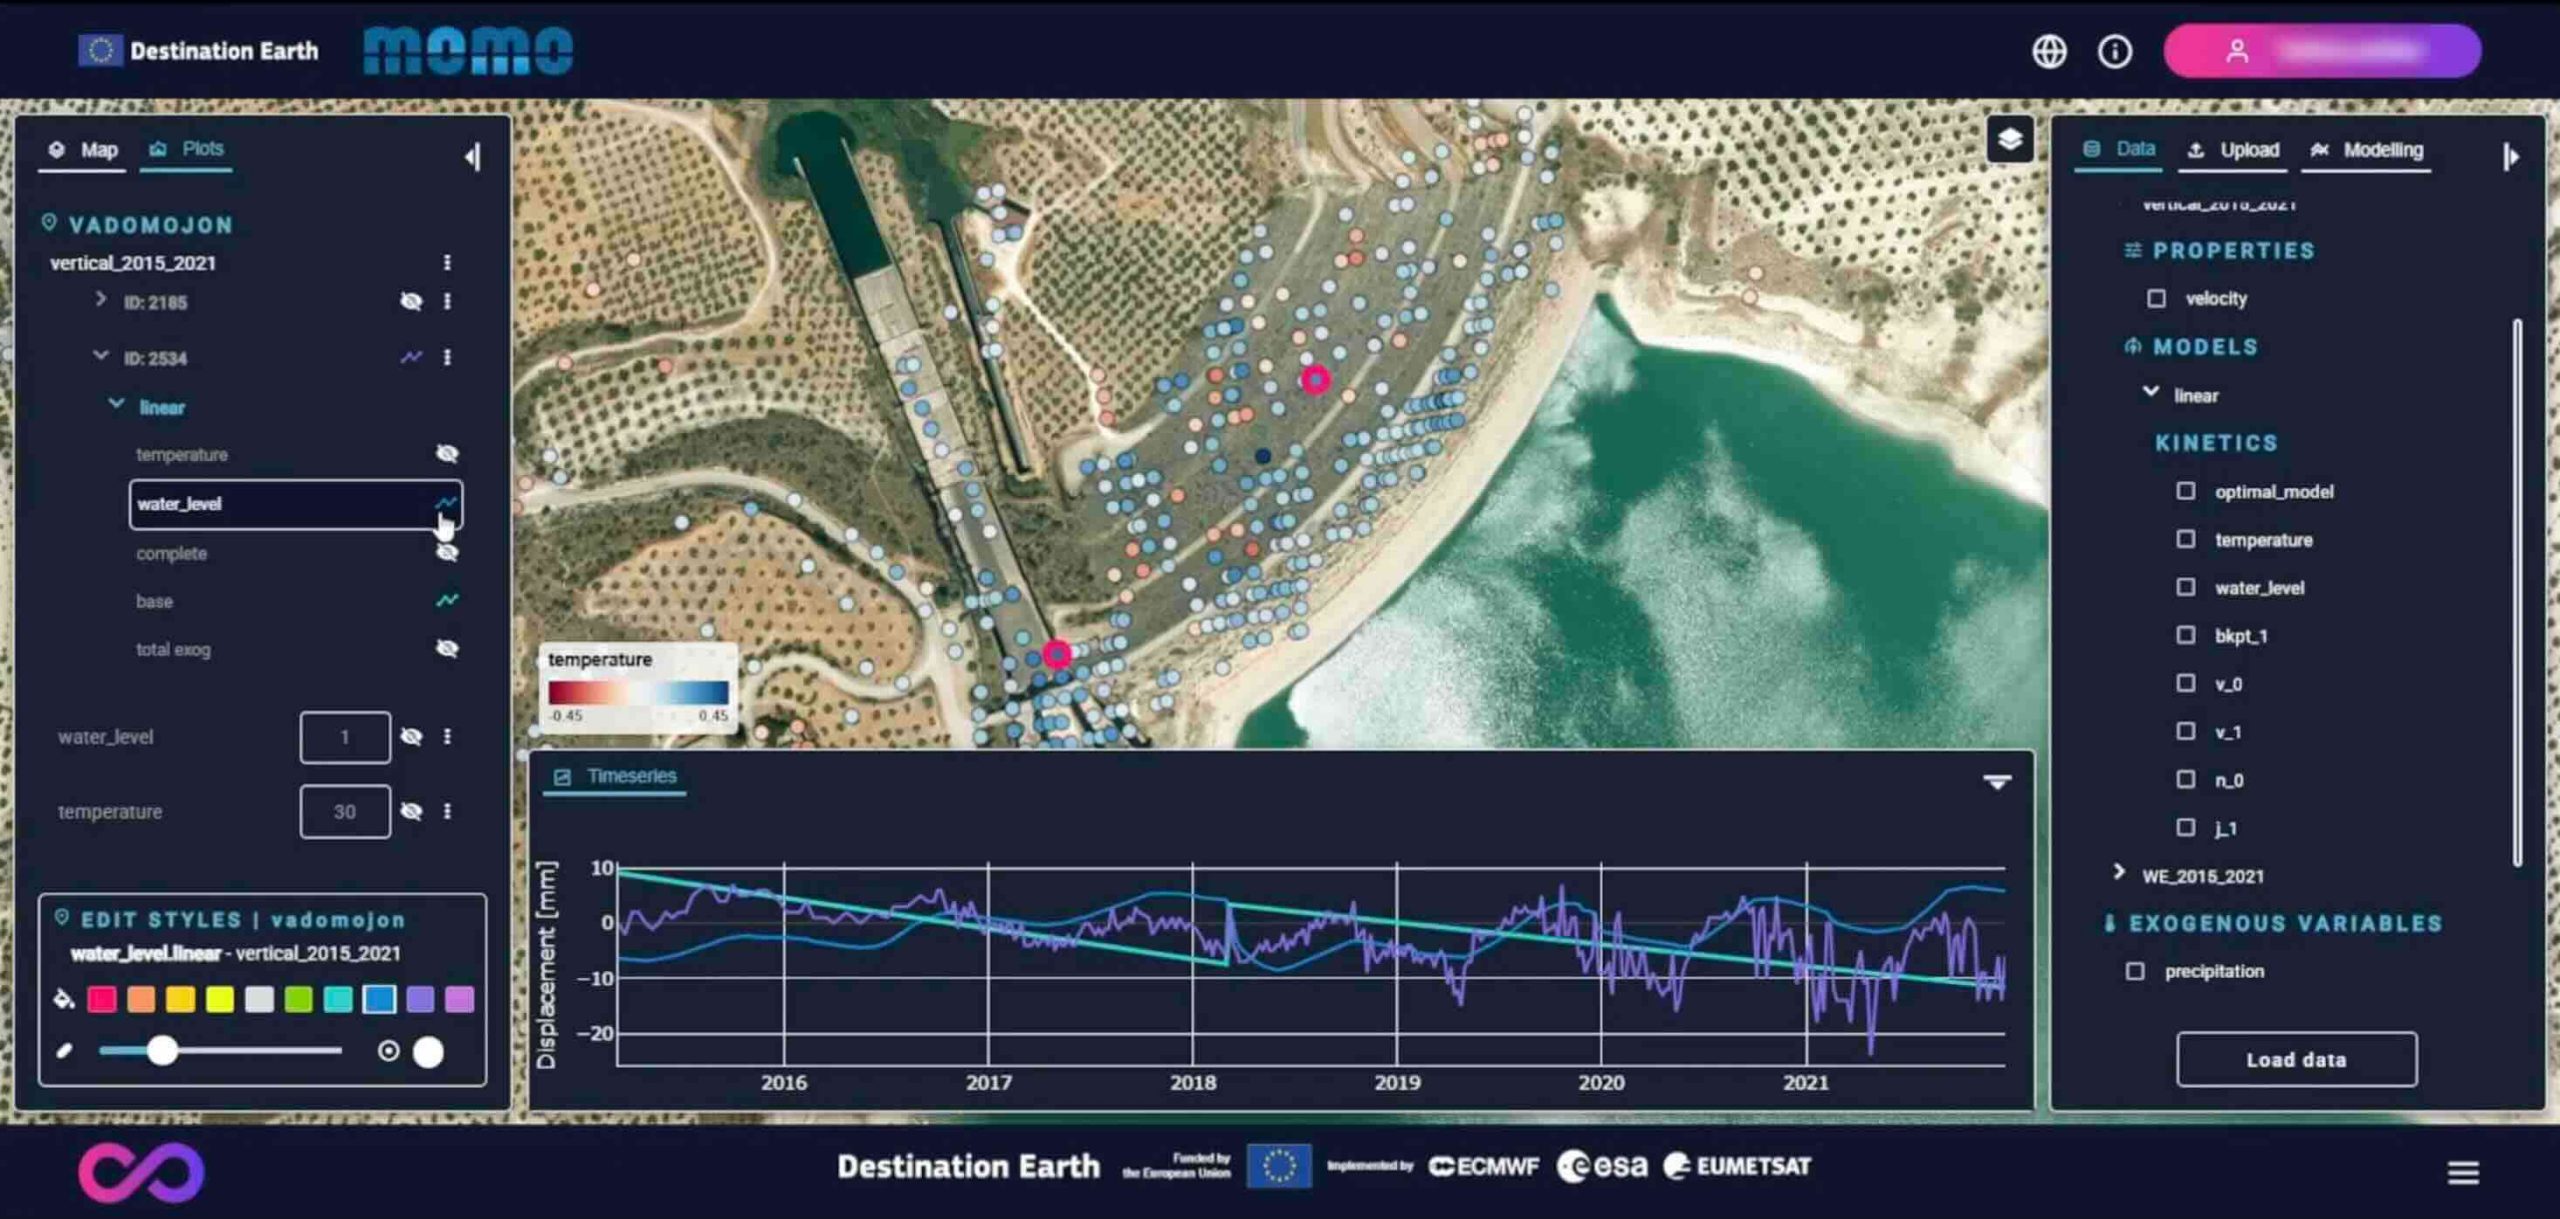
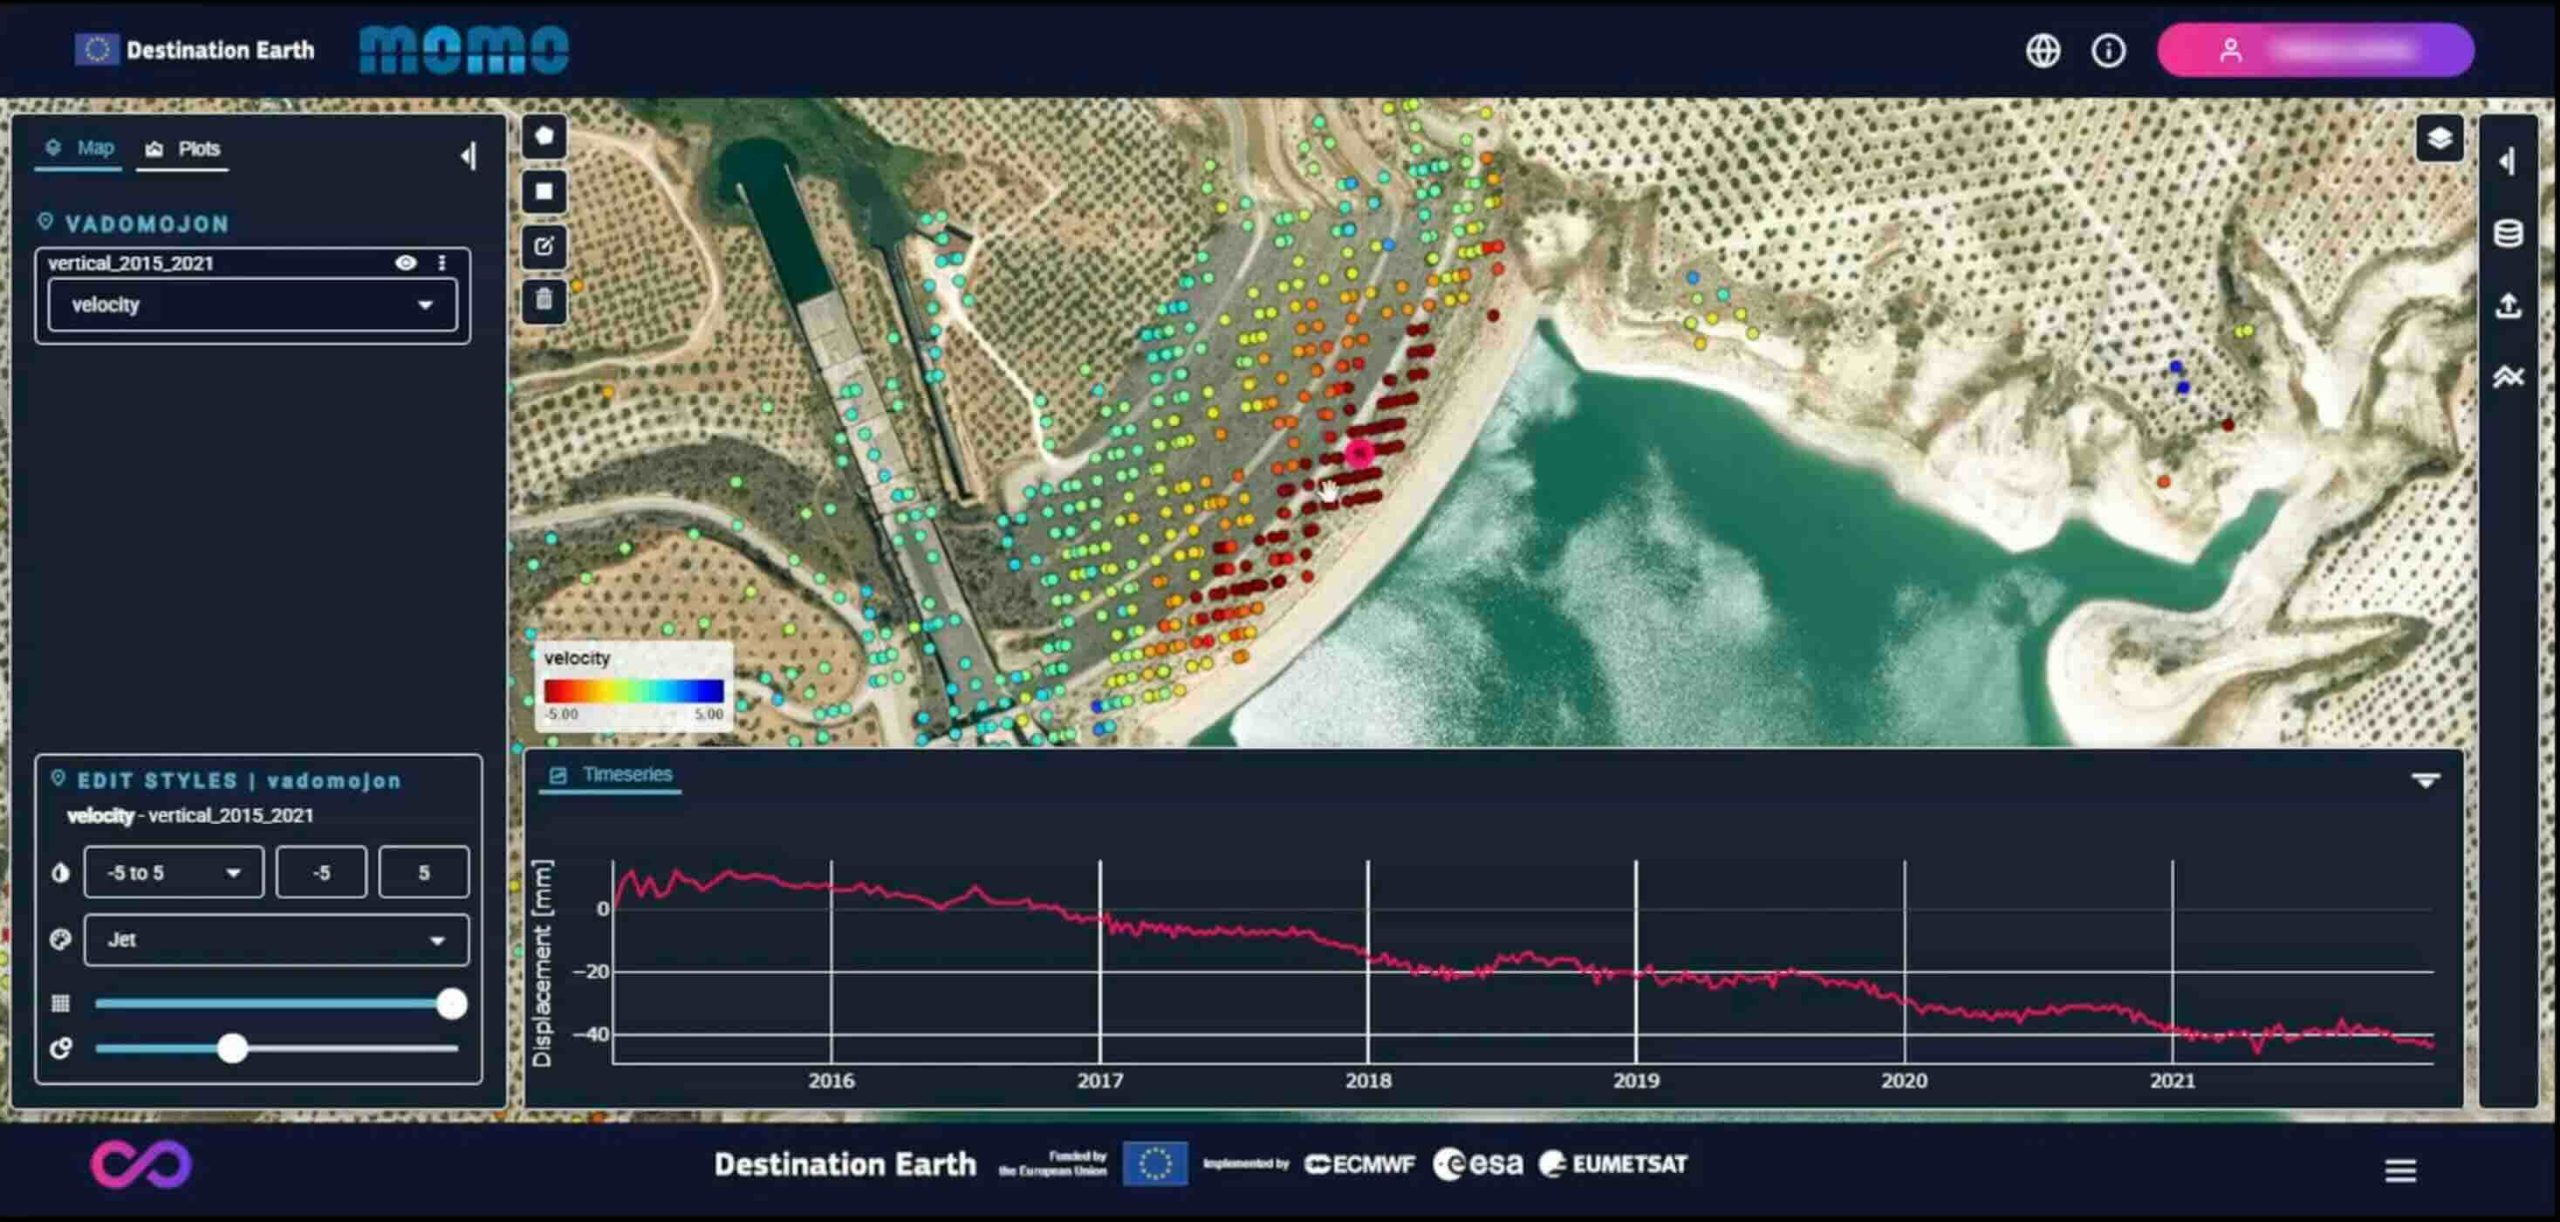
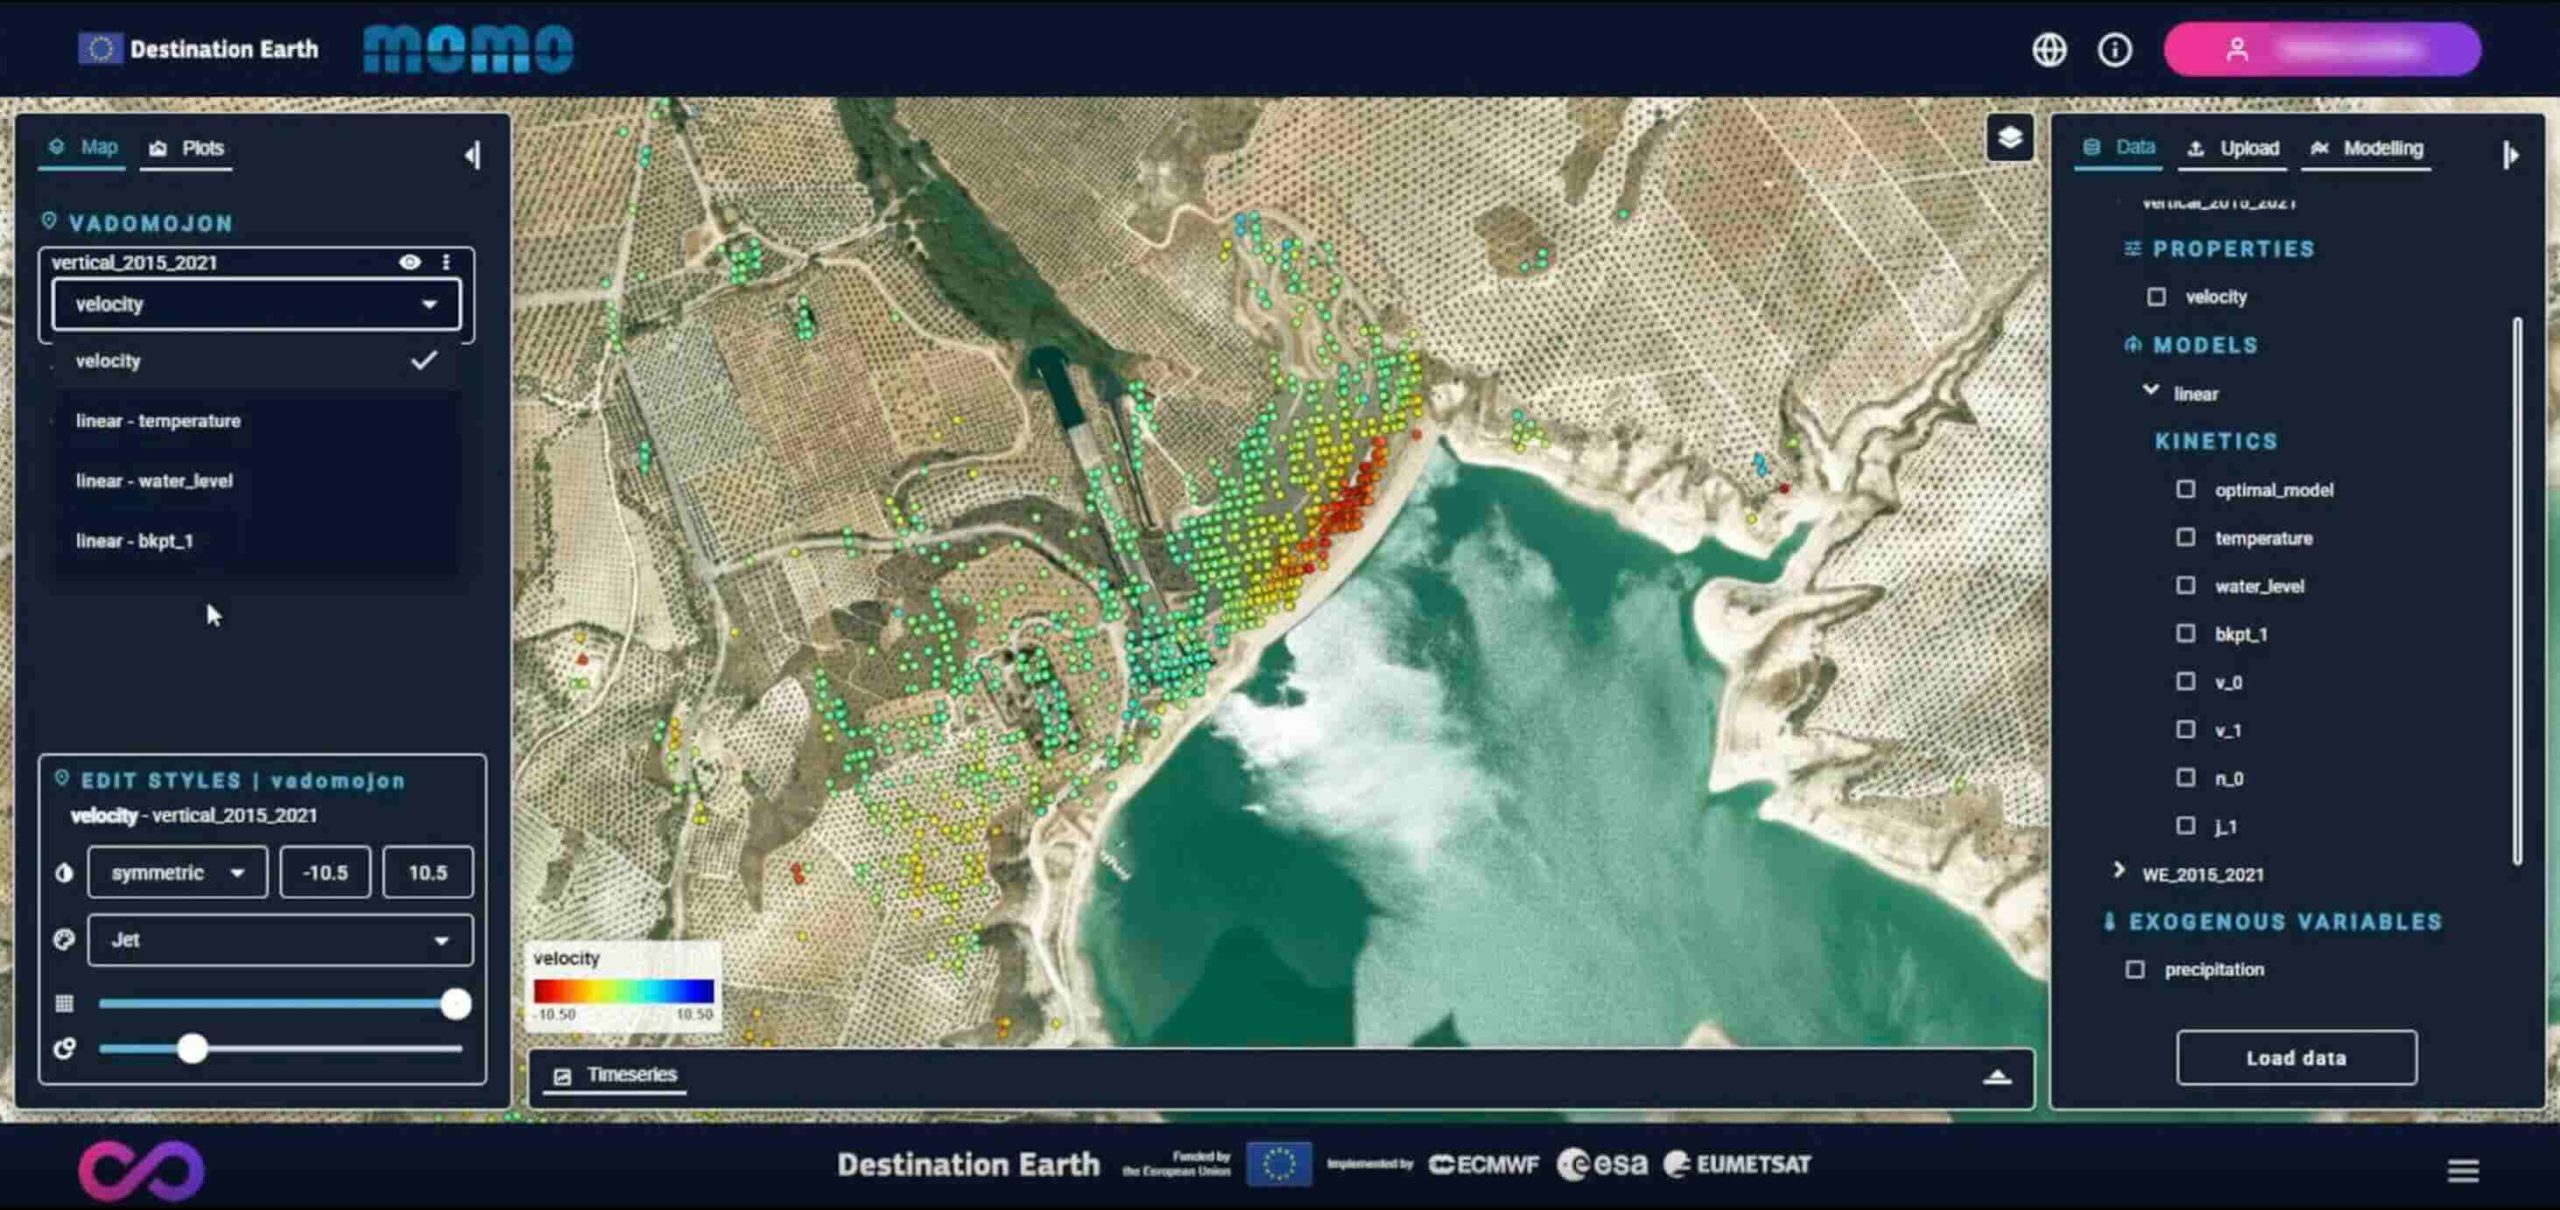
It models deformation time series derived from InSAR, combined with climatic ERA5 data. It offers interactive visualization (map and time series), breakpoint detection, and correlation with precipitation and temperature. A free tier is available with practical examples.
MoMo
InSAR time series modelling.
Operated by:
Funded by:


Data Portfolio
Video Tutorials
This tutorial explains the limitations of raw InSAR measurements and demonstrates how MoMo combines satellite-derived deformation time series with external environmental variables, such as temperature and water levels, to move from observation to interpretation. Through a real modeling example on an earth-fill dam, viewers learn how MoMo identifies deformation trends, breakpoints, and external influences using advanced time-series modeling.
The video also provides a guided walkthrough of the MoMo interface, showing how to manage data, visualise model components, and access documentation and advanced tutorials for deeper analysis and operational decision-making.
In this case study, we demonstrate how MoMo applies advanced motion modeling to real InSAR data from an earth-fill dam. Discover how external variables such as temperature and reservoir levels are integrated into the analysis, how breakpoints and long-term trends are identified, and how modelling reveals the physical drivers behind infrastructure deformation. This example shows how MoMo supports data-driven, operational decision-making for infrastructure monitoring.
You might also like:
- Data Access Management, User Workflow
Upgraded Access
- Data Access Management