Analysing Models
This section describes how we can analyze the fitted models for the time series at each point on the map. Model visualization is performed at point level through the interactive map and the associated panels.
When a point is selected on the map, it is highlighted with a purple ring, and the corresponding deformation time series is automatically displayed in the panel below.
In the Plots tab of the left-hand panel, users can inspect the different model components associated with the selected point. This is done by expanding the list of available models and their components for that point.
Model Components
Depending on the selected model, the following components may be available for visualization:
The temperature-related component of the deformation
The reservoir water level component, when applicable
The combined contribution of exogenous variables (e.g. temperature and reservoir level)
The linear deformation trend, including cases with or without detected breakpoints
The total model, representing the combined effect of all model components
These visualizations allow users to compare the modeled deformation behavior with the measured InSAR time series and to interpret the relative contribution of the different components.
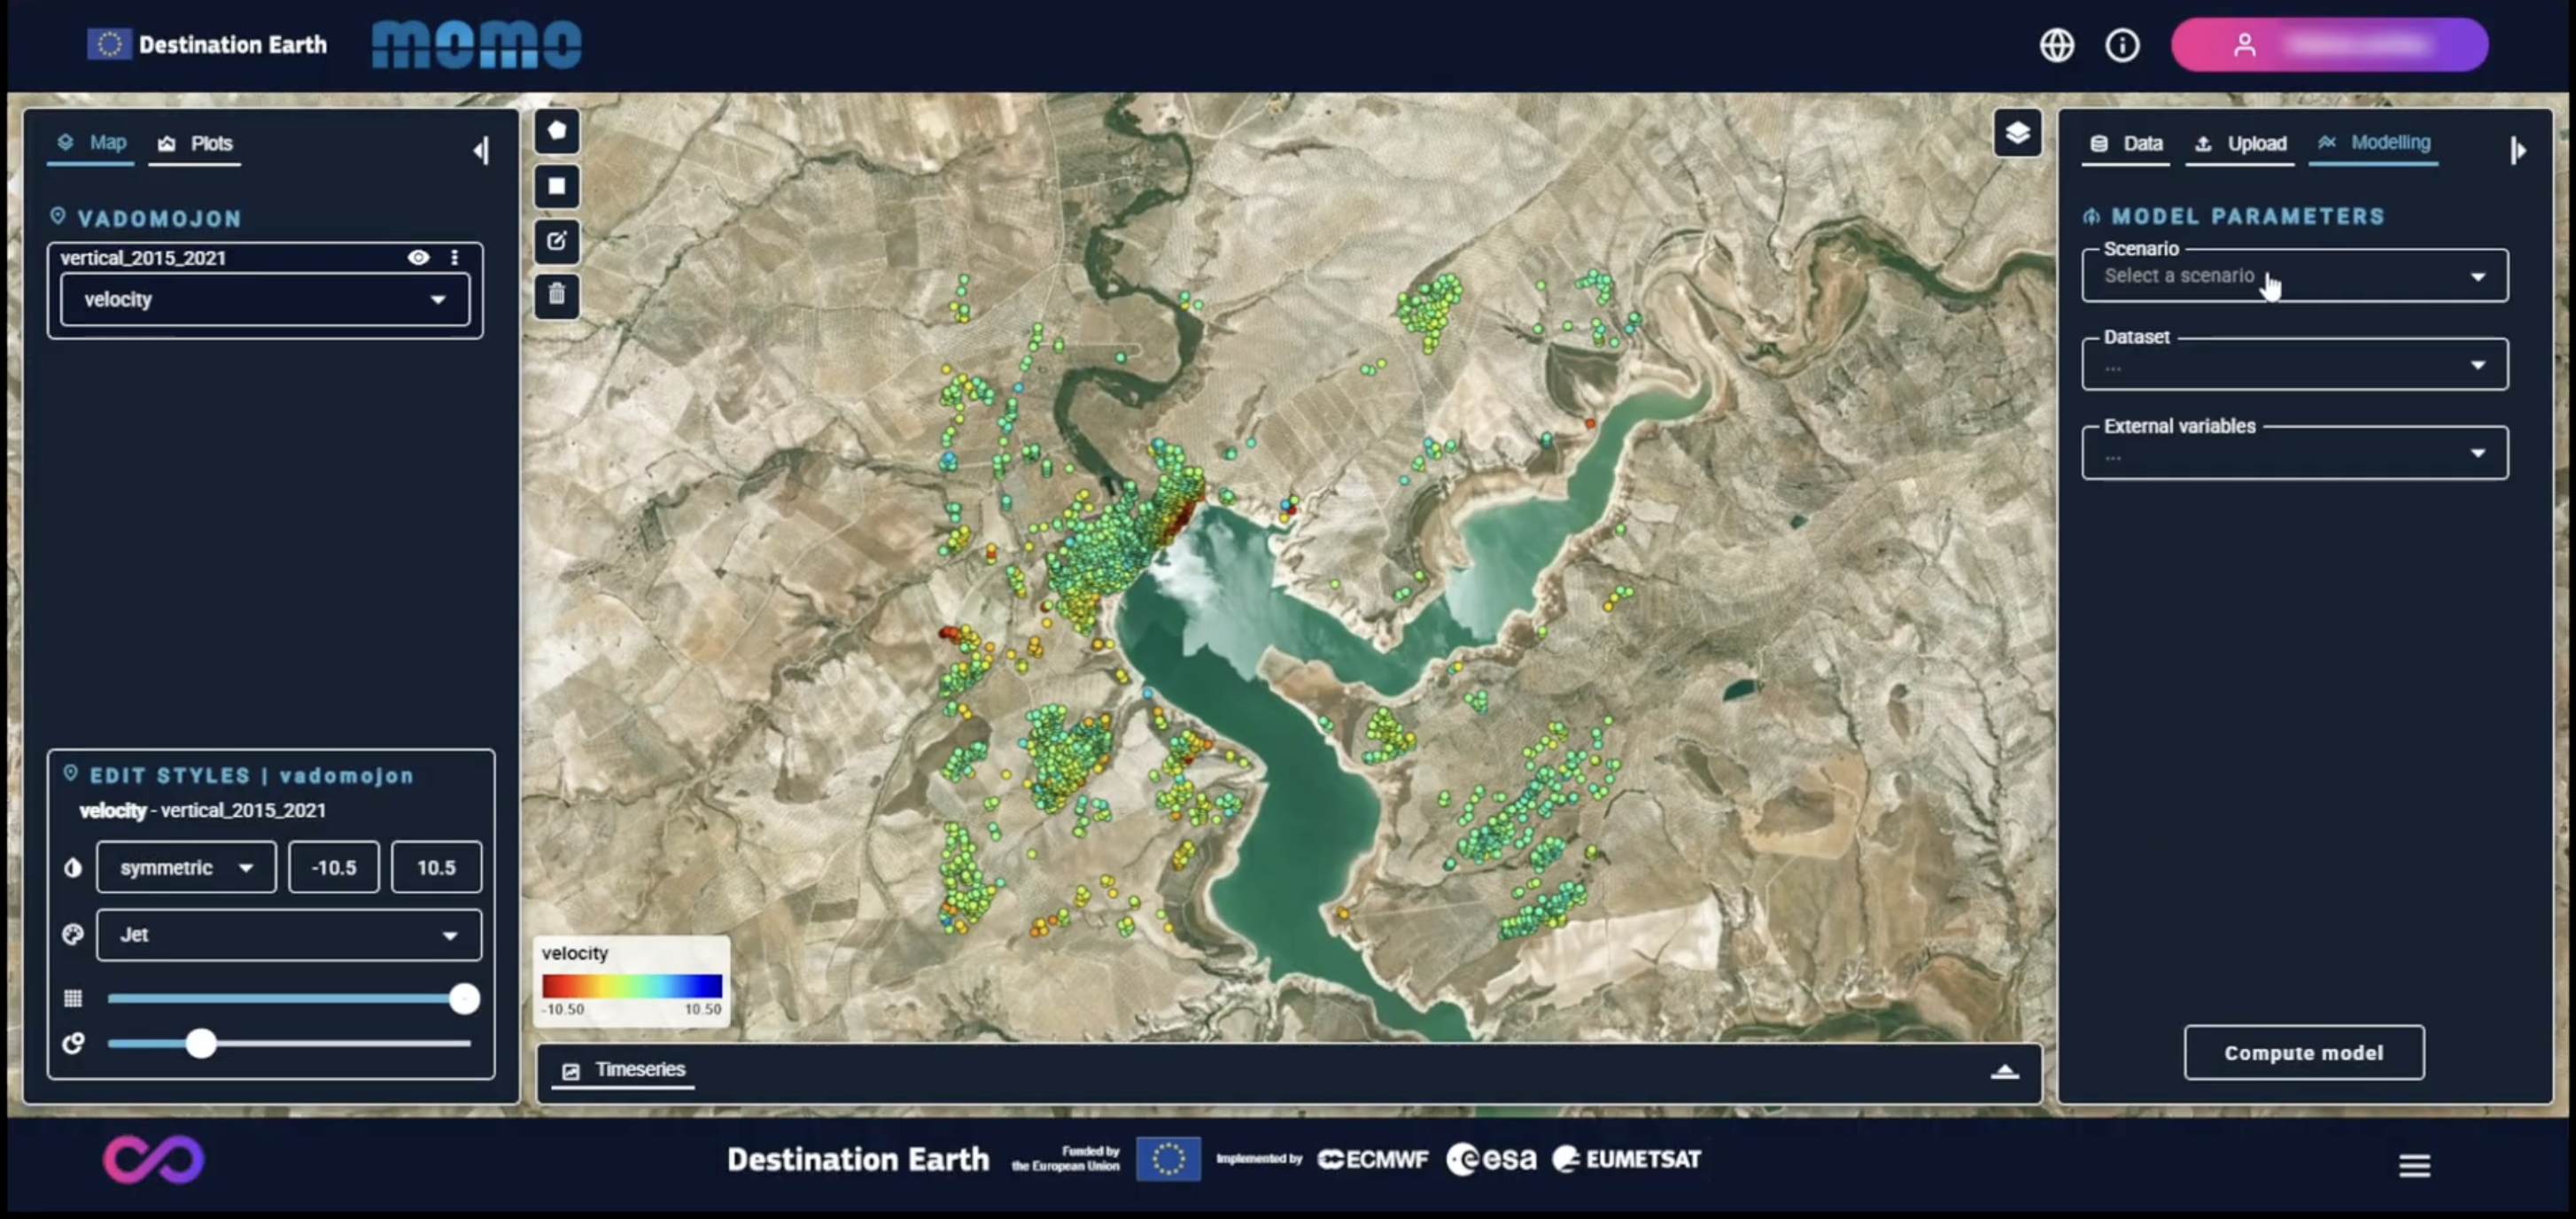
Modelling configuration
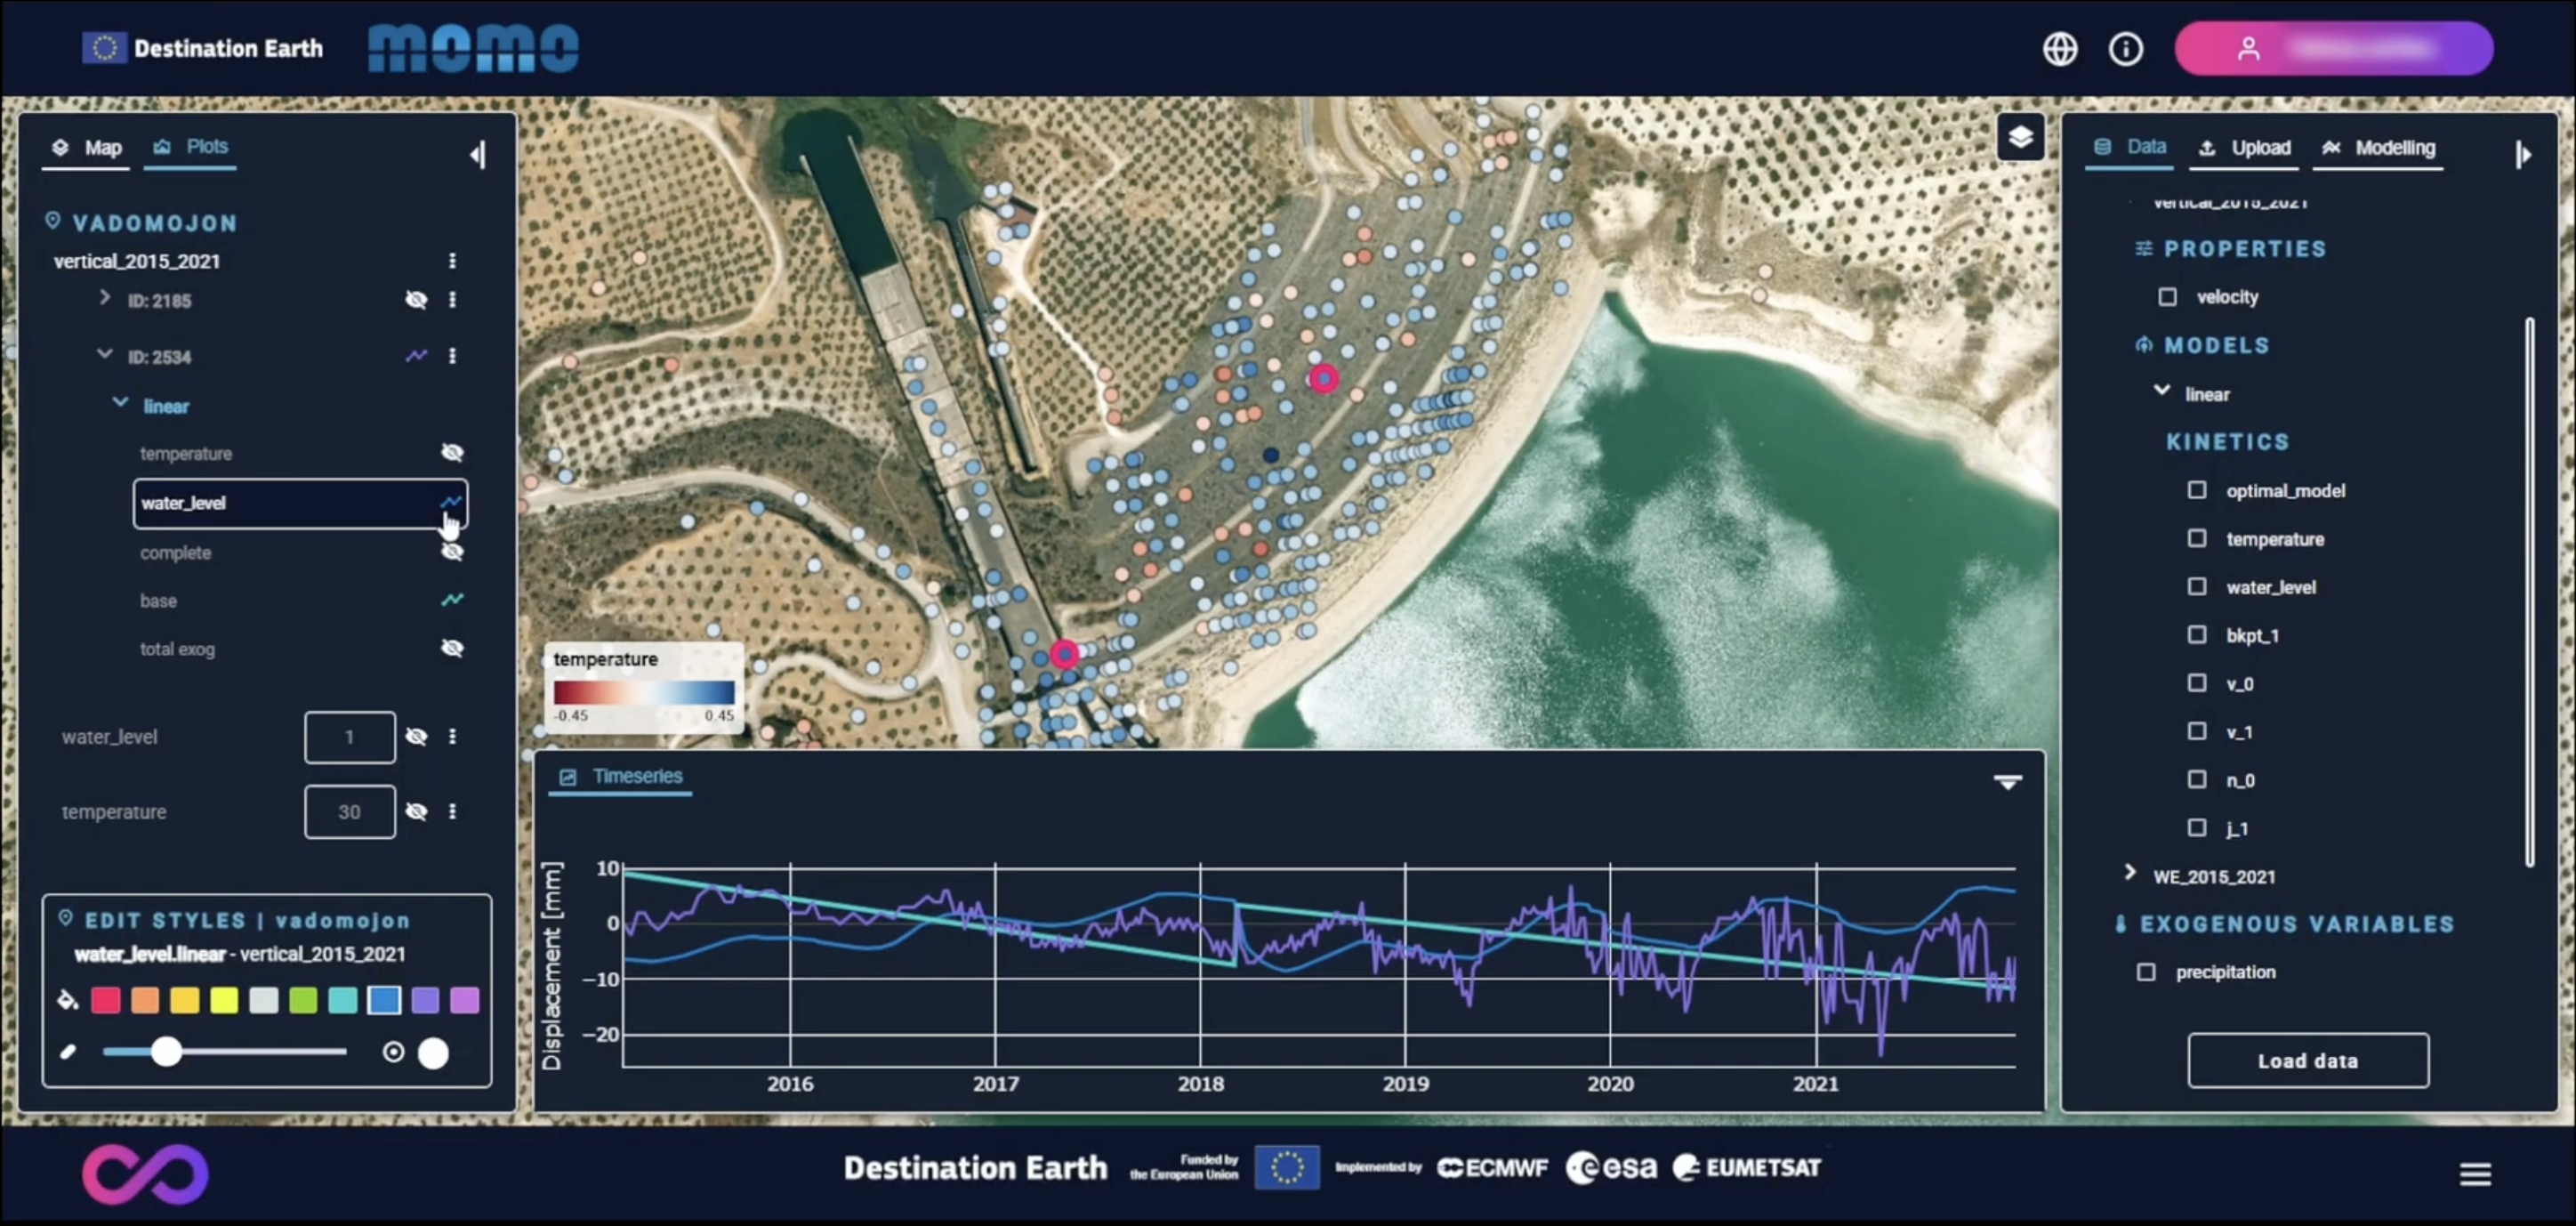
Decomposed model graph
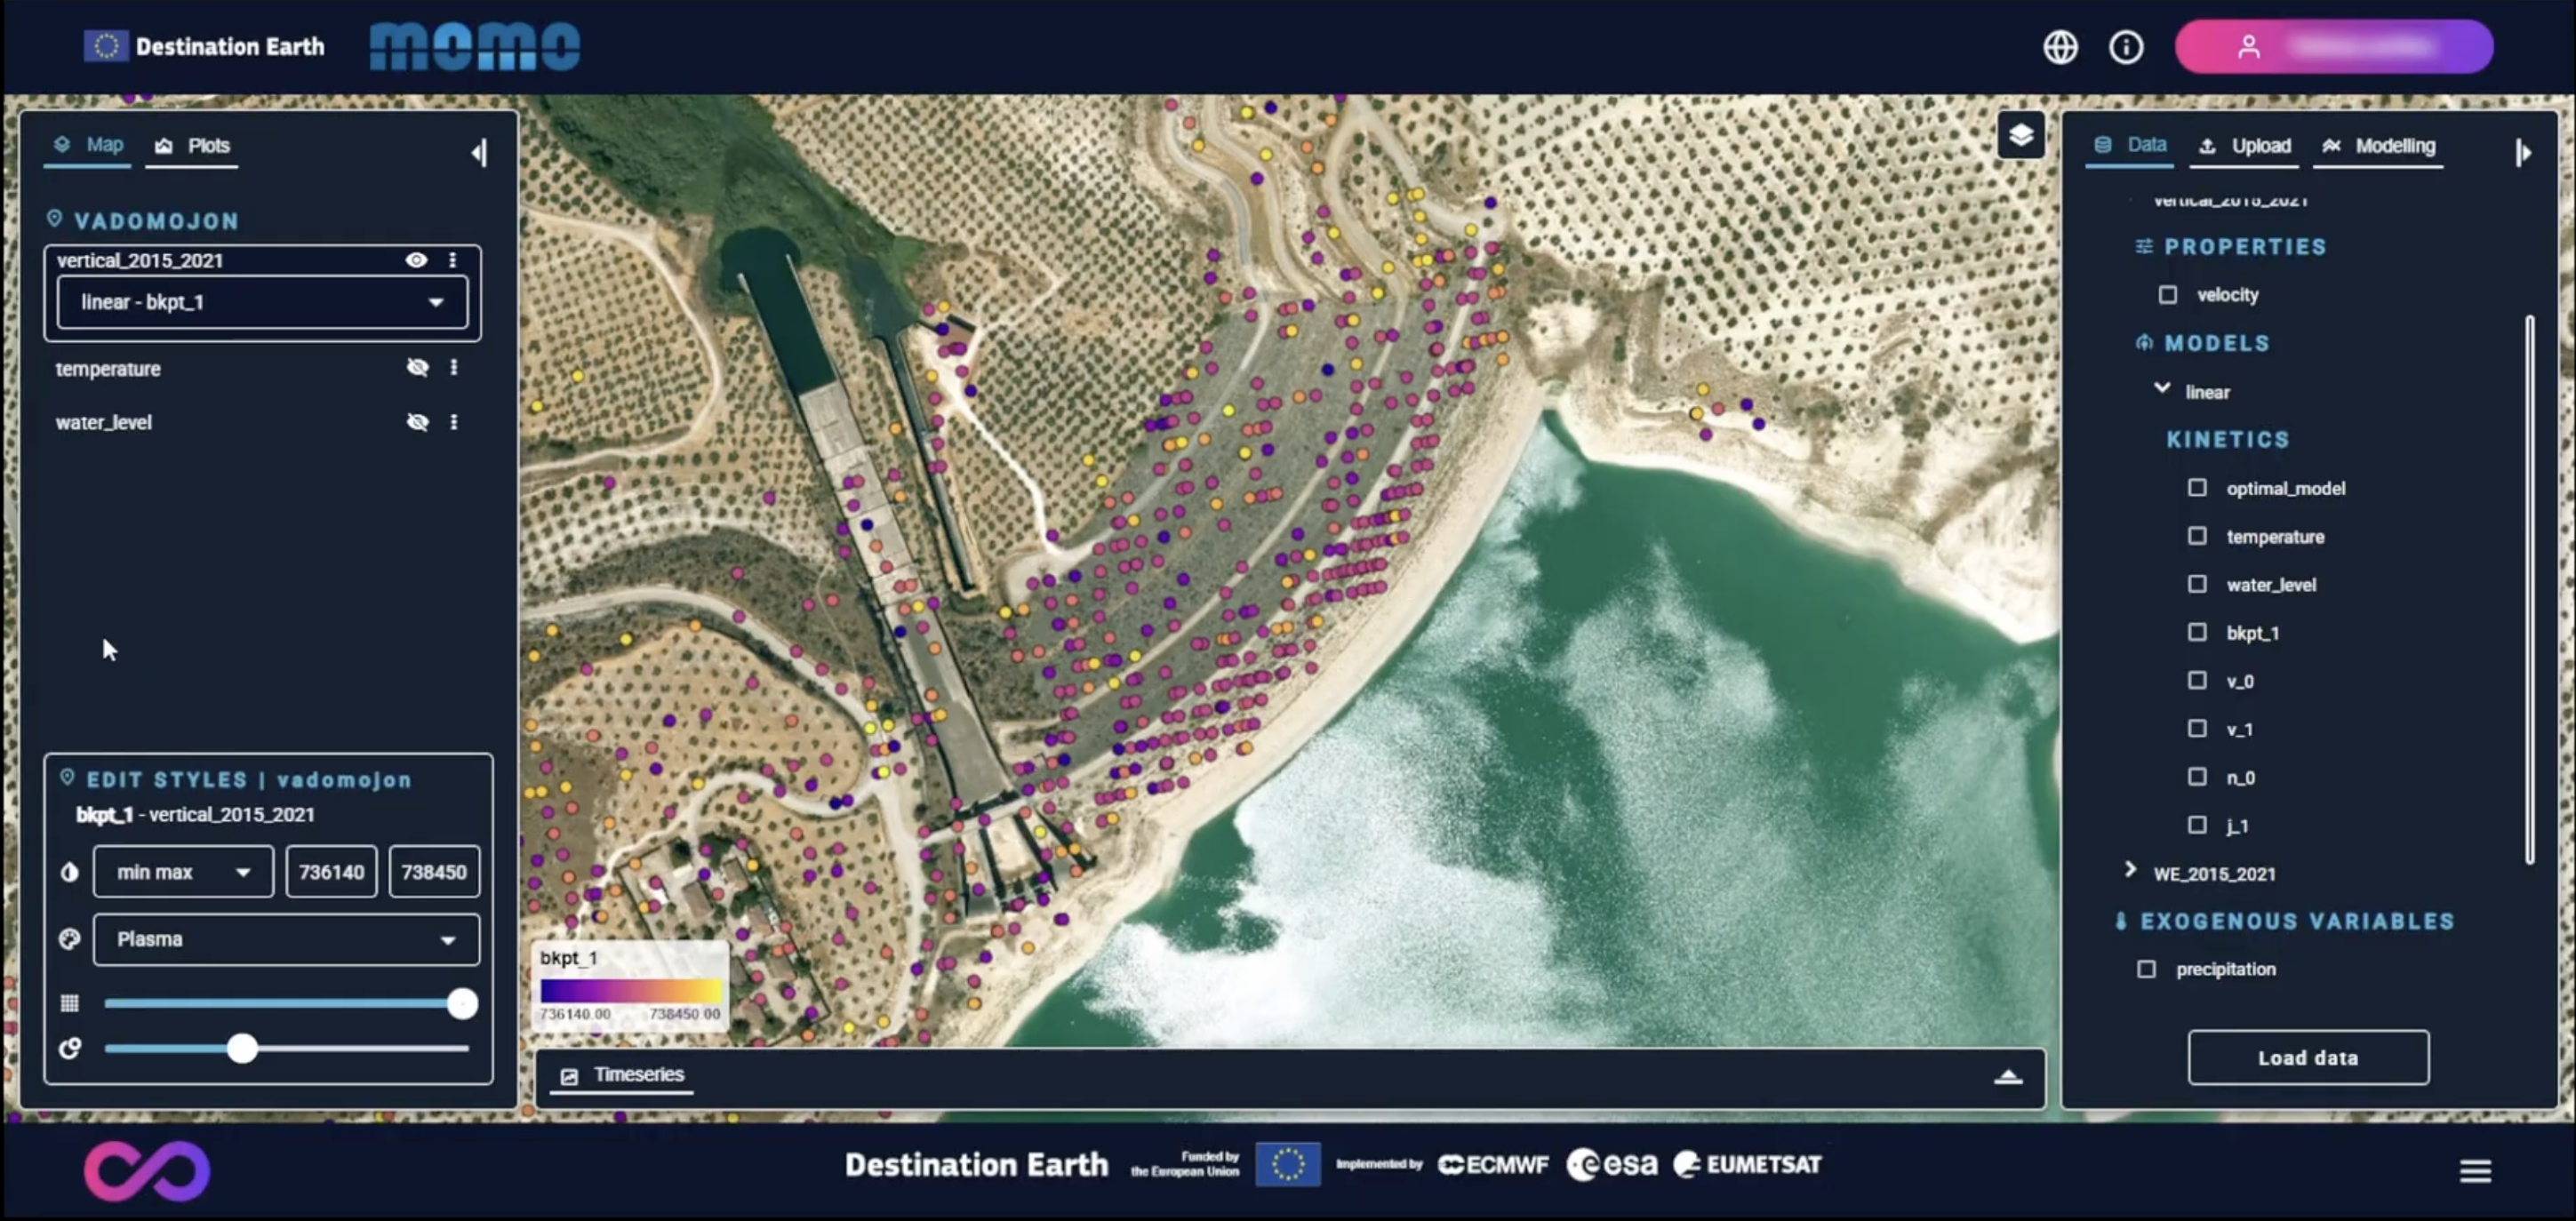
Breakpoint map visualization