Map Visualization and Styling
Displaying Deformation Points
When a dataset is loaded (from the Data tab on the right-hand side panel), deformation points are displayed on the map. Each point corresponds to a single deformation time series associated with a specific geographic location.
All properties loaded for the selected dataset are accessible through the interface. Users can select one property per dataset to be visualized on the map and adjust its appearance using the Styling and Legends panel.
Dataset visibility on the map can be controlled using the eye icon, which allows users to enable or disable the display of a dataset layer.
Additional dataset-specific actions are available through the context menu (three-dot icon) located next to the dataset name. This menu provides access to functions such as zooming to the dataset extent or removing the dataset from the map.
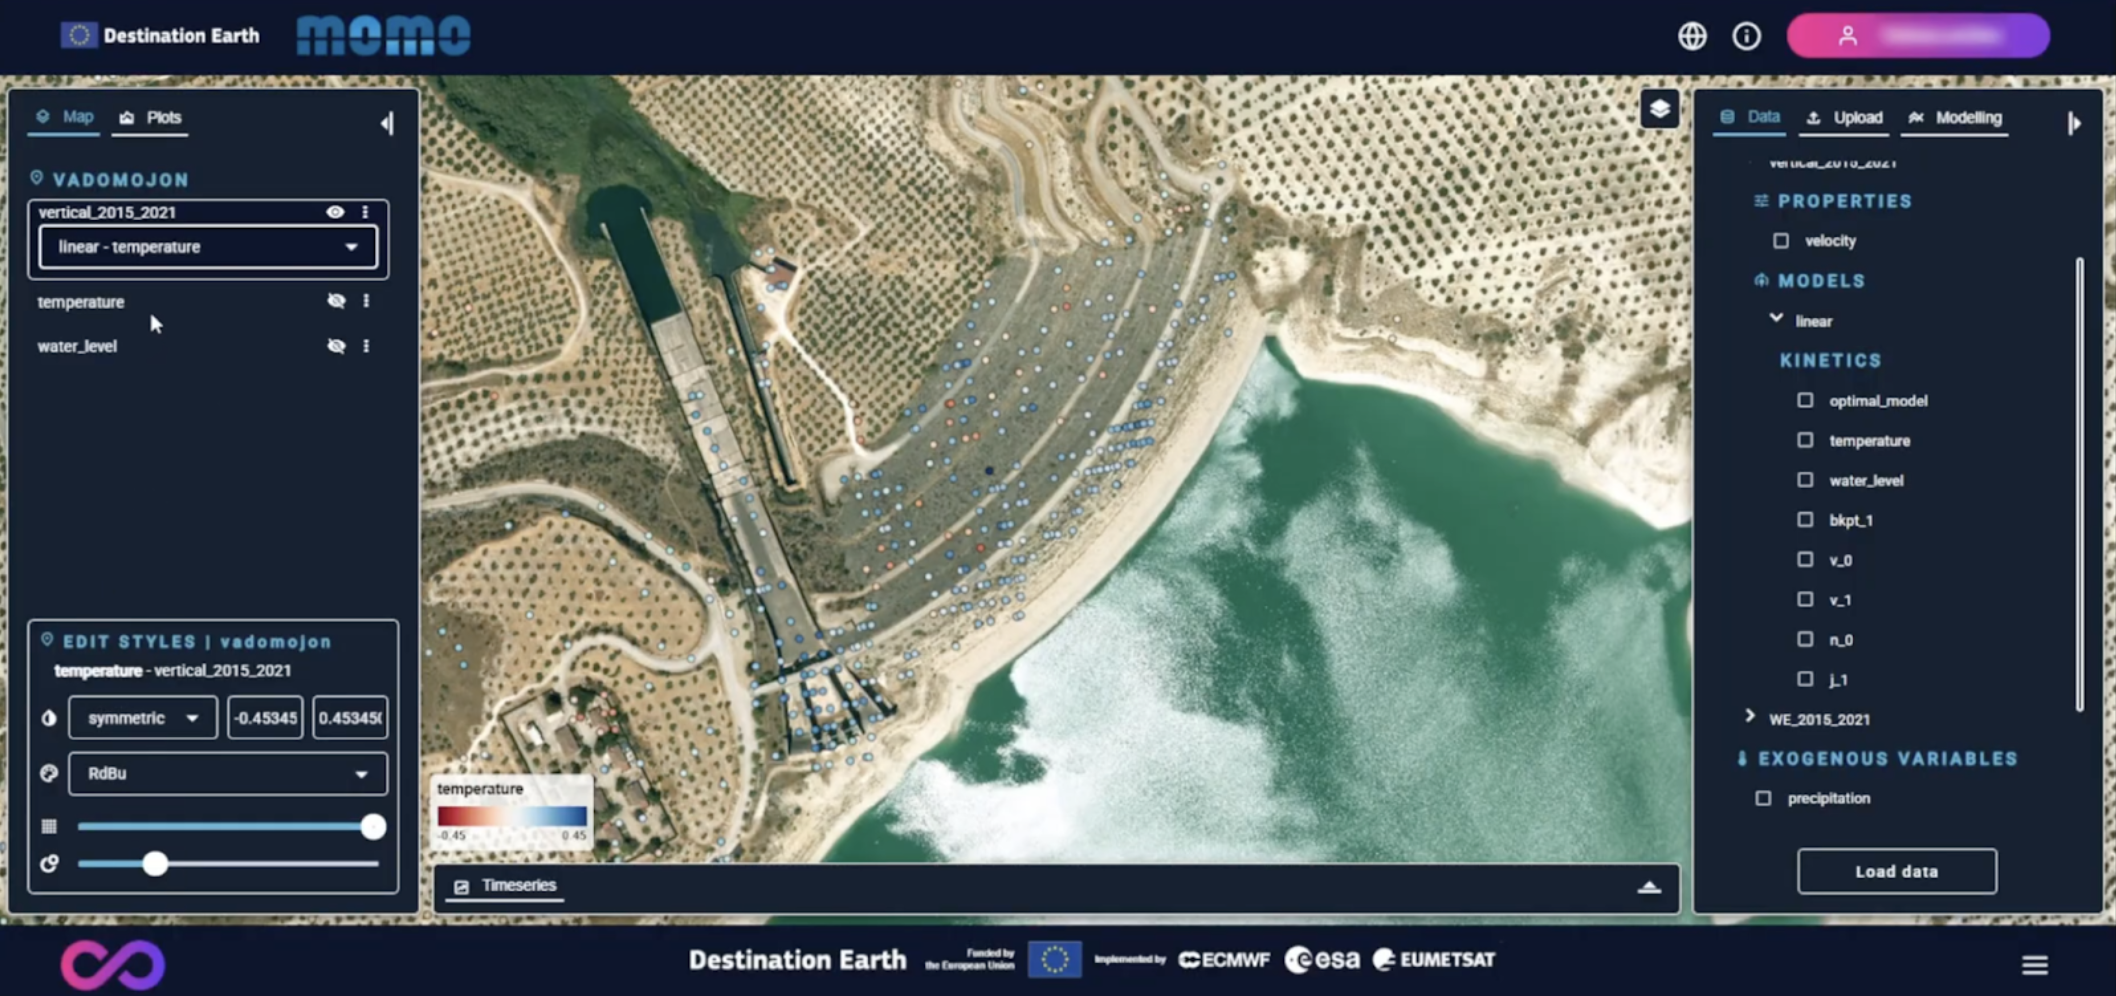
Map left-panel tab
Map Style Editor
The Map style editor is located on the lower part of the Map Tab (left-hand side panel). It allows users to control how deformation points are displayed on the map.
The styling panel is active for the dataset property currently selected in the upper section (highlighted within a box), and the dataset name is also displayed within the styling panel.
Available options include:
Adjusting color palettes and value ranges
Modifying point size and transparency
These controls help emphasize spatial patterns and highlight areas of interest.
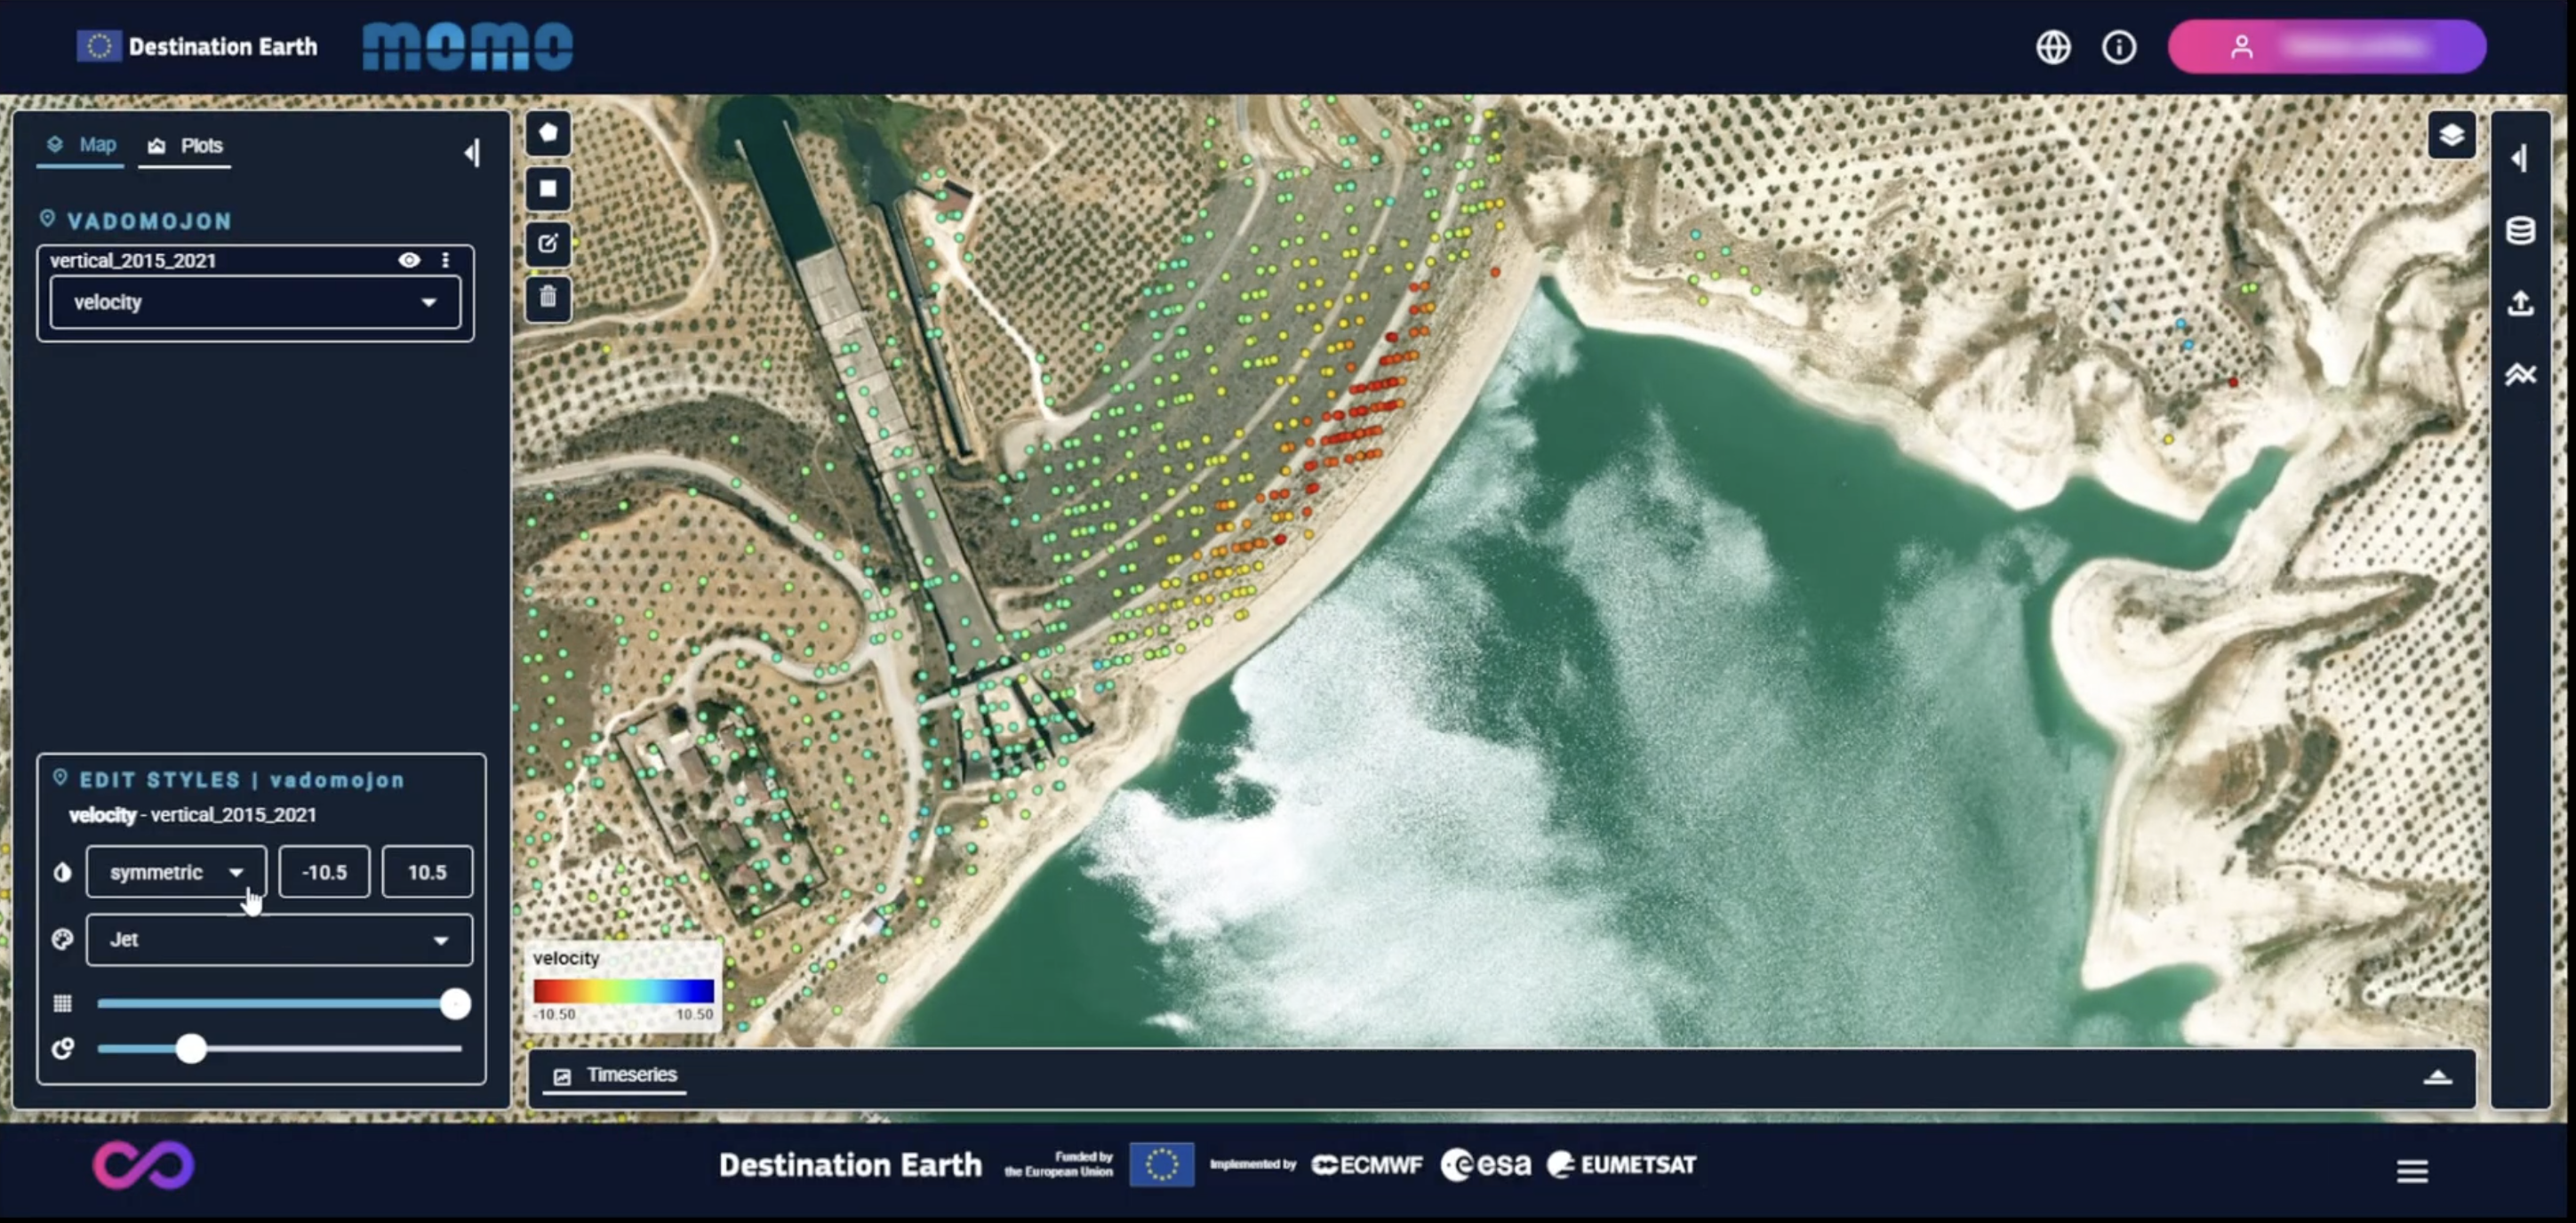
Velocity map styling