Data Management
Data and Projects
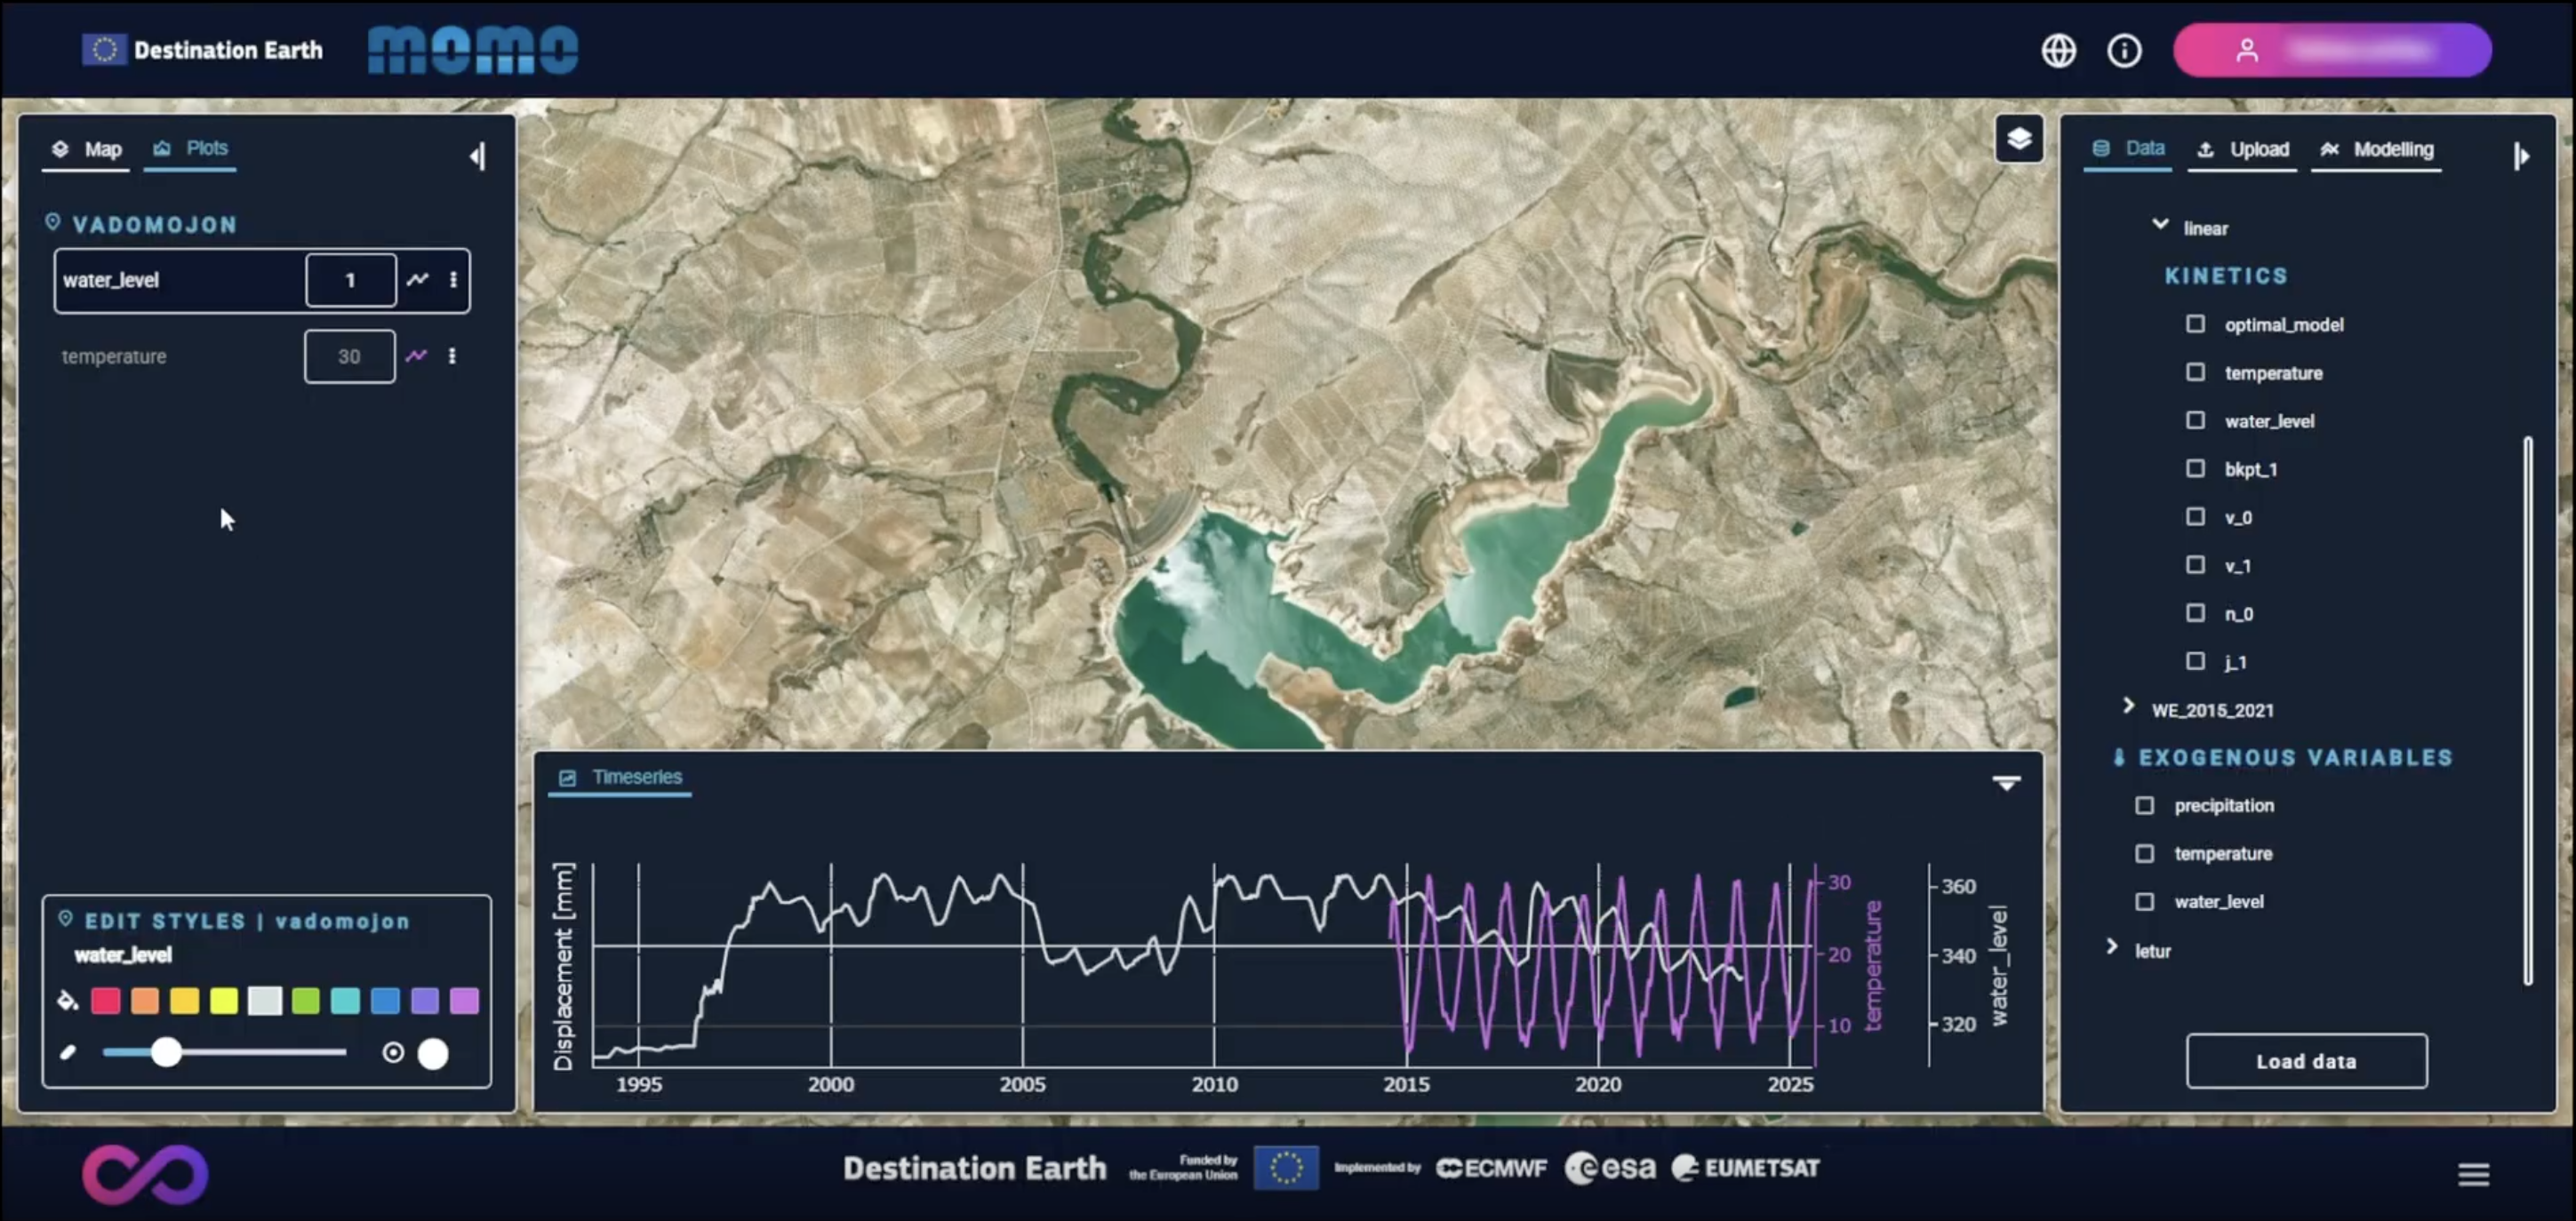
The Data tab provides access to all data available to the user and is organized into two main groups: 1) Scenarios and 2) Exogenous Variables.
Scenarios
Scenarios correspond to specific areas of interest or use cases and serve as the top-level organizational element for deformation data.
Within each scenario, one or more datasets are available. Each dataset represents a collection of georeferenced deformation points associated with the same area of interest.
For each dataset, two categories of information are available: 1) Properties and 2) Models.
Dataset Properties describe intrinsic characteristics of the deformation points and can be visualized spatially on the map (Mean Velocity, Temporal coherence, Height…).
The user can select the datasets and the specific attributes to be used. Once the selection is defined, the “Load data” action retrieves the selected information, renders it on the map, and makes it available for further analysis and interaction.
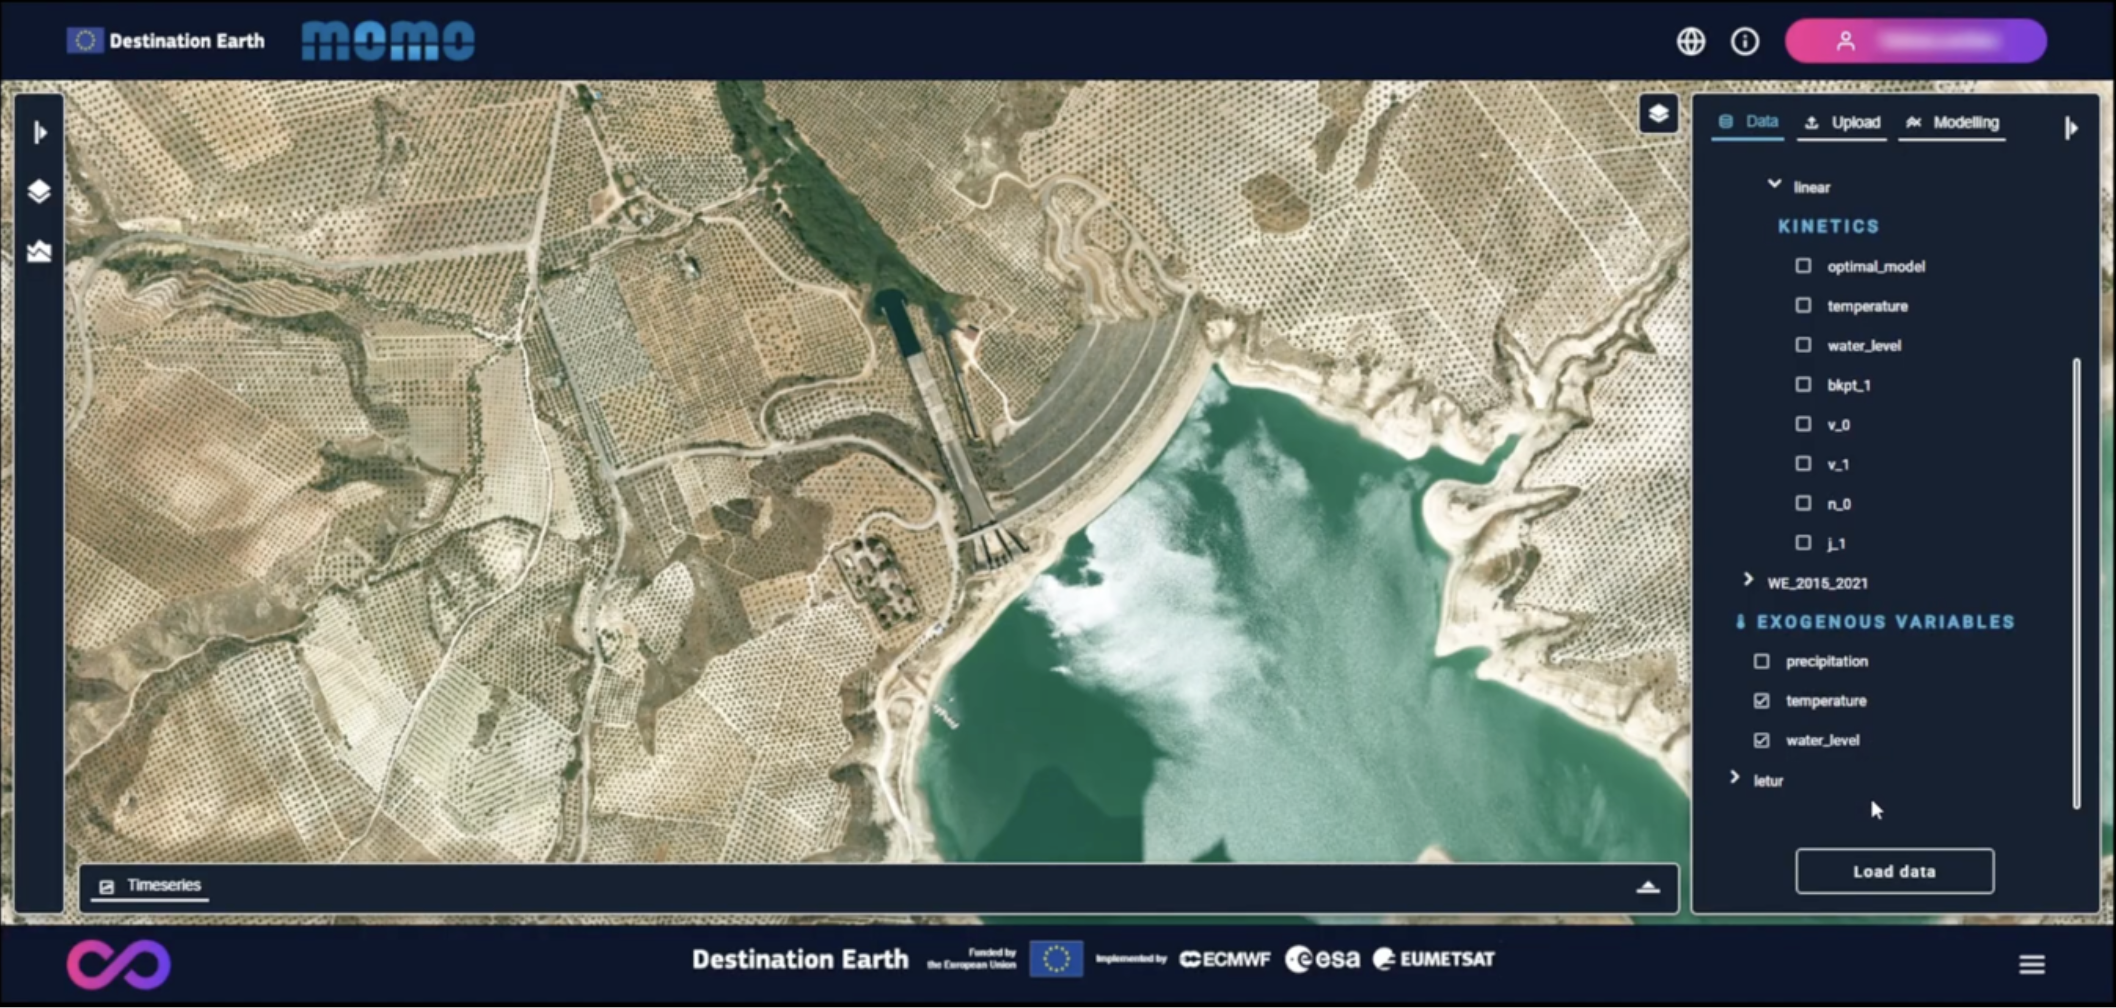
Dataset Models. Each dataset may have one or more associated models. Models describe the temporal behavior of deformation points and can differ in structure or complexity.
A model is defined by a set of components that characterize the deformation behavior, which may include:
The optimal model selected to best fit the time series at each point (
optimal_model).Contributions from external variables, such as temperature and precipitation.
The date of breakpoints (if present) in the deformation time series (
bkpt_1)The estimated deformation velocity before and after a breakpoint (commonly referred to as
v_0andv_1)The displacement jump associated with the breakpoint (
j_1, expressed in millimeters).
These model components can be visualized and analyzed at point level spatially on the map. Map-based visualization and styling are controlled through the left-hand panel, enabling users to interpret deformation behavior and its driving factors.
Exogenous Variables
The Exogenous Variables group provides access to external time series (e.g. climatic or hydrological variables) that can be visualized alongside deformation data.
Standard Mode users can only visualize already uploaded data, meanwhile Advanced Mode users can also upload new variables (through the Upload tab).
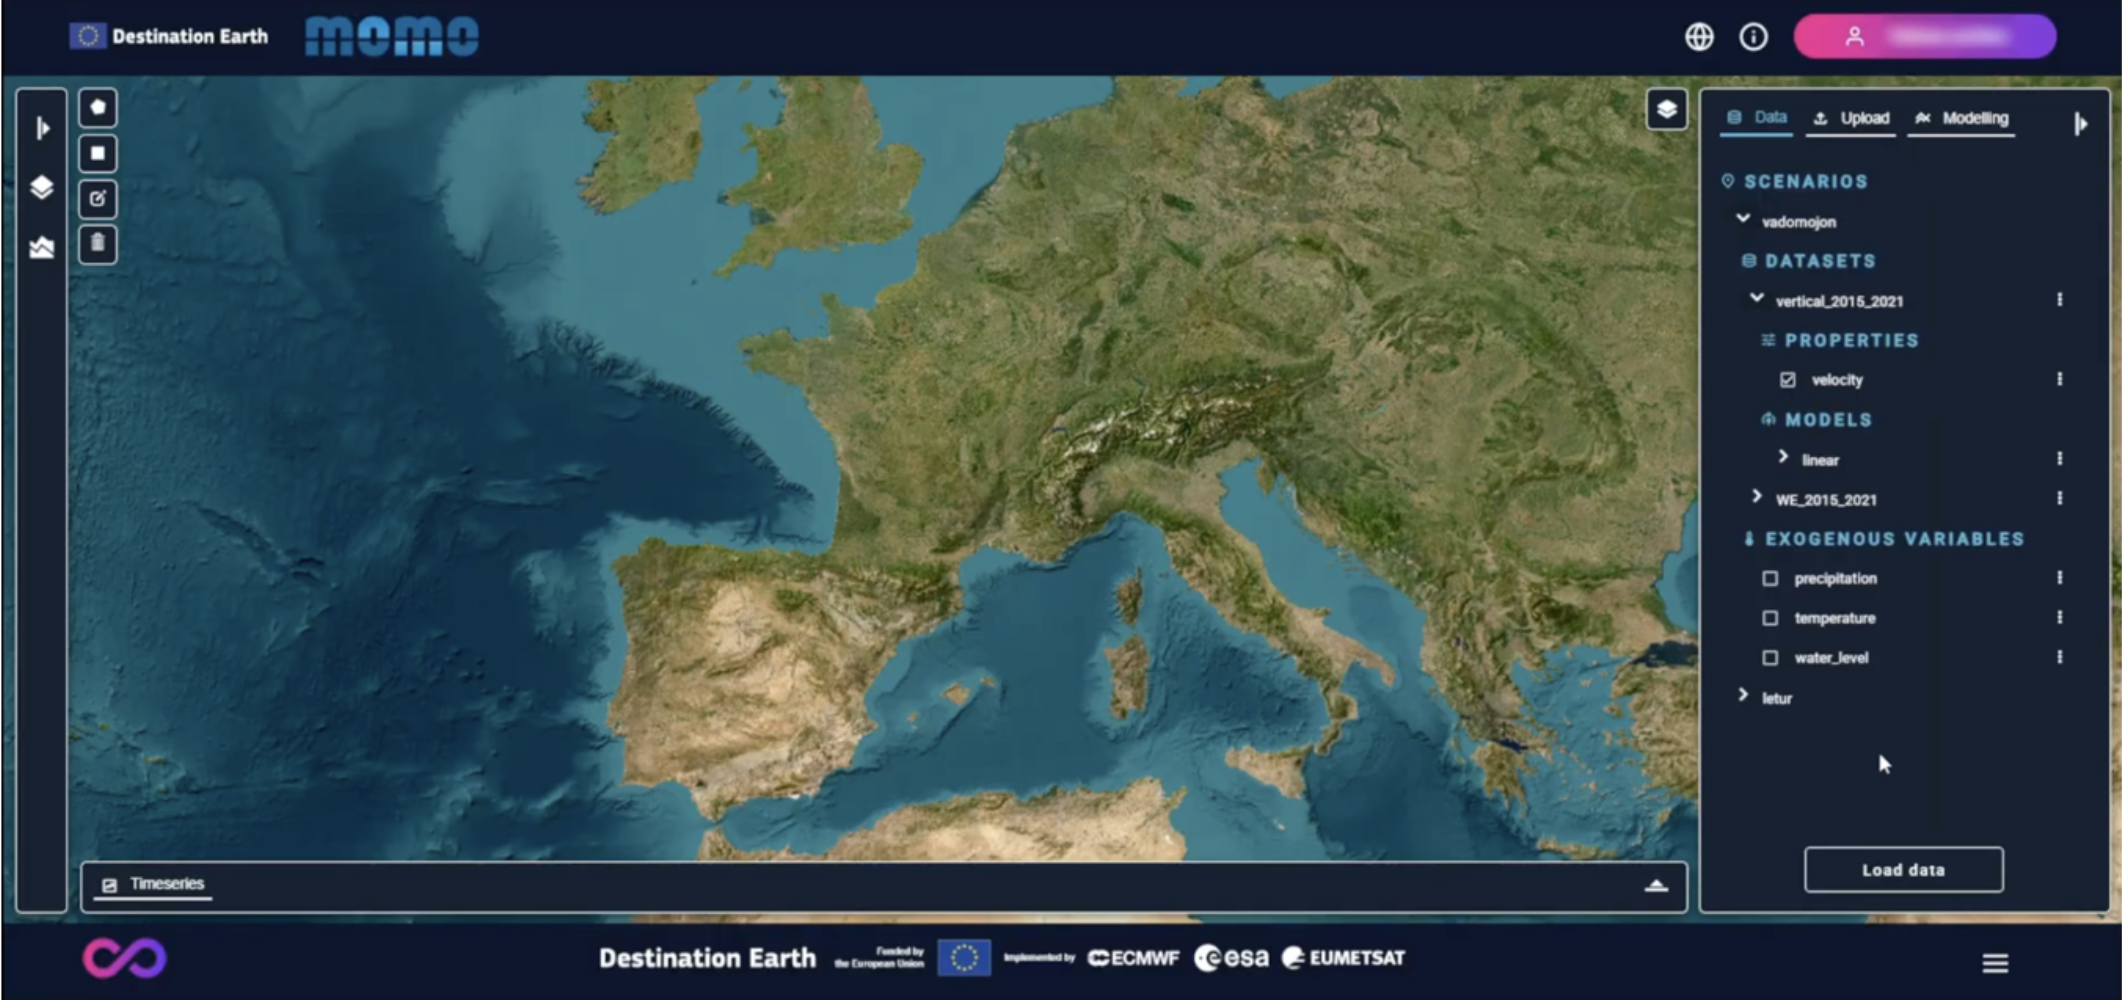
Scenarios overview
External variables selection
Uploading Data
The Upload tab is available only to Advanced Mode users and allows the import of additional data into MoMo.
Currently, supported inputs include:
InSAR deformation datasets (currently limited to EGMS datasets provided via download links). At present, only EGMS datasets can be uploaded. When uploading EGMS data, the following aspects must be taken into account:
The full EGMS download link must be provided, including a valid access token. Tokens typically expire after 60 minutes and must be regenerated if they expire before uploading.
At least one dataset property must be selected prior to uploading the data.
An area of interest must be defined by drawing a polygon on the map. The selected area must fall within the spatial extent of the EGMS file chosen for download.
Exogenous variables, currently limited to temperature and precipitation time series. When uploading exogenous variables, it is recommended to select time series that start at least a few months before the beginning of the InSAR deformation time series. This ensures sufficient data coverage when applying smoothing operations (e.g. moving averages) during model configuration and fitting.
Once uploaded, datasets and external variables become available within the user’s private data space, under the corresponding scenario, and can be loaded onto the map for visualization and analysis.
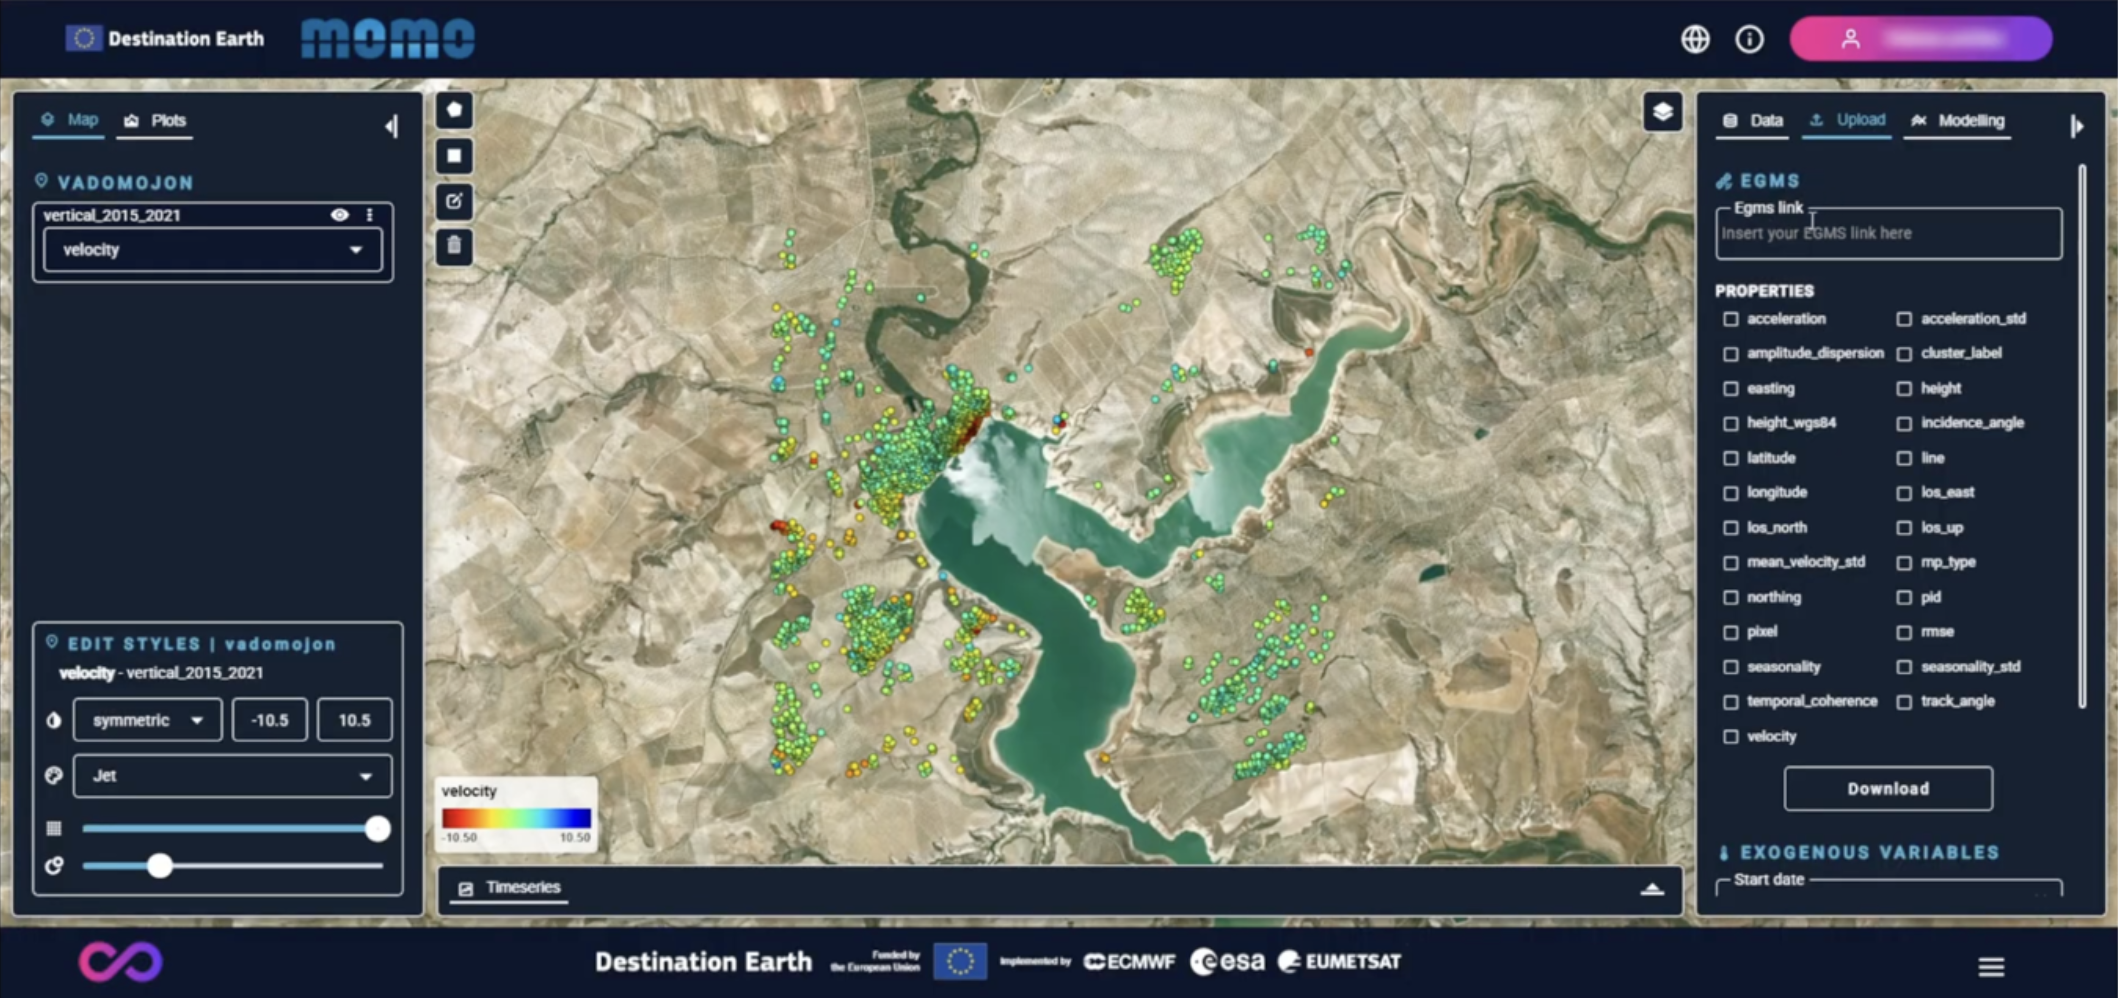
Upload tab – InSAR and external variables
Modeling Tab
The Modeling tab is available only to Advanced Mode users and it provides access to deformation modeling functionalities within MoMo.
In this tab, users can:
Select the dataset to which the model will be applied
Select one or more external variables to be included in the model
Apply smoothing windows (e.g. moving averages) to account for delayed or cumulative responses.
Execute the new deformation models
Once the model execution is completed, a floating window (pop-up) is displayed. In this window, the user is required to define a model name and then confirm the action to upload the results to their private data space.
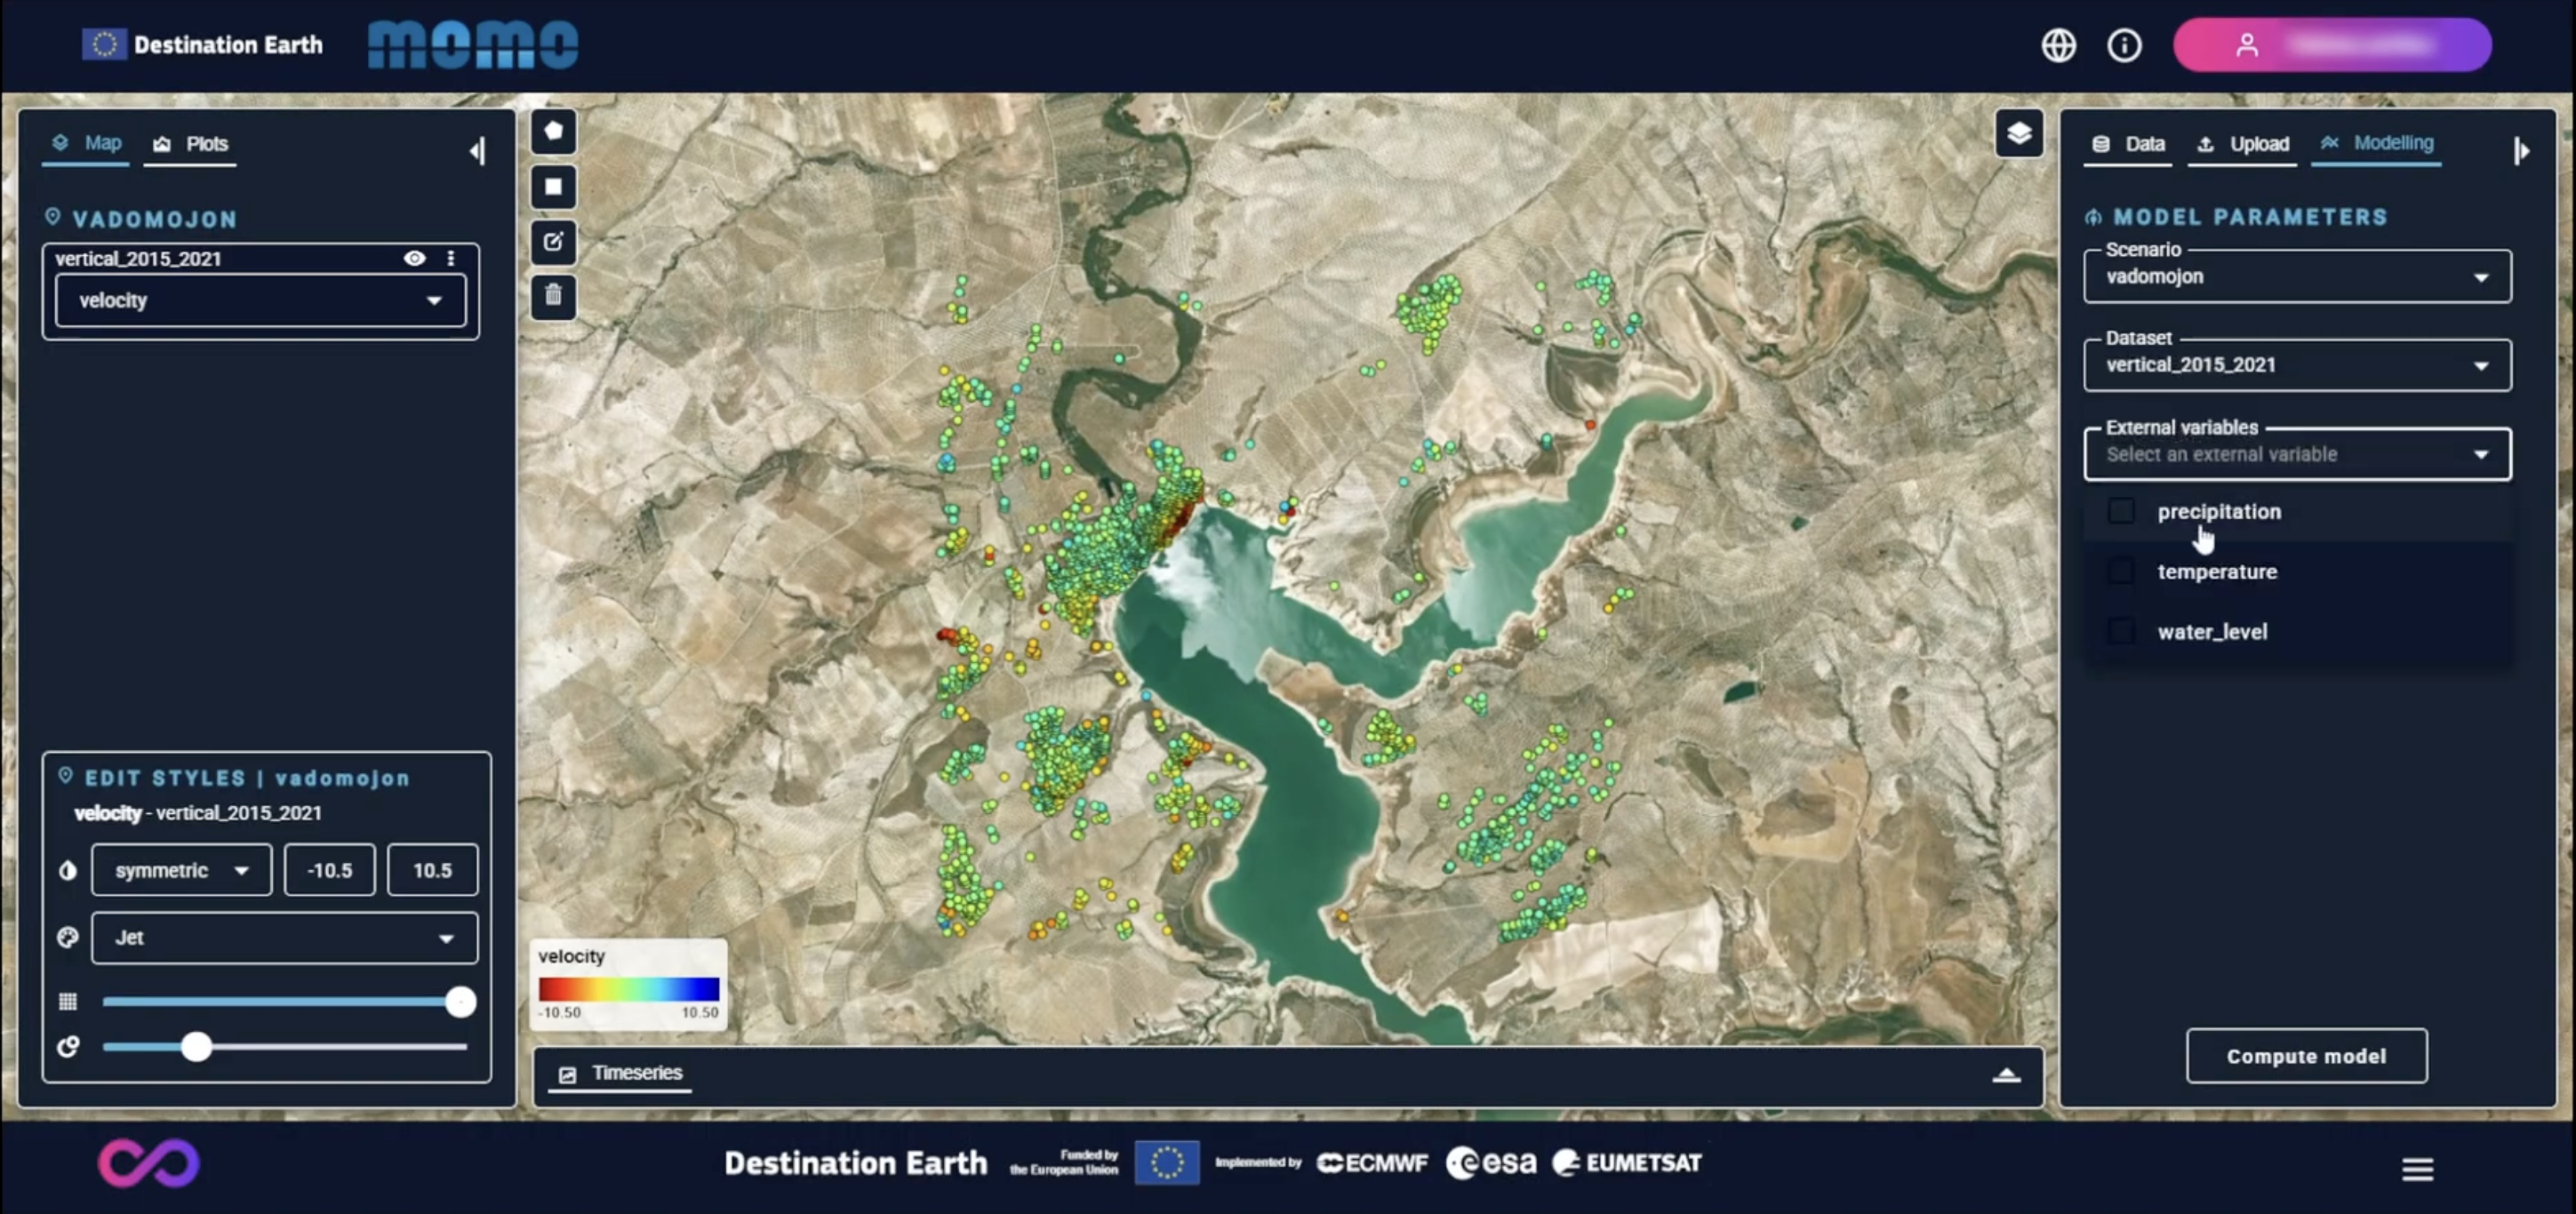
Modelling tab overview in Standard Mode
Smoothing data configuration