Time Series Exploration
Selecting Points
Clicking on a point highlights it on the map with a red circle/ring and automatically displays its deformation time series in the bottom panel.
Multiple points can be selected to compare deformation behavior across different structural elements (e.g. dam crest vs. spillway).
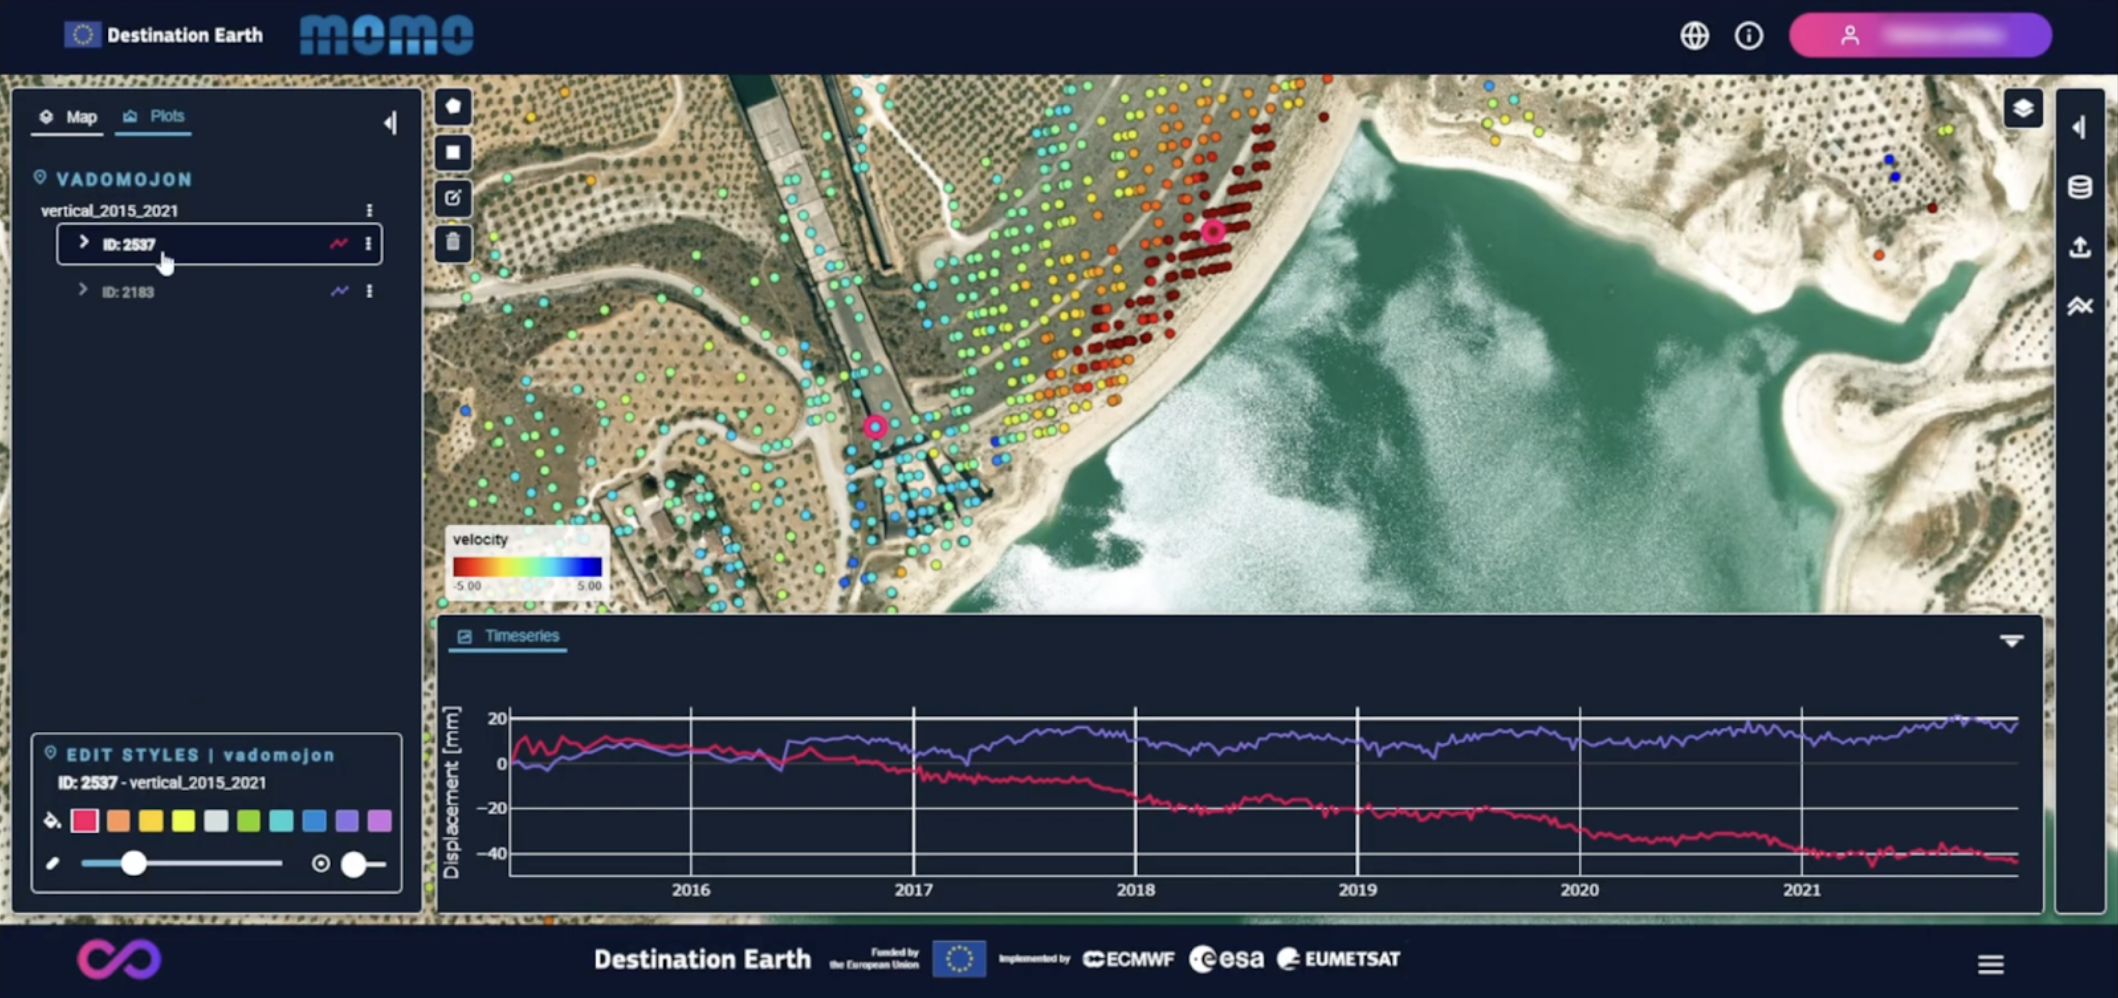
Single and multiple point selection
Managing Plot Display
The Plot tab on the left-hand side panel allows users to adjust which series are visible in the time series panel.
Users can:
Show or hide individual series
Focus on specific components when models are available
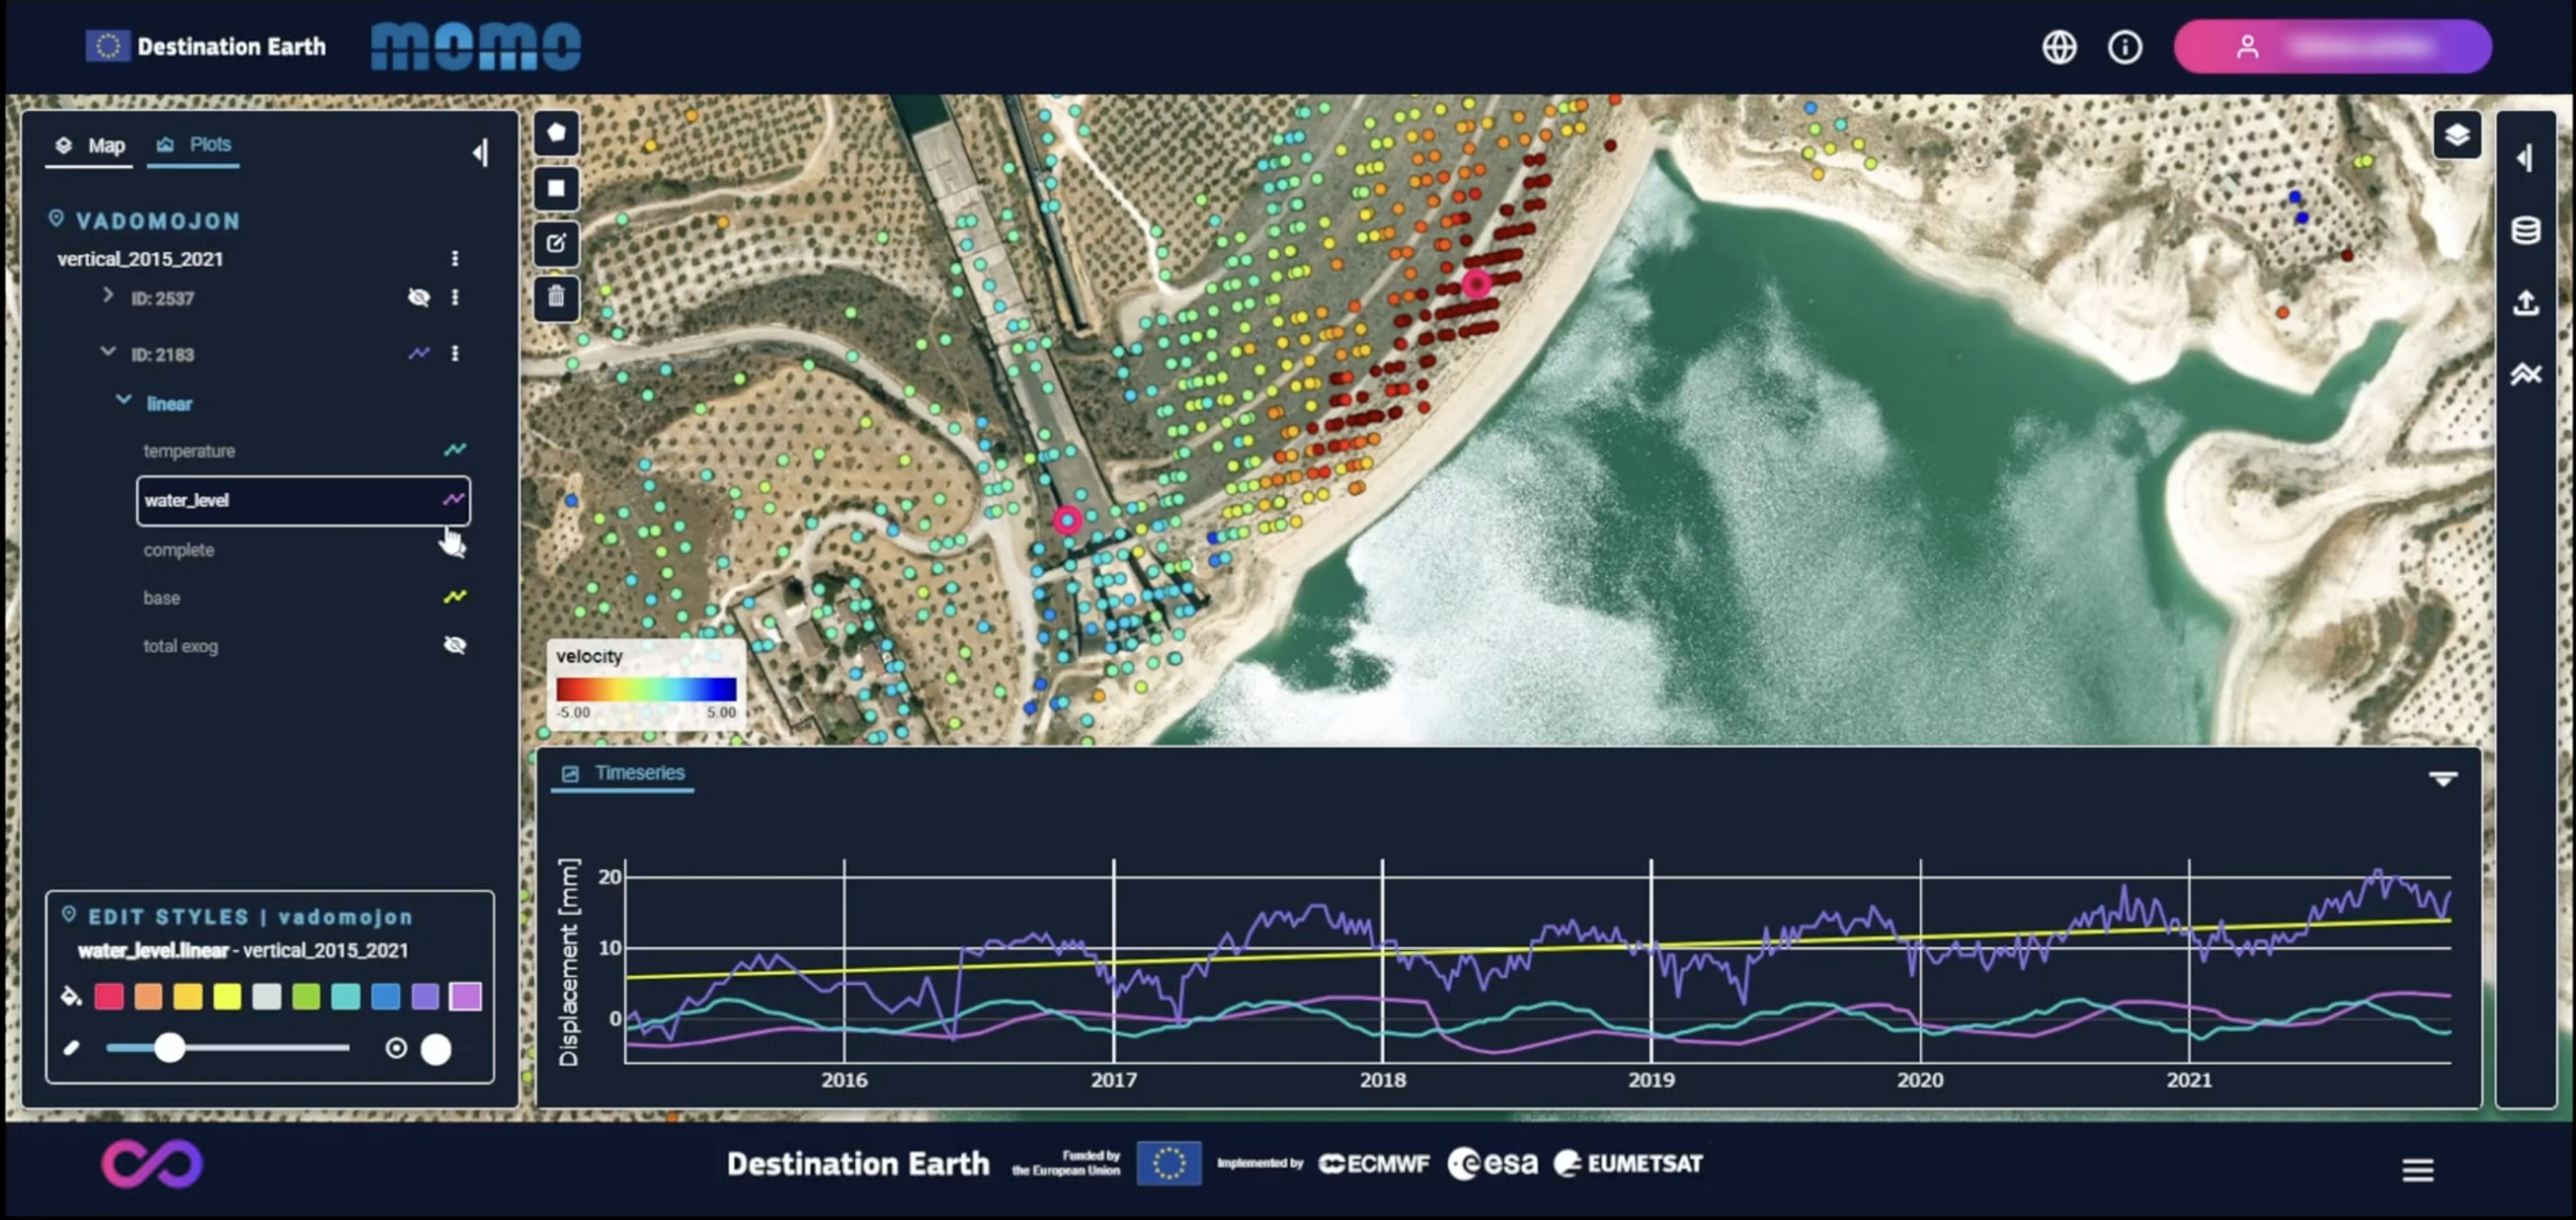
Time series plot controls