IFS-FESOM Evaluation
This page provides evaluation of the IFS-FESOM historical, projection, and storyline simulations. For model description and forcing details, see IFS-FESOM and Storyline Simulations.
Assessment of the Historical Simulation
A comprehensive evaluation of the main model biases is provided by the performance index metric in the Performance Index table below, covering a large selection of variables and regions. Performance is evaluated against the mean of the CMIP6 models, with values below 1 (blueish) indicating superior performance and values above 1 (reddish) indicating inferior performance. For most variables and regions IFS-FESOM shows exceptional performance, with values typically below 0.2. The dynamical atmospheric variables show the best performance, while net surface radiation, surface temperature and sea ice concentration present relatively weaker — though still good — scores.
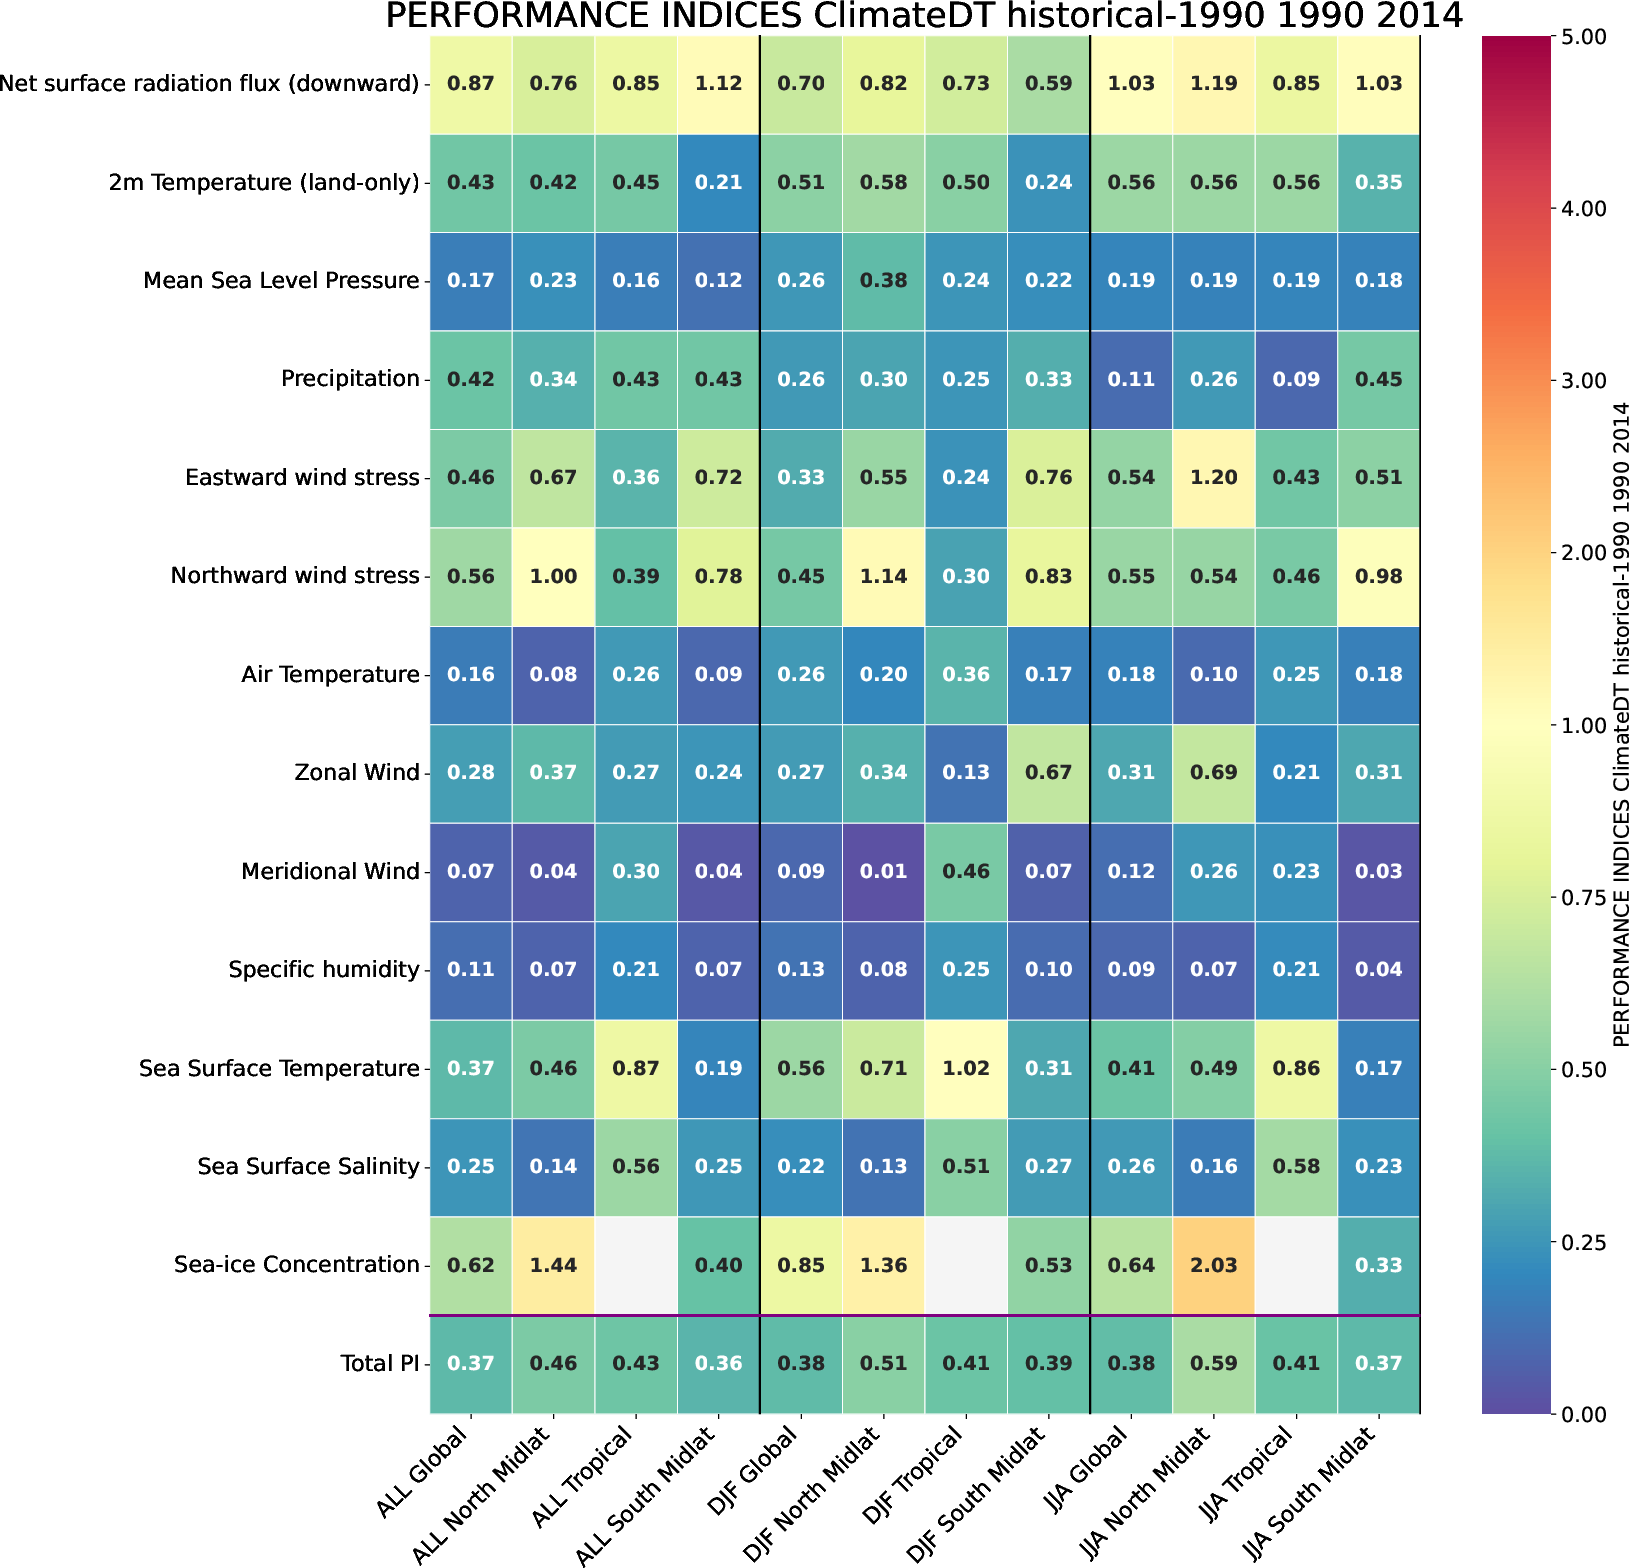
Performance Index table for the IFS-FESOM historical simulation. Performance values refer to the mean of CMIP6 models, with values below 1 indicating improved performance and values above 1 indicating degraded performance.
Global mean temperatures (left panel of the figure below) over the historical period track ERA5 closely, with a small mean-state cold bias of ~0.25 °C. The future projection depicts an acceleration of the historical warming trend. Simulated values of top-of-atmosphere net radiation (middle panel) are within the range of observed values. The Gregory plot (right panel) shows that the simulation stays largely within the observed ranges, with a potential overestimation of the response to Pinatubo in the years following the eruption (i.e. 1991).
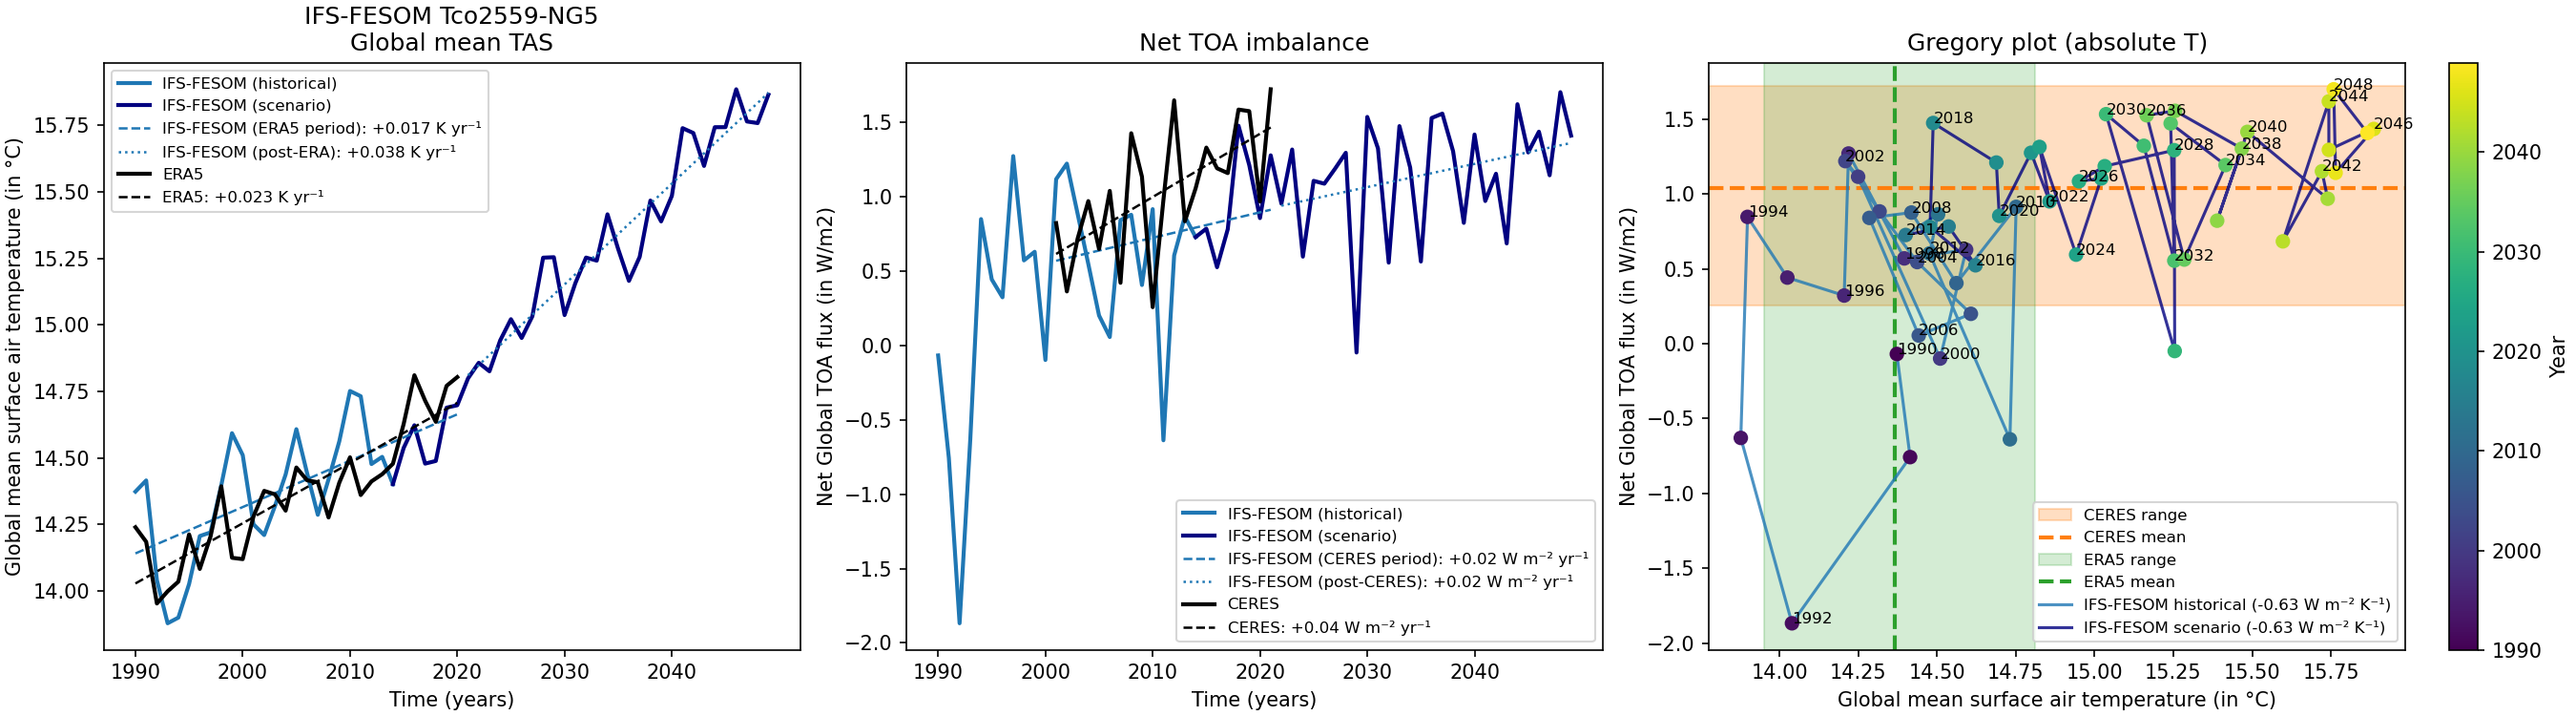
Left: Time series of the globally averaged annual surface air temperature in ERA5 and the historical and scenario IFS-FESOM simulations. Middle: Time series of the net heat fluxes at the top of the atmosphere (TOA), including observations from CERES. Right: Gregory plot of the combined IFS-FESOM simulations. The mean values and ranges of the observed TOA fluxes and global mean surface air temperatures are included for reference.
Spatial maps of mean-state biases in annual surface air temperature (below) show very small differences with respect to ERA5 over the three major ocean basins and most continental areas (global mean bias 0.14 K, RMSE 1.22 K). The global cold bias mostly arises from the Arctic region and the Weddell Sea, likely linked to errors in sea ice representation. IFS-FESOM successfully mitigates the warm biases in eastern boundary coastal upwelling regions (e.g., Humboldt and Benguela currents) that commonly afflict coarser CMIP6 models.
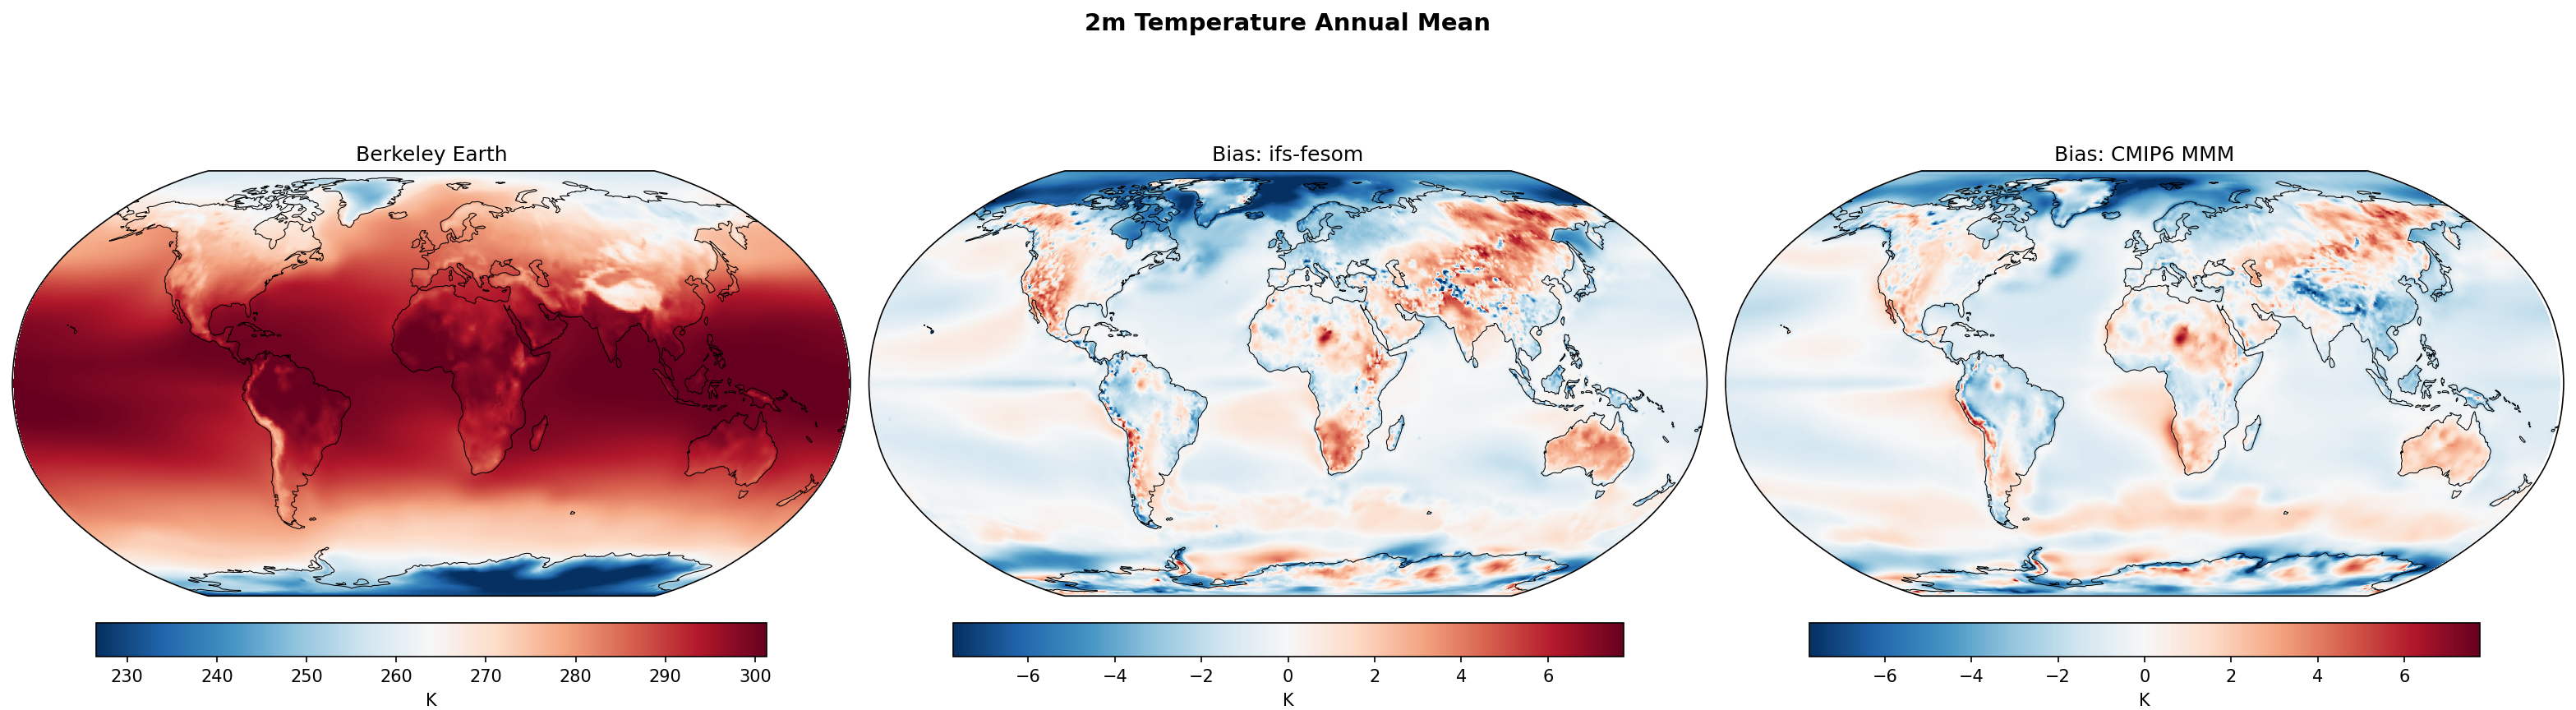
Spatial maps of the climatological biases of annual surface air temperature in the IFS-FESOM historical simulation and the CMIP6 multi-model mean. Biases are computed against Berkeley Earth climatology over the period 1990–2014.
In terms of mean sea level pressure (below), IFS-FESOM performs well (global mean bias -1.59 Pa, RMSE ~101 Pa), comparable to the CMIP6 multi-model mean (RMSE ~87 Pa). The polar regions show positive biases, characteristic of cold high-latitude mean states that are dynamically consistent with excessive surface cooling and sea ice, highlighting the strongly coupled nature of tropical and polar mean-state errors.
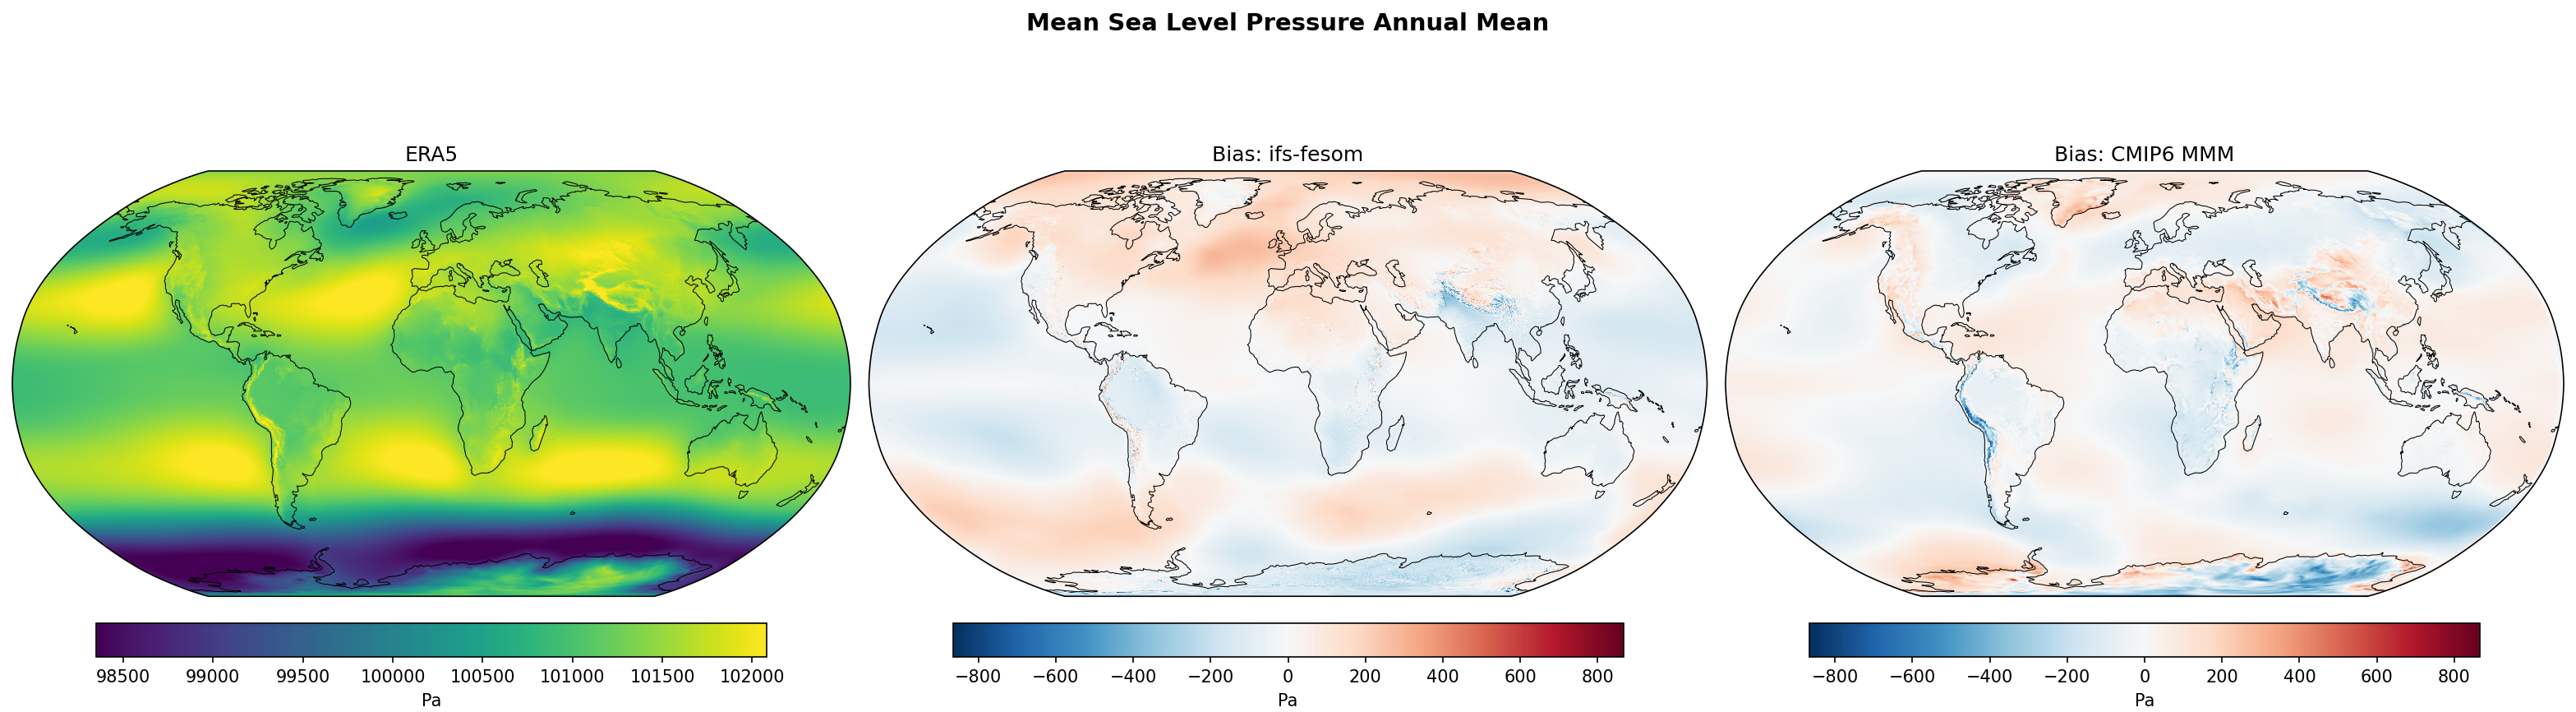
Spatial maps of the climatological biases of annual mean sea level pressure in the IFS-FESOM historical simulation and the CMIP6 multi-model mean. Biases are computed against ERA5 climatology over the period 1990–2014.
IFS-FESOM shows good performance in terms of the climatological annual precipitation rate (below), sharing the broad spatial structure of the CMIP6 multi-model mean, with wet biases along the mid-latitude storm tracks and a dipole pattern in the tropical Pacific indicative of a double-ITCZ or ITCZ displacement error. The amplitude of the tropical biases in IFS-FESOM tends to be smaller than for most individual CMIP6 models.
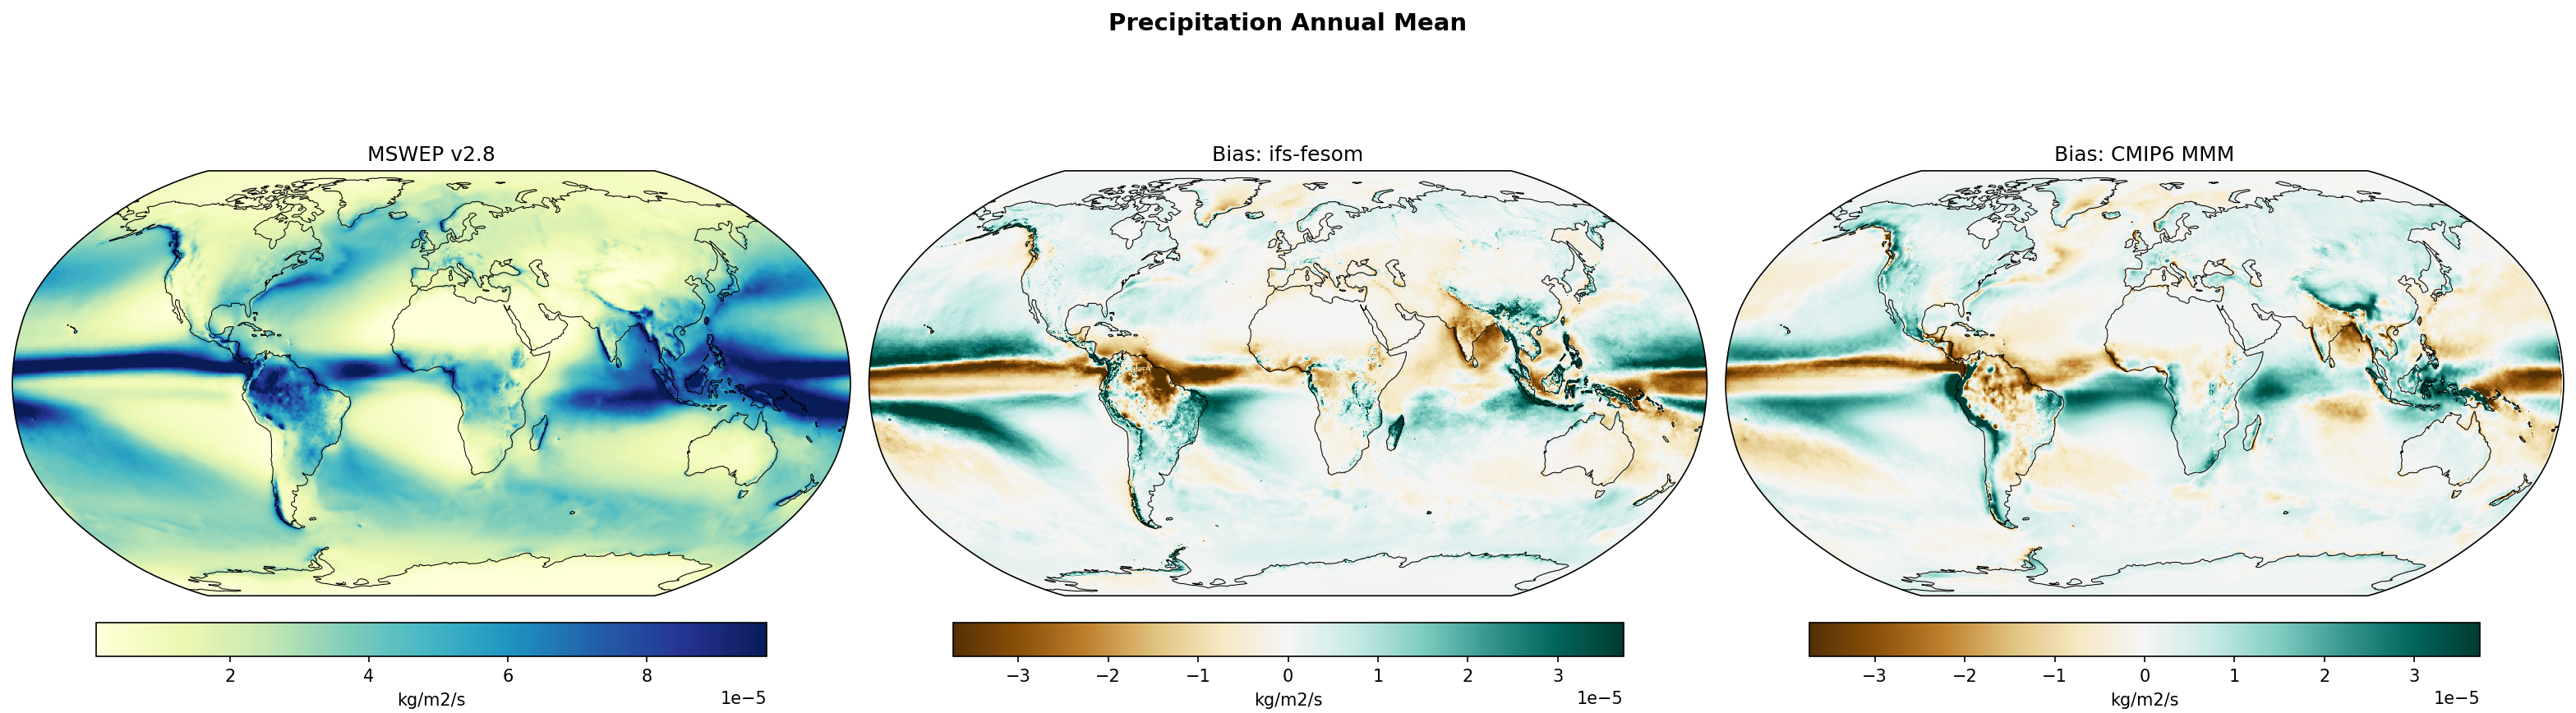
Spatial maps of the climatological biases of annual precipitation in the IFS-FESOM historical simulation and the CMIP6 multi-model mean. Biases are computed against MSWEP climatology over the period 1990–2014.
The Earth energy imbalance time series below shows that IFS-FESOM accurately captures the observed annual mean energy imbalance of approximately 0.5–1.0 W/m² post-2000, significantly outperforming the CMIP6 multi-model mean which exhibits a systematic positive bias of approximately 1.0 W/m² relative to CERES observations. IFS-FESOM successfully reproduces the large-amplitude seasonal cycle in net TOA radiation. A transient negative energy imbalance is evident in the early 1990s, reflecting the radiative response to the Mt. Pinatubo eruption.
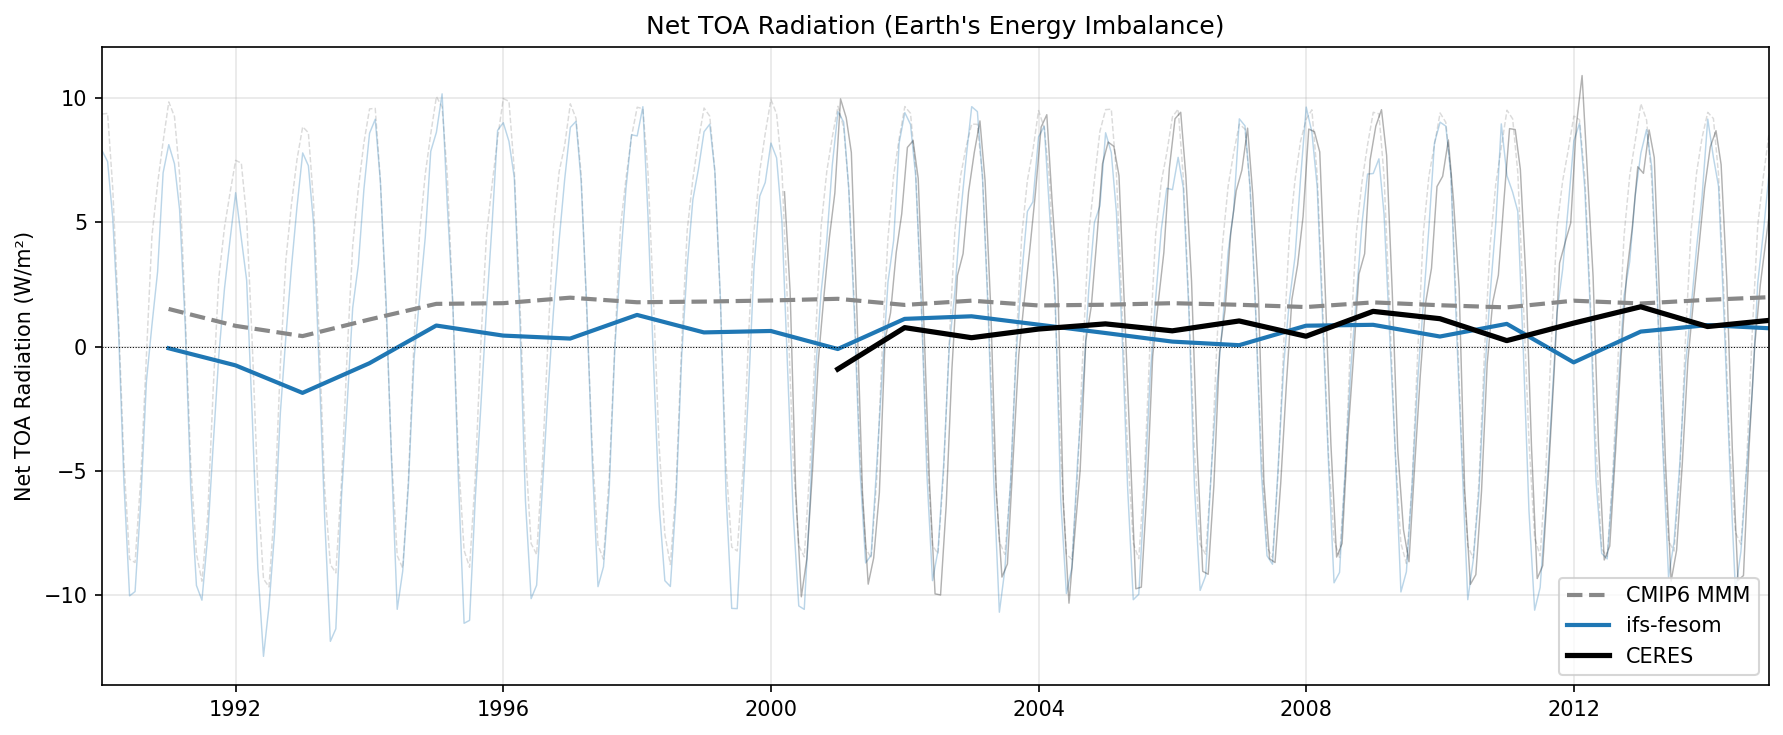
Time series of the global-mean net top-of-atmosphere radiation (Earth’s energy imbalance) from 1990 to 2014, comparing IFS-FESOM with CERES observations and the CMIP6 multi-model mean.
Sea ice extent (below) is significantly overestimated in the Northern Hemisphere but shows a declining trend since the 1990s consistent with observed Arctic sea ice loss. In the Southern Hemisphere, IFS-FESOM exhibits anomalous decadal-scale variability with a pronounced dip and recovery, which may reflect an initialization adjustment of the Southern Ocean rather than a forced climate signal, following a different long-term evolution from observations.
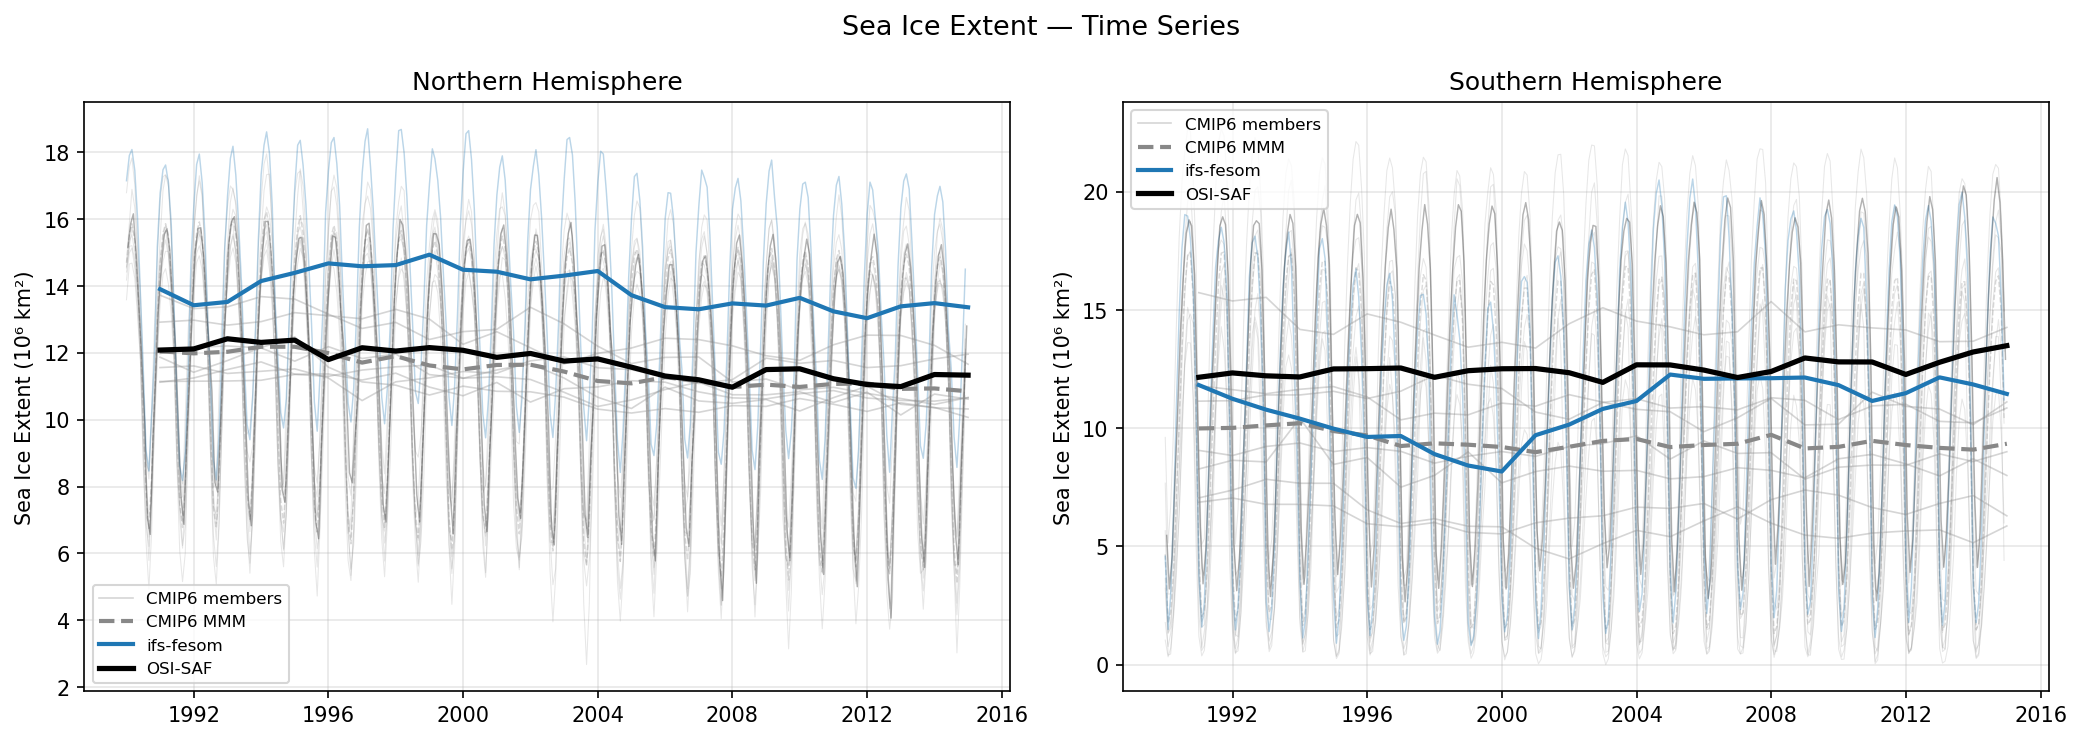
Time series of monthly and annual-mean sea ice extent for the Northern and Southern Hemispheres, comparing IFS-FESOM against OSI-SAF satellite observations and a CMIP6 multi-model ensemble.
Further evaluation
Additional evaluation plots for the IFS-FESOM simulations are available in the Climate DT Evaluation Charts.