Storyline Evaluation
This page provides evaluation of the IFS-FESOM storyline simulations, including mean-state biases and temporal correlation with ERA5. For model and simulation details, see Storyline Simulations. An example of how to work with storyline data is provided in this Polytope Climate DT notebook.
Annual Biases
The annual bias maps below provide an overview of the mean-state performance of the nudged km-scale model. Since the large-scale circulation is constrained by nudging, remaining biases reflect model physics and parameterization errors rather than large-scale dynamical drift. The 2m temperature (panel a) shows a pronounced cold bias over the Arctic (exceeding -4 °C) and a warm bias around Antarctica, both likely related to sea ice representation issues. Most mid-latitude continental and oceanic regions remain within ±1 °C. Sea surface temperature biases (panel b) are generally small, with localized warm biases in the tropical Pacific and Indian Ocean and cold biases in the Southern Ocean. Total precipitation (panel c) reveals the largest biases in the tropics, with a dipole pattern suggesting a slight displacement of the Intertropical Convergence Zone (ITCZ) and excessive precipitation over the Maritime Continent. The 500 hPa geopotential height (panel d) shows a predominantly negative bias across the extratropics, with a positive anomaly near Antarctica consistent with the warm surface bias there.
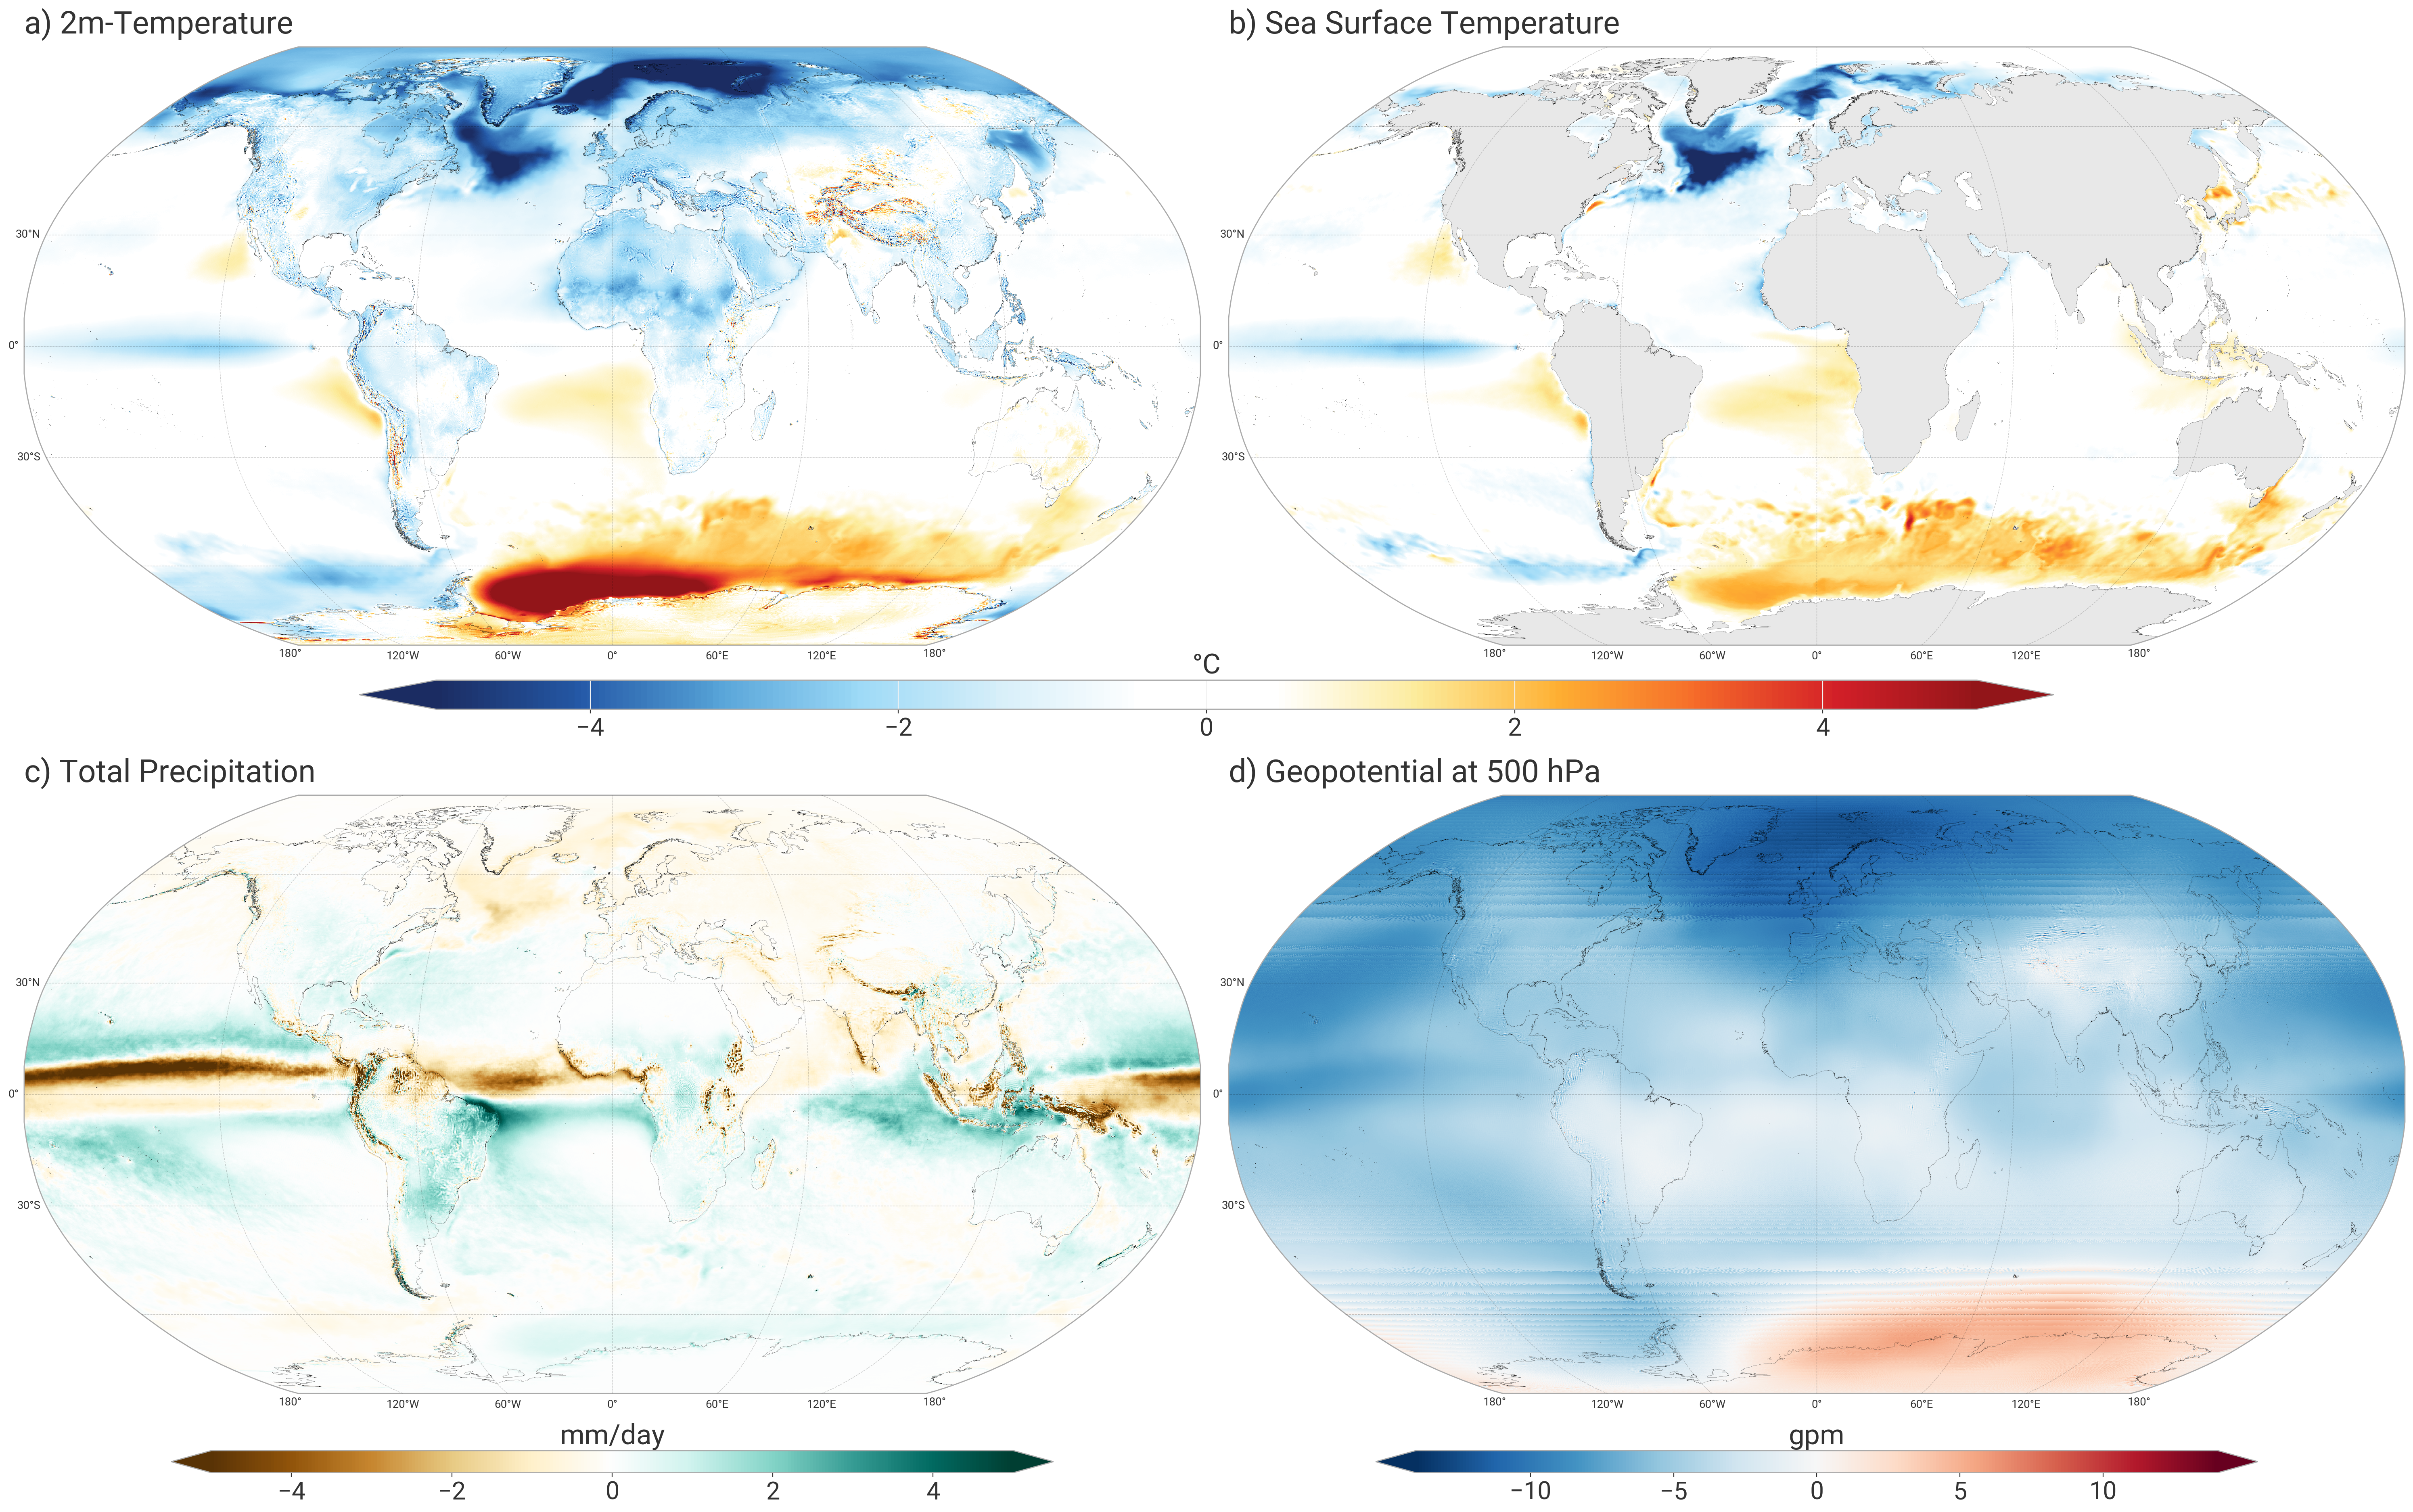
Annual biases of the IFS-FESOM storyline simulations.
Temporal Correlation
The temporal correlation maps below measure the skill of the nudged model in replaying observed weather events. Higher temporal correlations indicate that the model faithfully reproduces the timing and sequencing of synoptic-scale weather patterns, a prerequisite for meaningful event attribution. The 500 hPa geopotential height shows uniformly high correlations (>0.9) across all latitudes, as expected since this is the field constrained by nudging. For 2m temperature, correlations are high (>0.8) over most extratropical land areas, where surface temperature variability is strongly controlled by the large-scale circulation, but drop notably in the tropics and over tropical oceans where local processes such as convection and air–sea interaction play a larger role. Precipitation correlations show a similar latitude dependence, with reasonable skill in the extratropics and weaker correlations in the tropics, where precipitation is more strongly influenced by local convective processes.
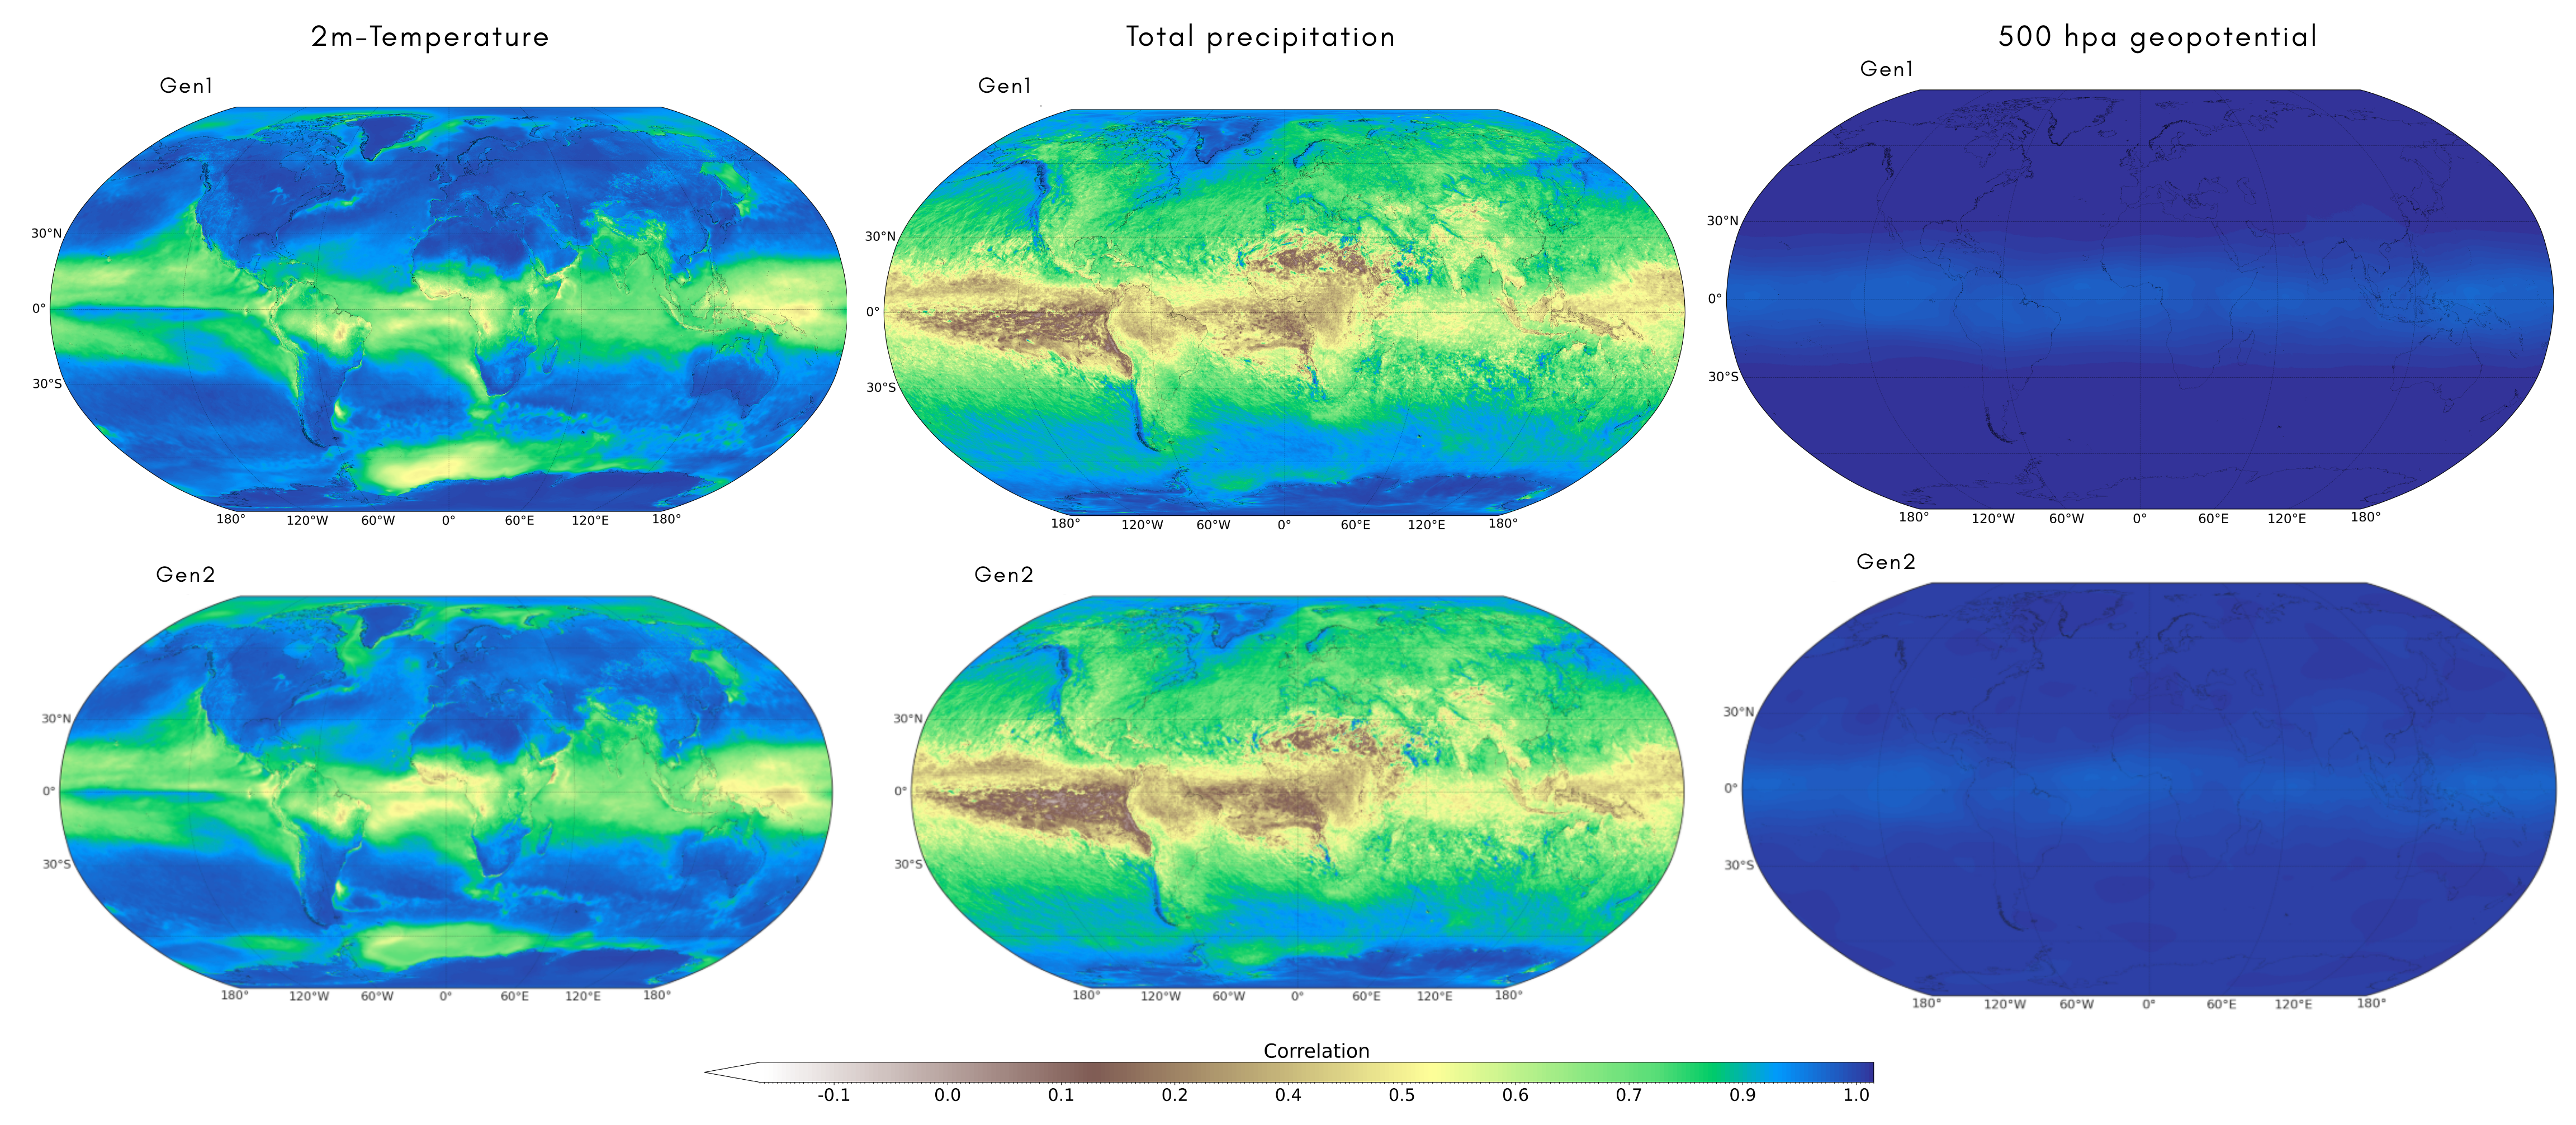
Temporal correlation between daily ERA5 reanalysis data and the IFS-FESOM storyline simulations under present-day conditions, calculated after removing the seasonal cycle, for (a) 2m temperature, (b) precipitation, and (c) 500 hPa geopotential height.