IFS-NEMO Evaluation
This page provides evaluation of the IFS-NEMO historical and projection simulations. For model description and forcing details, see Historical and Projection Simulations.
Assessment of the Historical Simulation
A comprehensive evaluation of the main model biases is provided by the Performance Index table below, covering a large selection of variables and regions. Performance is evaluated against the mean of the CMIP6 models, with values below 1 (blueish) indicating superior performance and values above 1 (reddish) inferior performance. For most variables and regions IFS-NEMO shows exceptional performance, with values typically below 0.2. The variables with poorer (still good) performance index values relate to net surface radiation, surface temperature and sea ice concentration (which shows the worst performance overall), with dynamical atmospheric variables showing exceptional performance.
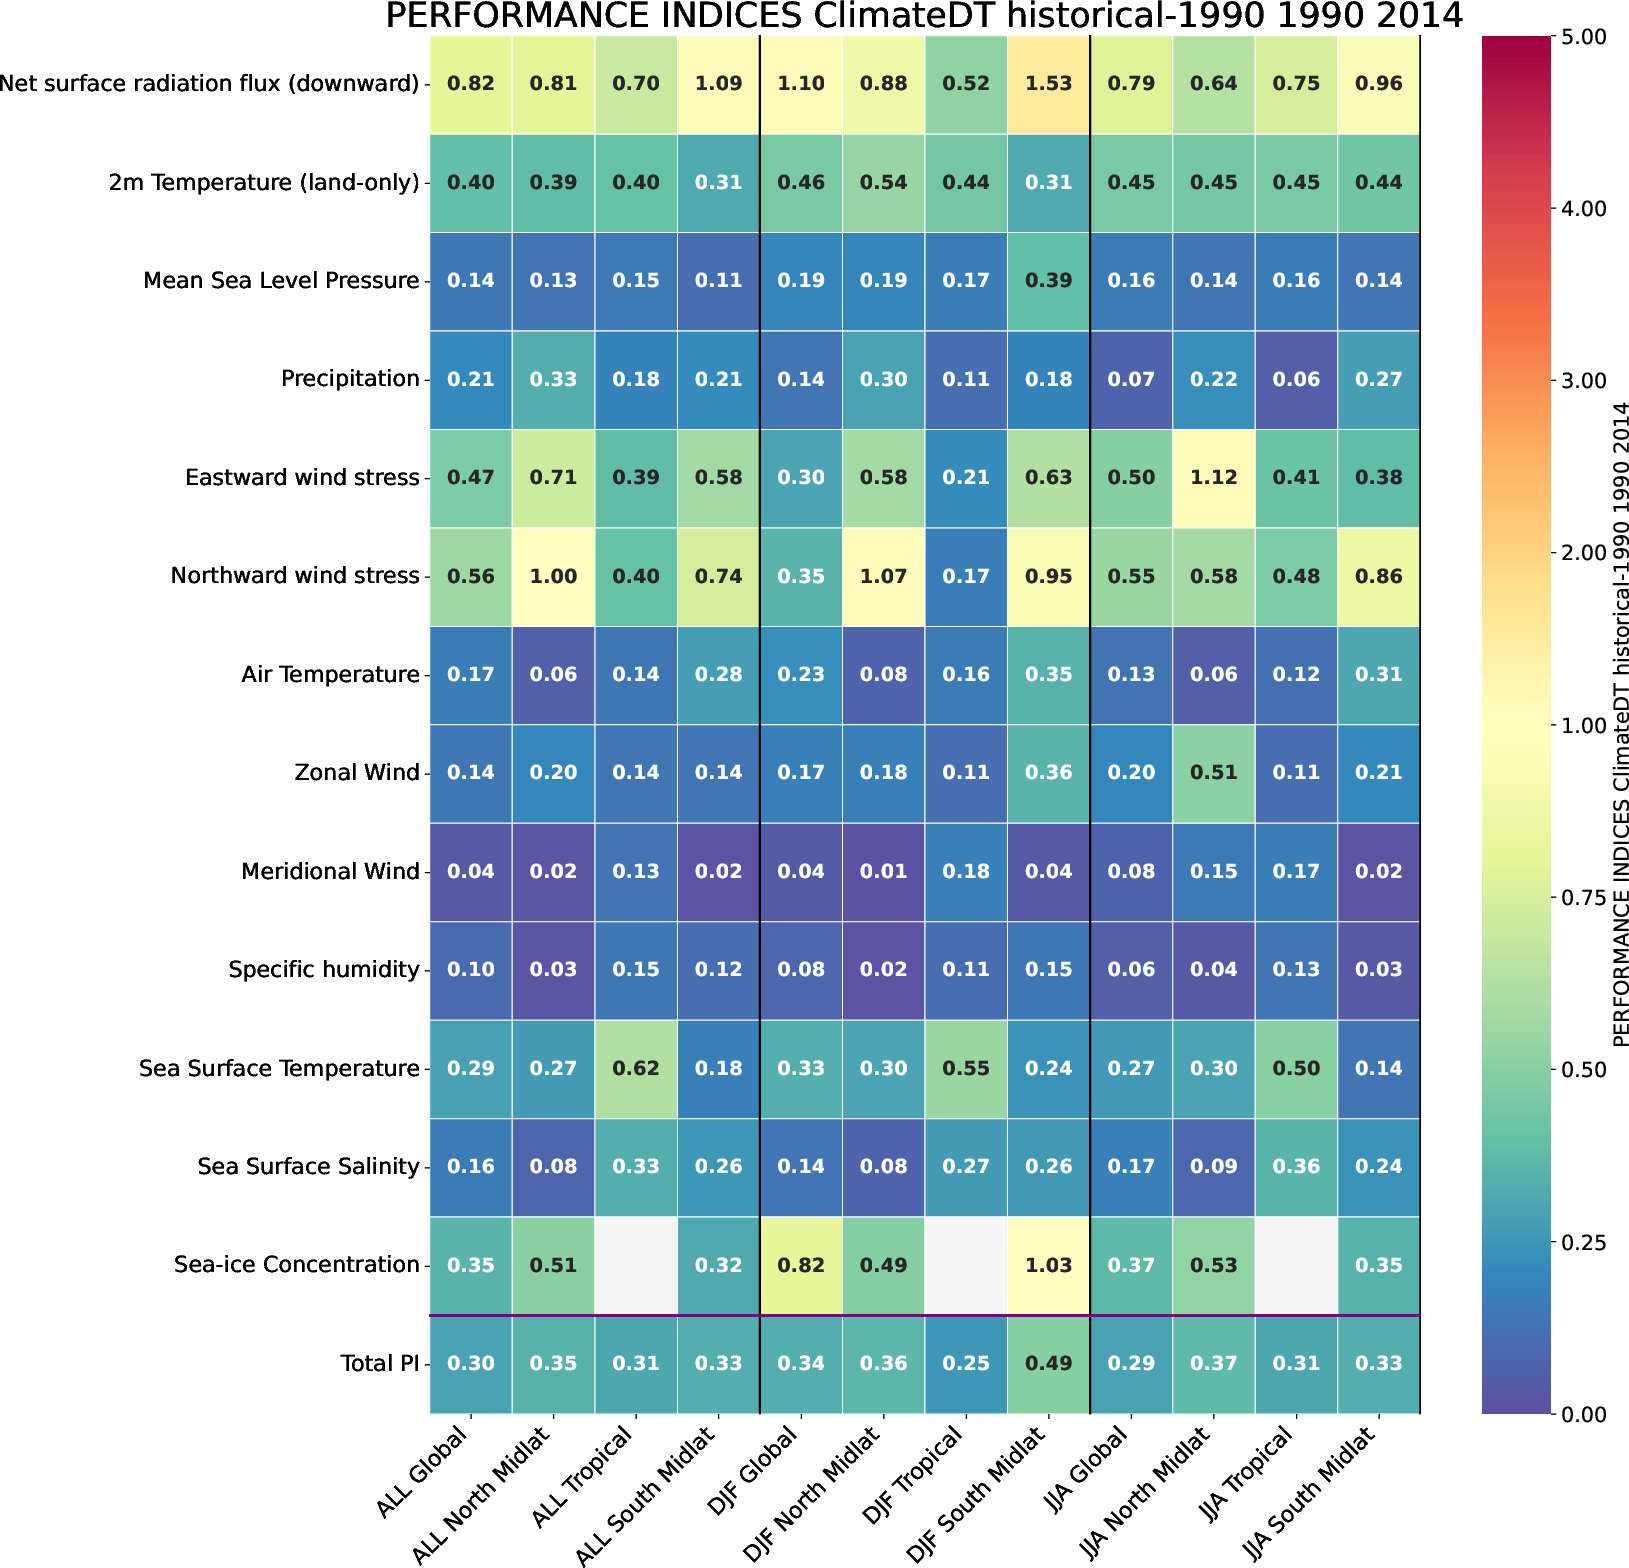
Performance Index table for the historical simulation. Performance values refer to the mean of CMIP6 models, with values below 1 indicating improved performance and values above 1 degraded performance.
Global mean temperatures (left panel of the figure below) over the historical period show a slightly weaker long-term trend than observations, which might be explained by the surface cooling drift already seen in the Control Simulation. It also shows a small mean-state cold bias of ~0.25°C. The future projection depicts an acceleration of the historical warming trend by about 75%. Simulated values in the top of the atmosphere net radiation (middle panel) are within the range of observed values, although they seem to exhibit a substantially weaker trend. Part of these differences might be explained by internal variability, given the comparatively shorter observational period, and the larger year-to-year variations in IFS-NEMO, which introduce uncertainty in the computed trends. The Gregory plot (right panel) shows that the simulation stays largely within the observed ranges, with a potential overestimation of the response to Pinatubo in the years following the eruption (i.e. 1991).
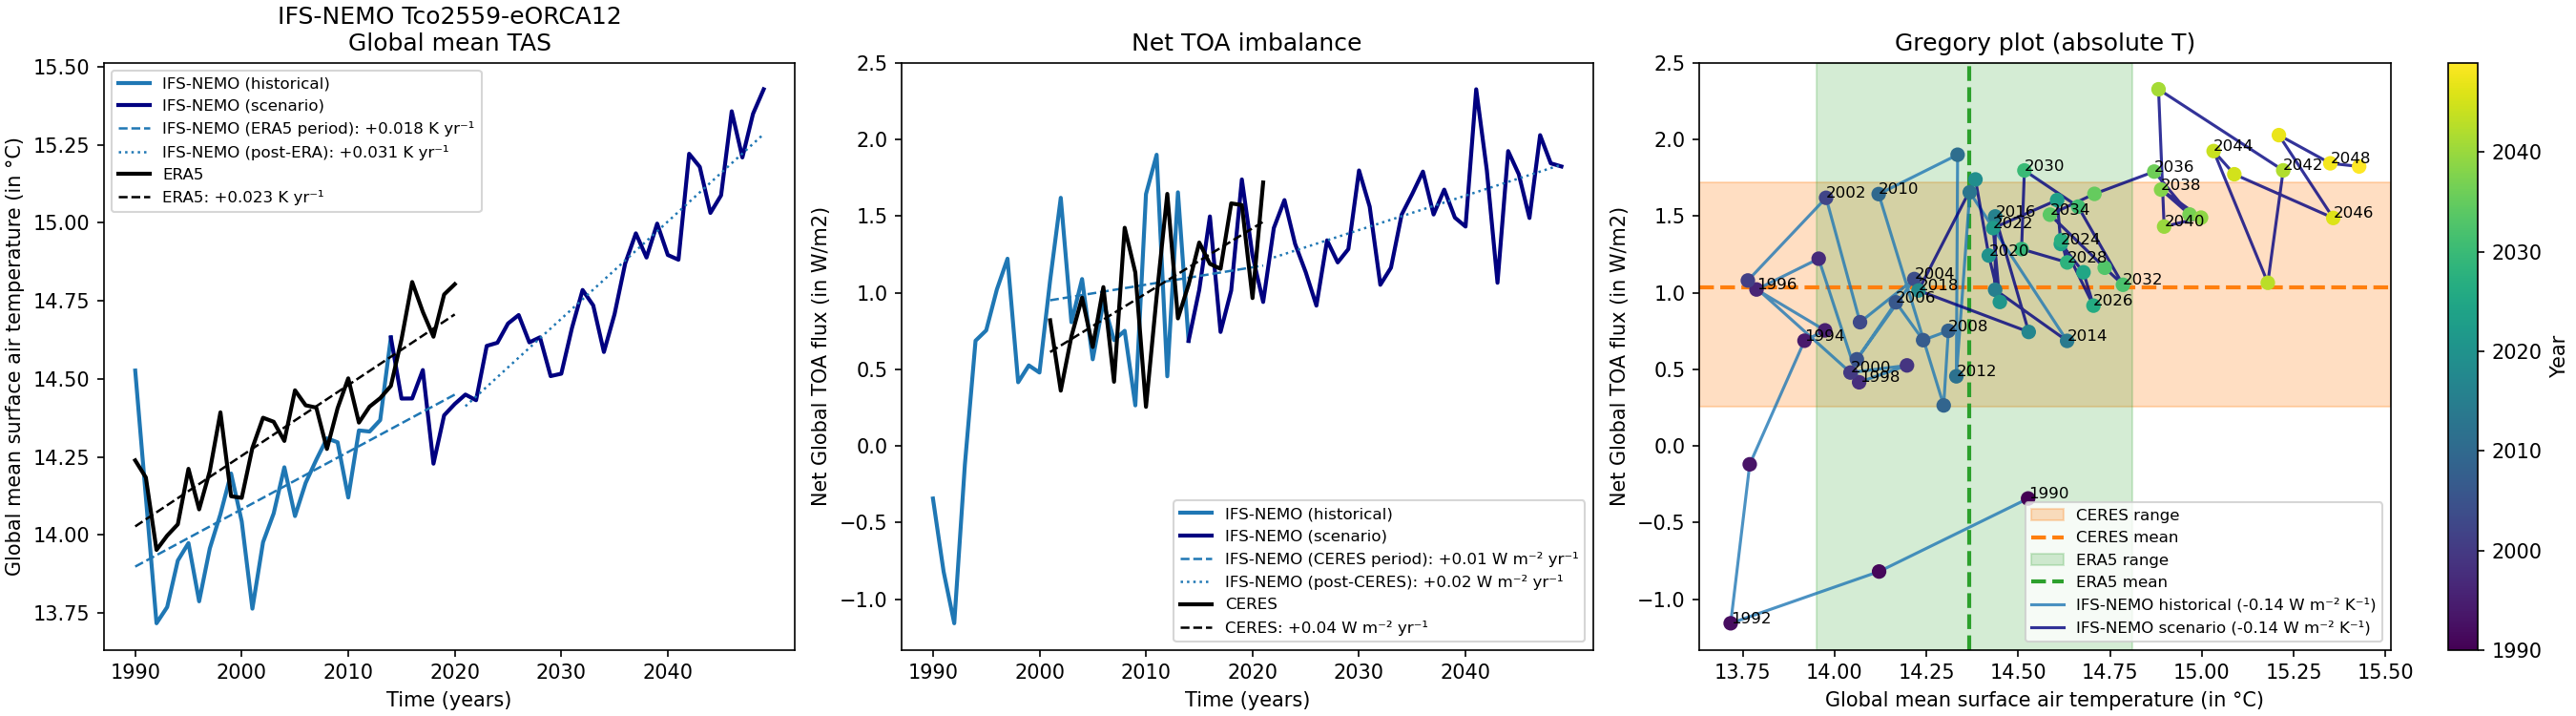
Left: Time series of the globally averaged annual surface air temperature in ERA5 and the historical and scenario IFS-NEMO simulations. Fit-lines representing the trends over the overlap period between ERA5 and the simulations are also included. Middle: Same figure but for the timeseries of the net heat fluxes at the top of the atmosphere (TOA), including observations from CERES. Right: Gregory plot of the combined IFS-NEMO simulations. The mean values and ranges of the observed TOA fluxes and global mean surface air temperatures are included for reference.
Spatial maps of mean-state biases in annual surface air temperature (below) show relatively small errors with respect to ERA5 over the three major ocean basins and most continental areas (global mean bias -0.10 K, RMSE 0.96 K). The global cold bias mostly arises from the Arctic region and Southern Ocean, likely linked to errors in sea ice representation. IFS-NEMO successfully mitigates the warm biases typical of eastern boundary coastal upwelling regions (e.g., Humboldt and Benguela currents) that commonly afflict coarser CMIP6 models. Over the continents, IFS-NEMO tends to be warmer than ERA5, like most CMIP6 models. Some local differences, evident in the main mountainous regions, might be due to the finer representation of orography in the model.
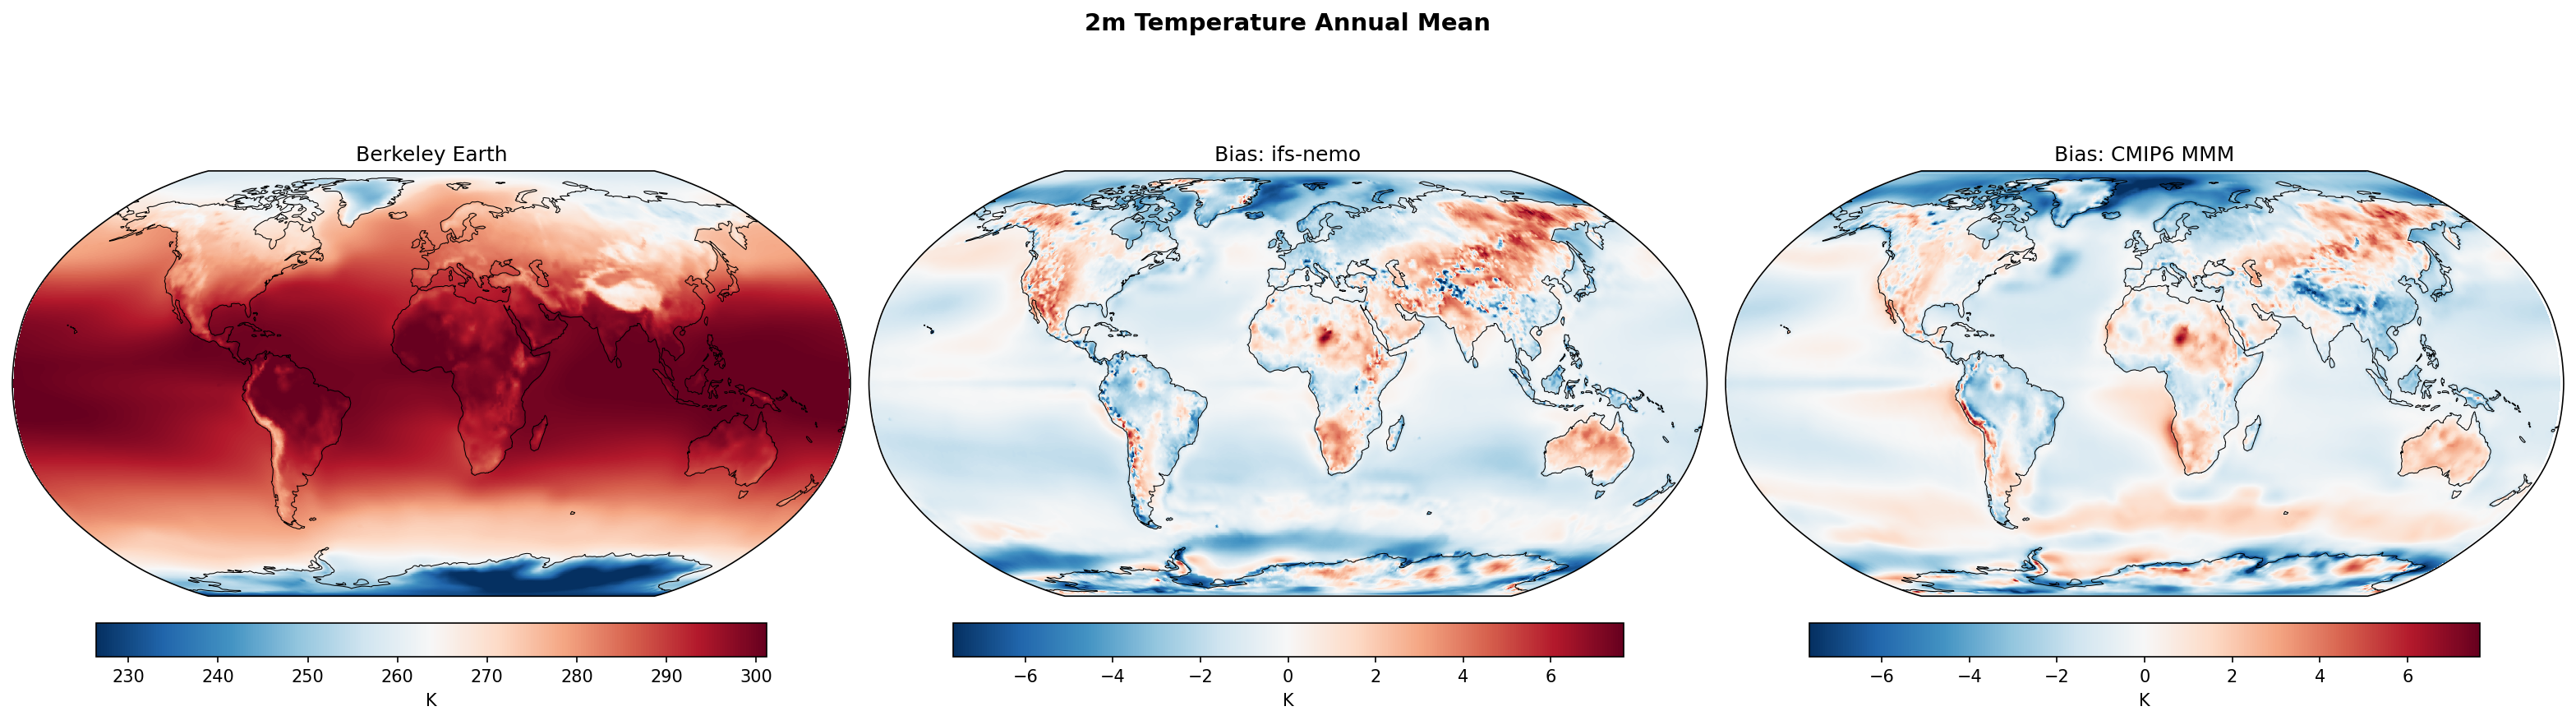
Spatial maps of the climatological biases of annual surface air temperature in the historical IFS-NEMO simulation and the CMIP6 multi-model mean. Biases are computed against Berkeley Earth climatology over the period 1990–2014.
In terms of mean sea level pressure (below), IFS-NEMO performs well (global mean bias 0.08 Pa, RMSE 88.91 Pa), comparable to the CMIP6 multi-model mean (RMSE ~87 Pa). The polar regions show positive biases, characteristic of cold high-latitude mean states that are dynamically consistent with excessive surface cooling and sea ice, highlighting the strongly coupled nature of tropical and polar mean-state errors.
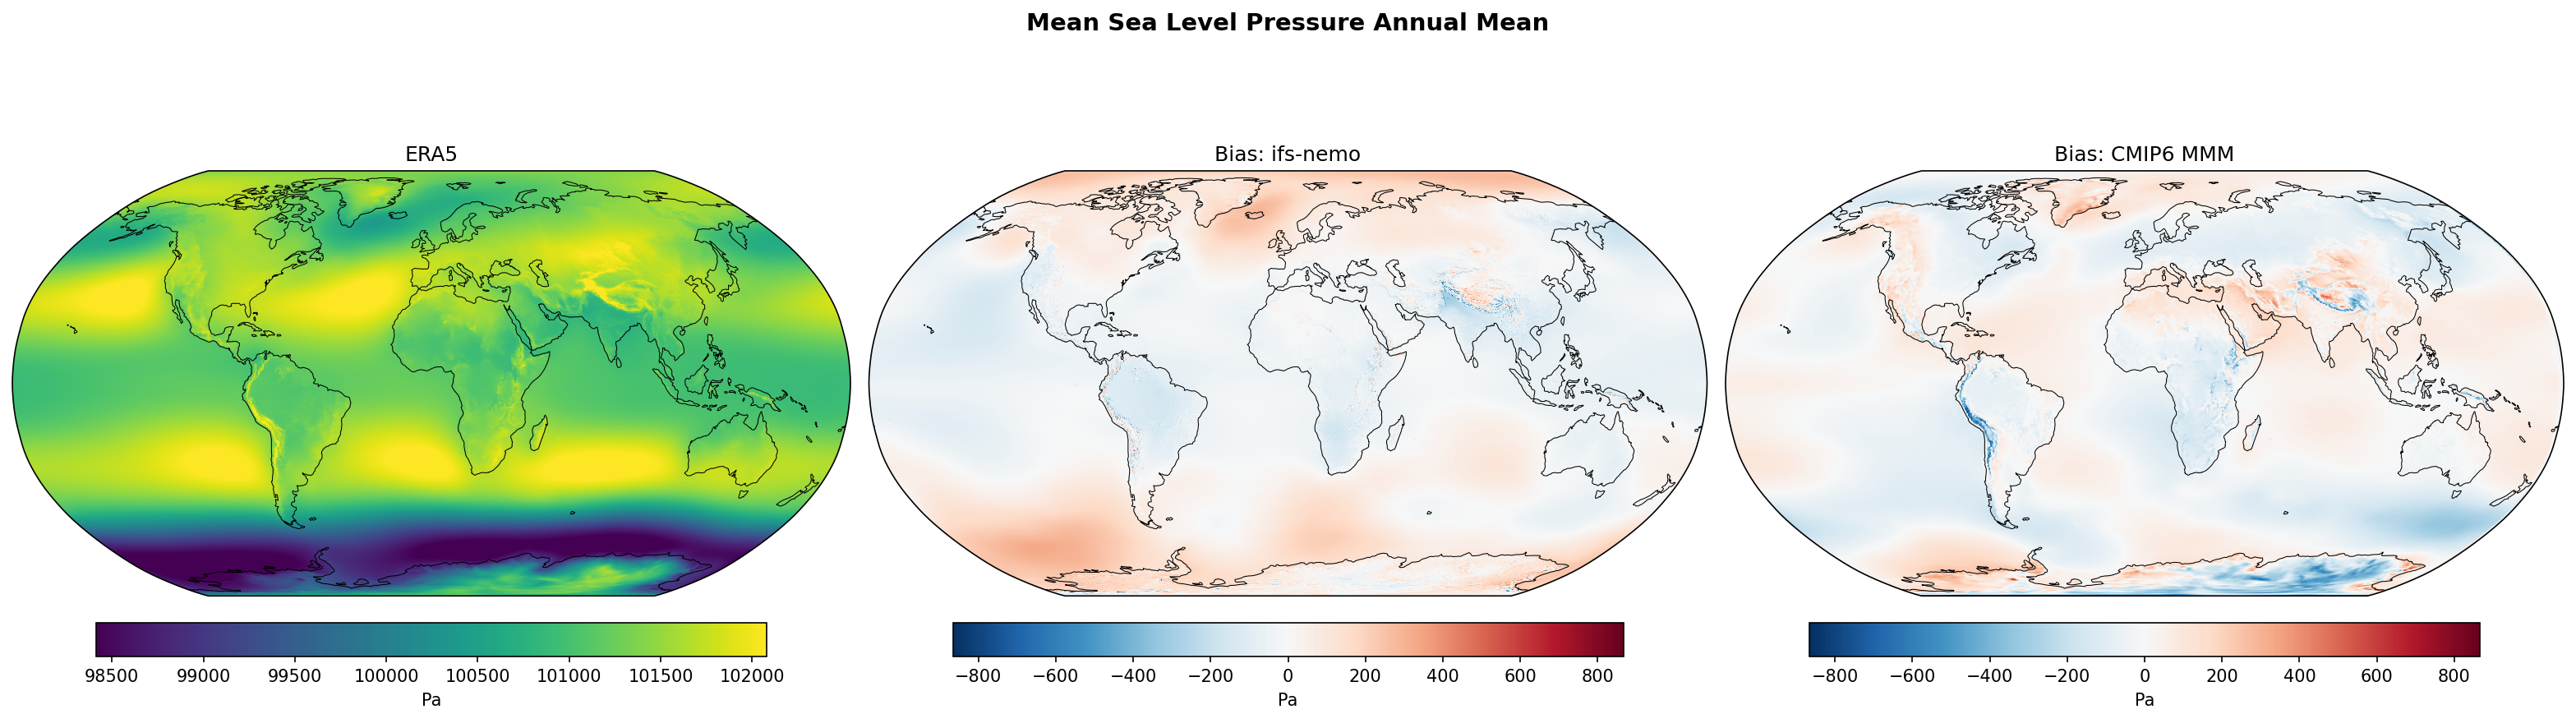
Spatial maps of the climatological biases of annual mean sea level pressure in the historical IFS-NEMO simulation and the CMIP6 multi-model mean. Biases are computed against ERA5 climatology over the period 1990–2014.
IFS-NEMO also shows good performance in terms of the climatological annual precipitation rate (below), sharing the broad spatial structure of the CMIP6 Multi-Model Mean, with wet biases along the mid-latitude storm tracks and a pronounced dipole pattern in the tropical Pacific indicative of a double-ITCZ or ITCZ displacement error.
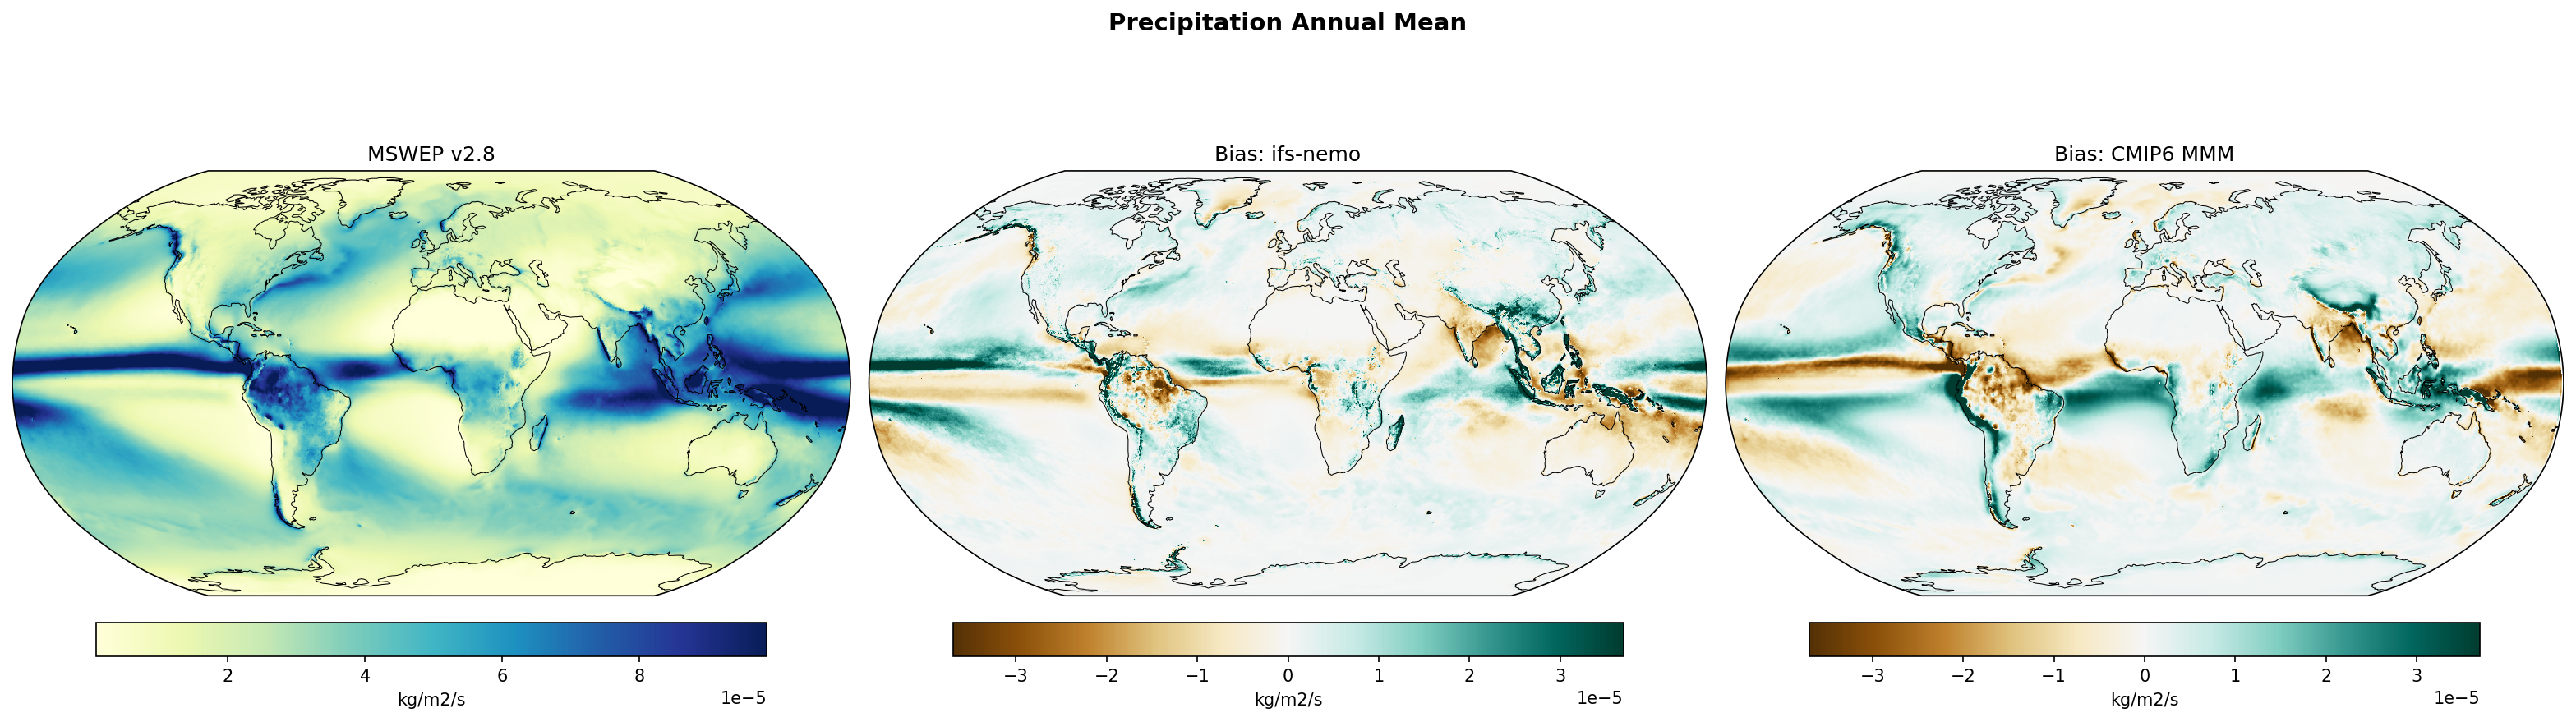
Spatial maps of the climatological biases of annual precipitation in the historical IFS-NEMO simulation and the CMIP6 multi-model mean. Biases are computed against MSWEP climatology over the period 1990–2014.
The Earth energy imbalance time series below shows that IFS-NEMO accurately captures the observed annual mean energy imbalance of approximately 0.5–1.0 W/m² post-2000, significantly outperforming the CMIP6 multi-model mean which exhibits a systematic positive bias of approximately 1.0 W/m² relative to CERES observations.
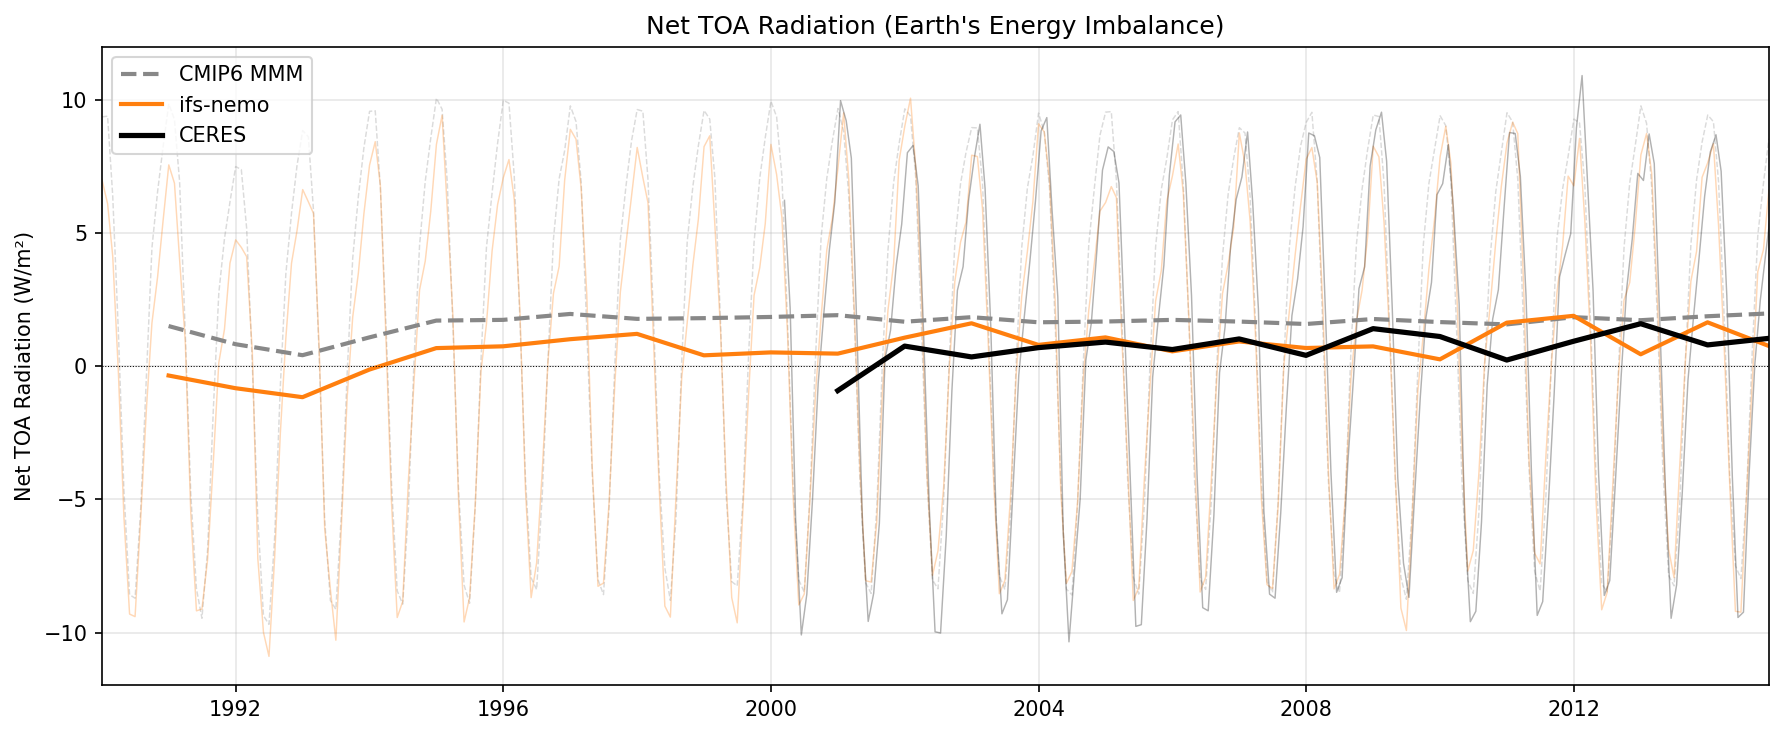
Time series of the global-mean net top-of-atmosphere radiation (Earth’s energy imbalance) from 1990 to 2014, comparing IFS-NEMO with CERES observations and the CMIP6 multi-model mean.
While the sea ice extent (below) is slightly overestimated in the Northern Hemisphere compared to OSI-SAF observations, it shows a declining trend since the 1990s that is largely consistent with the observed one. In the Southern Hemisphere both IFS-NEMO and OSI-SAF show an increasing trend, although with some different features. IFS-NEMO starts close to OSI-SAF but develops positive bias in the late 1990s, which might reflect some initialization adjustment. CMIP6 models show a large inter-model spread, with the ensemble mean showing a slight sea ice decline, that opposes the observed one.
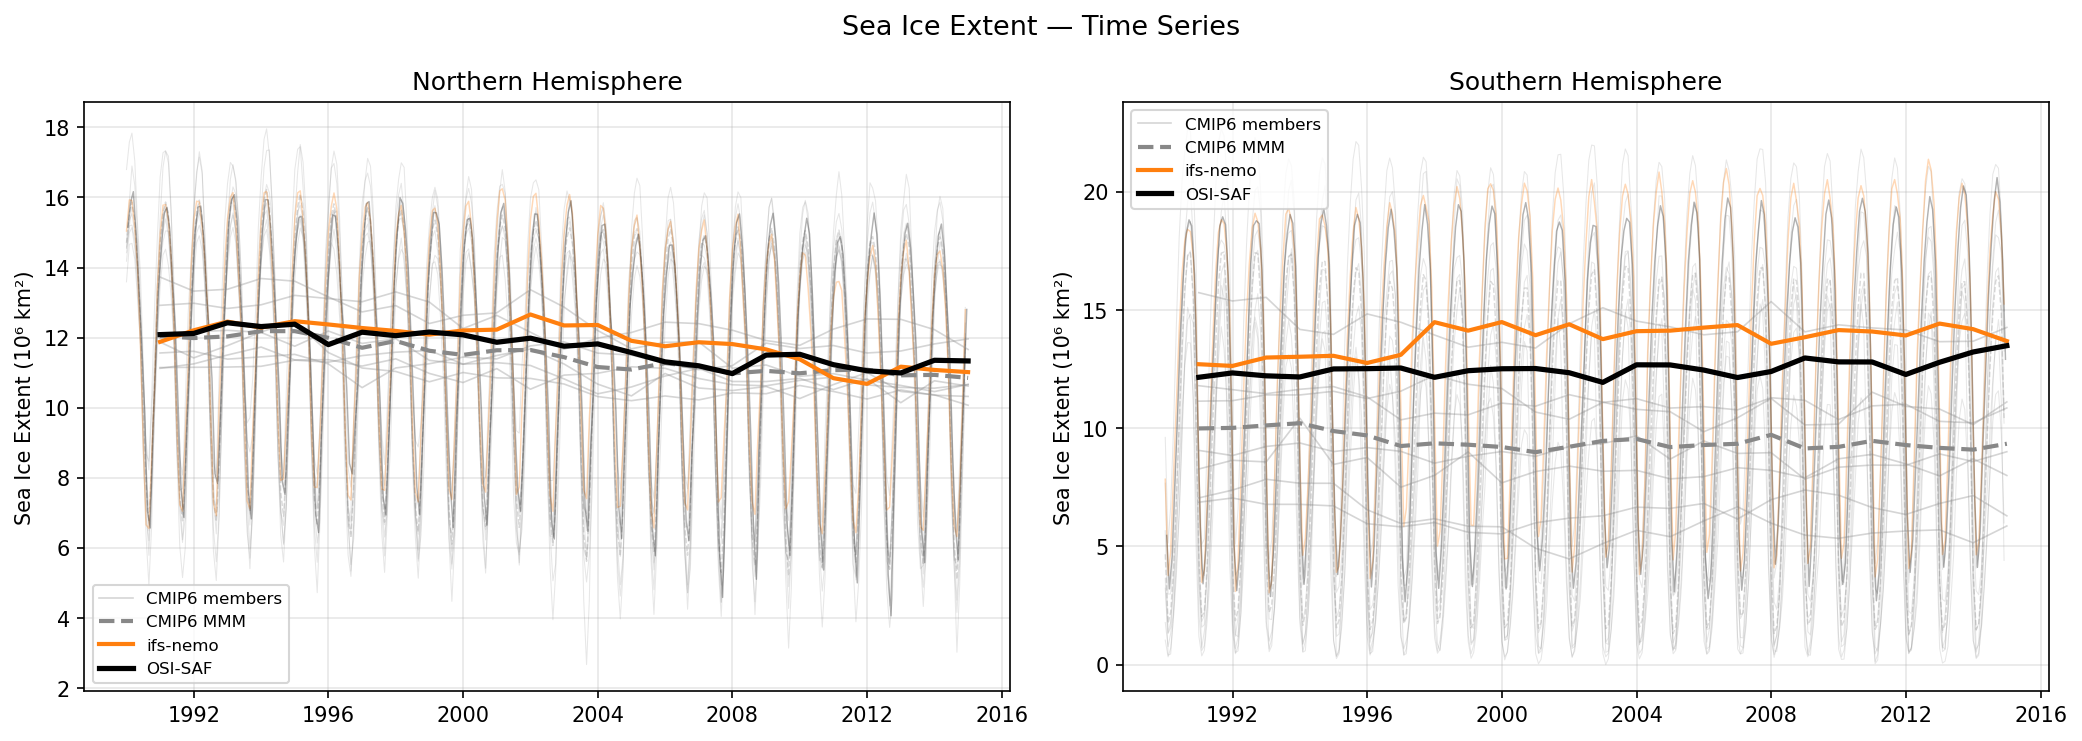
Time series of monthly and annual-mean sea ice extent for the Northern and Southern Hemispheres, comparing IFS-NEMO against OSI-SAF satellite observations and a CMIP6 multi-model ensemble.
Further evaluation
Additional evaluation plots for the IFS-NEMO simulations are available in the Climate DT Evaluation Charts.