Multi-model Evaluation
This page provides a first multi-model comparison of the three Climate DT model systems (ICON, IFS-FESOM, IFS-NEMO) against reanalysis and observational data, as well as simulations from the CMIP6 ensemble. The page will continuously be expanded with more variables and diagnostics as the evaluation of the models progresses.
For other comparisons of the Climate DT models against observations and reanalysis, see the individual model evaluation pages. Regional case studies comparing variables such as precipitation across models are available on the Showcasing the Climate DT in Action page.
Note
To start your own multi-model analyses, please refer to the Polytope Climate DT example notebooks, and to the general data access page.
Global-mean Surface Air Temperature (GSAT)
The Climate DT model simulations apply the CMIP6 SSP3-7.0 forcing scenario from 2015 onwards. Historical forcings have been used until 2014. The time-evolution of global-mean surface air temperature (GSAT) is shown in the figure below.
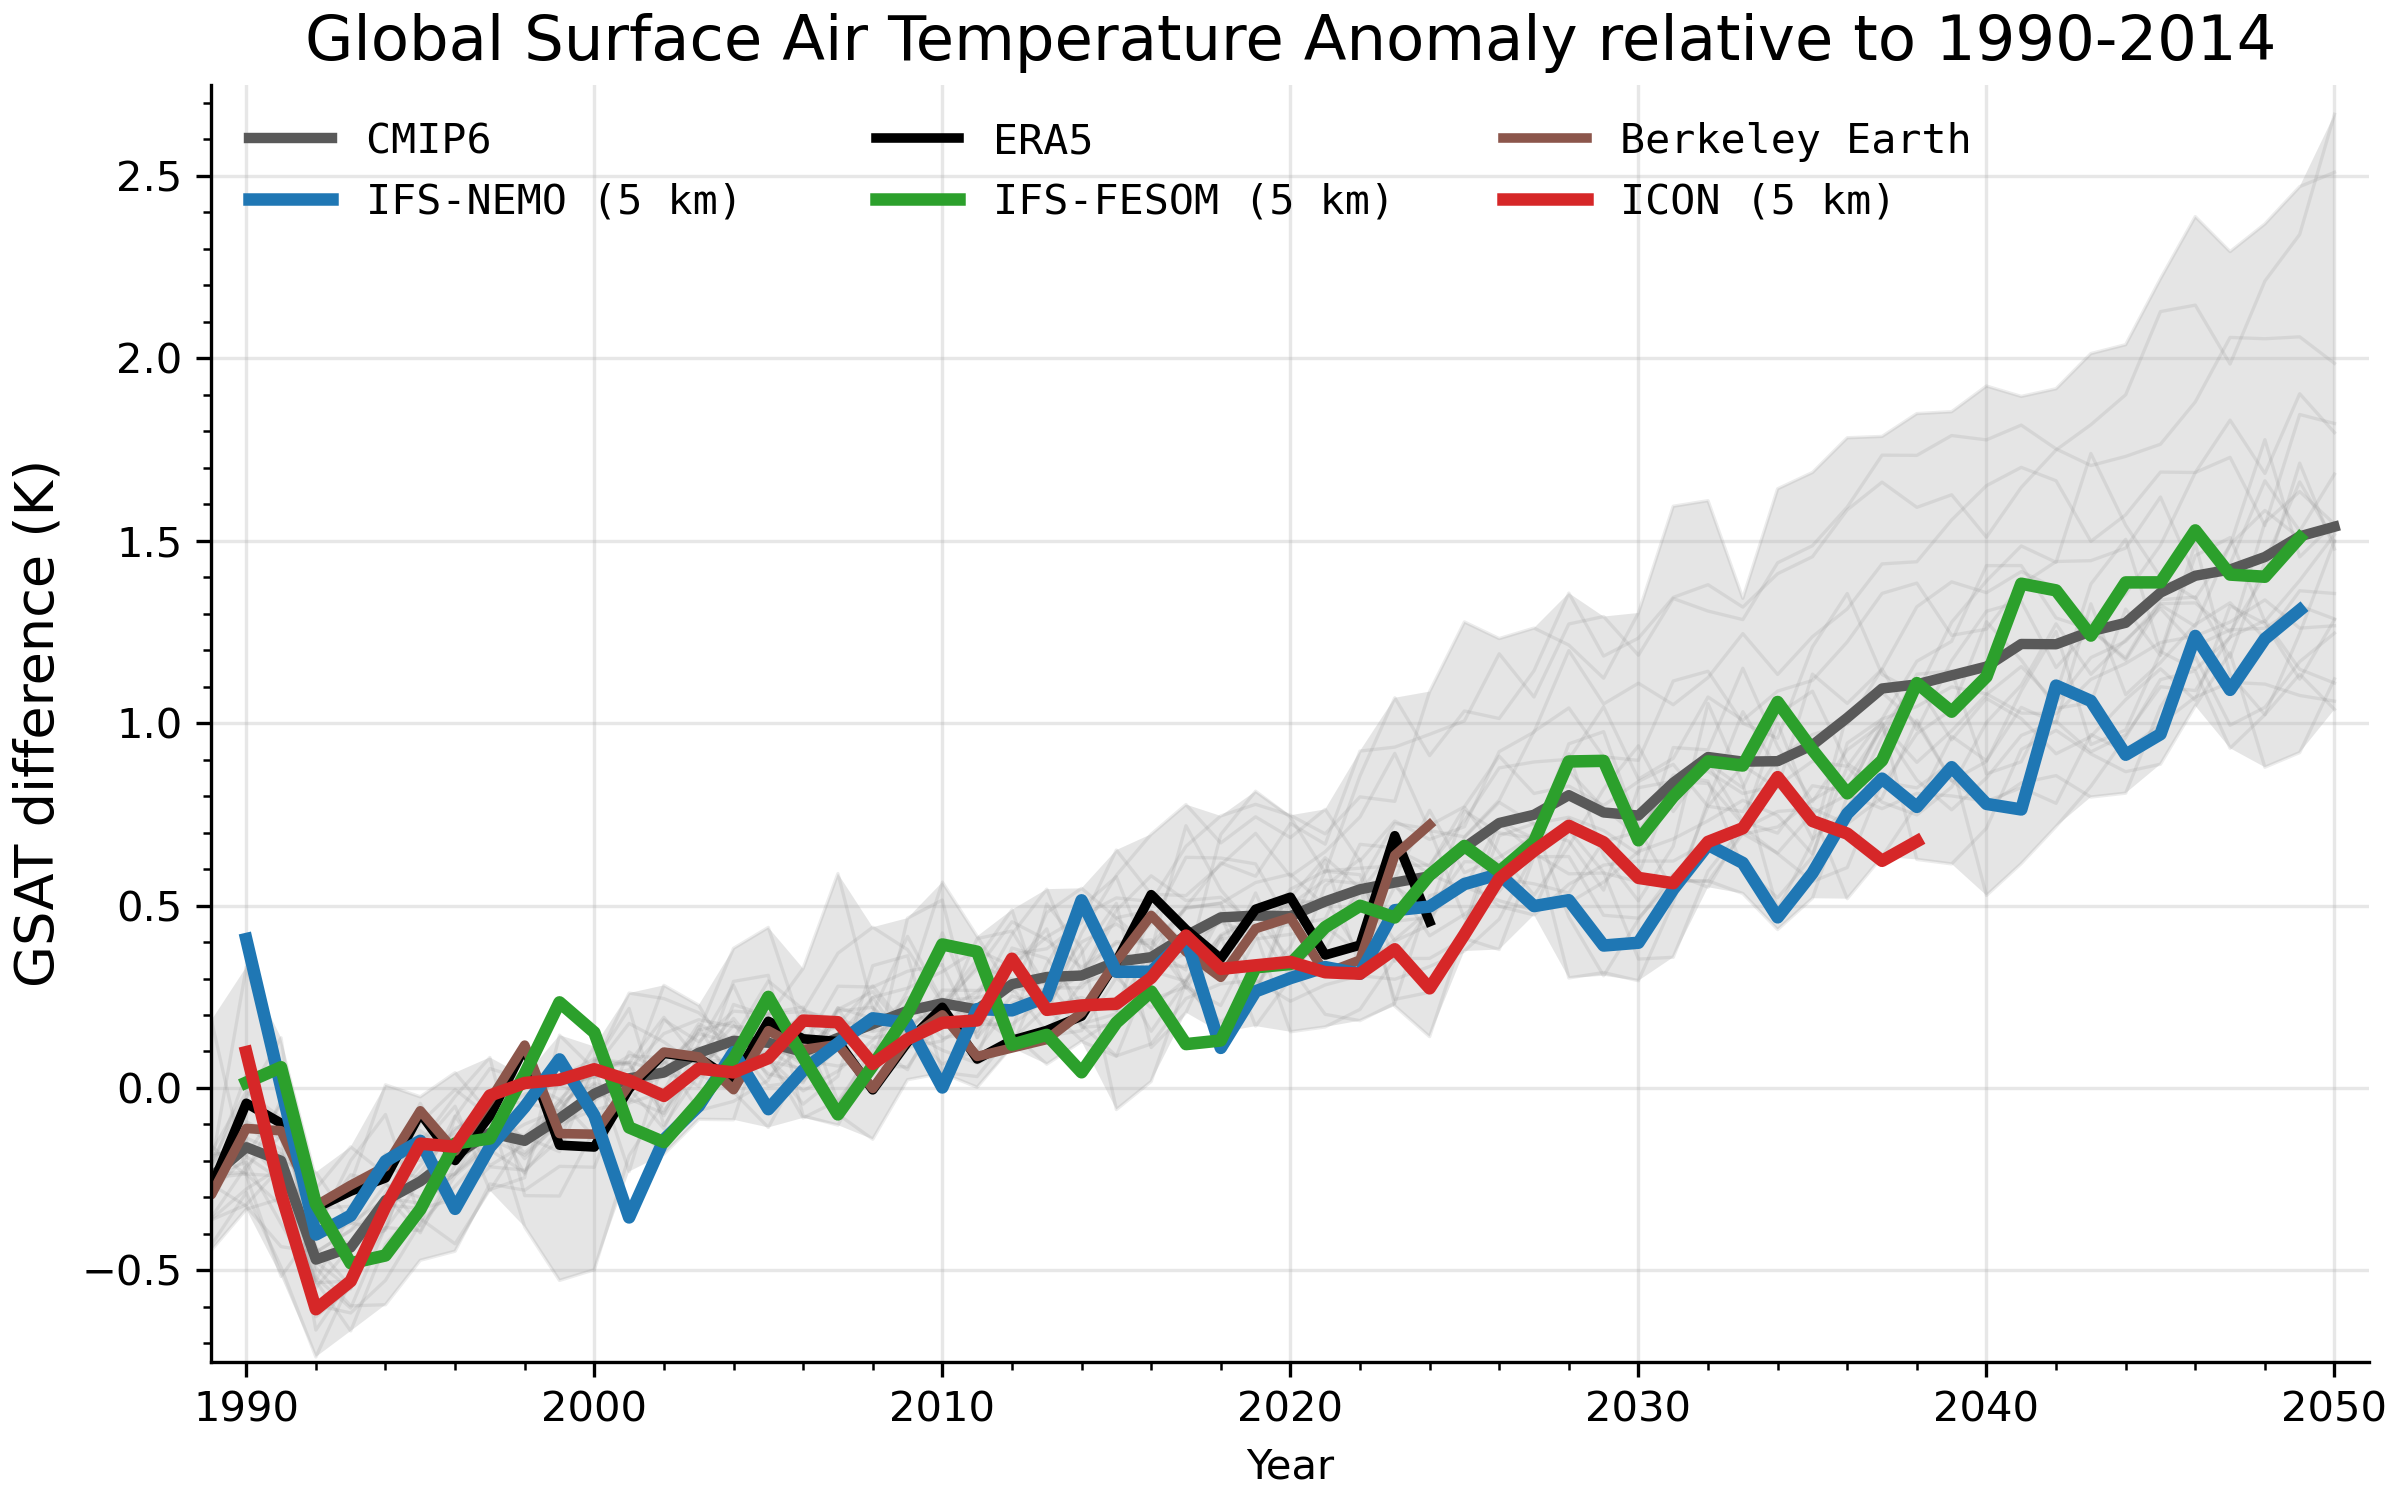
Global-mean Surface Air Temperature (GSAT) for the Climate DT models, the Berkeley Earth observational dataset, ERA5 reanalysis, and for the CMIP6 ensemble. Anomalies are computed relative to the 1990-2014 period. The CMIP6 multi-model ensemble mean is displayed in dark grey.
The models capture the observed warming trend over the historical period and their future warming trend lies within the CMIP6 distribution of trends. While the IFS-FESOM realisation of GSAT evolution follows the CMIP6 multi-model mean warming rate closely, both IFS-NEMO and ICON show a warming rate at the lower end of the CMIP6 ensemble.
Top-of-Atmosphere Radiation Balance
The top-of-atmosphere (TOA) radiation balance is a key constraint on the climate system’s warming rate and is directly linked to the evolution of GSAT. Satellite observations from CERES indicate a TOA imbalance of around 1 W m-2, while many CMIP6 models tend to exceed this value (figure below). During the development of the Climate DT models, particular care has been taken to ensure that the TOA energy balance (not only the net flux, but also its shortwave and longwave components) remains within observational constraints.
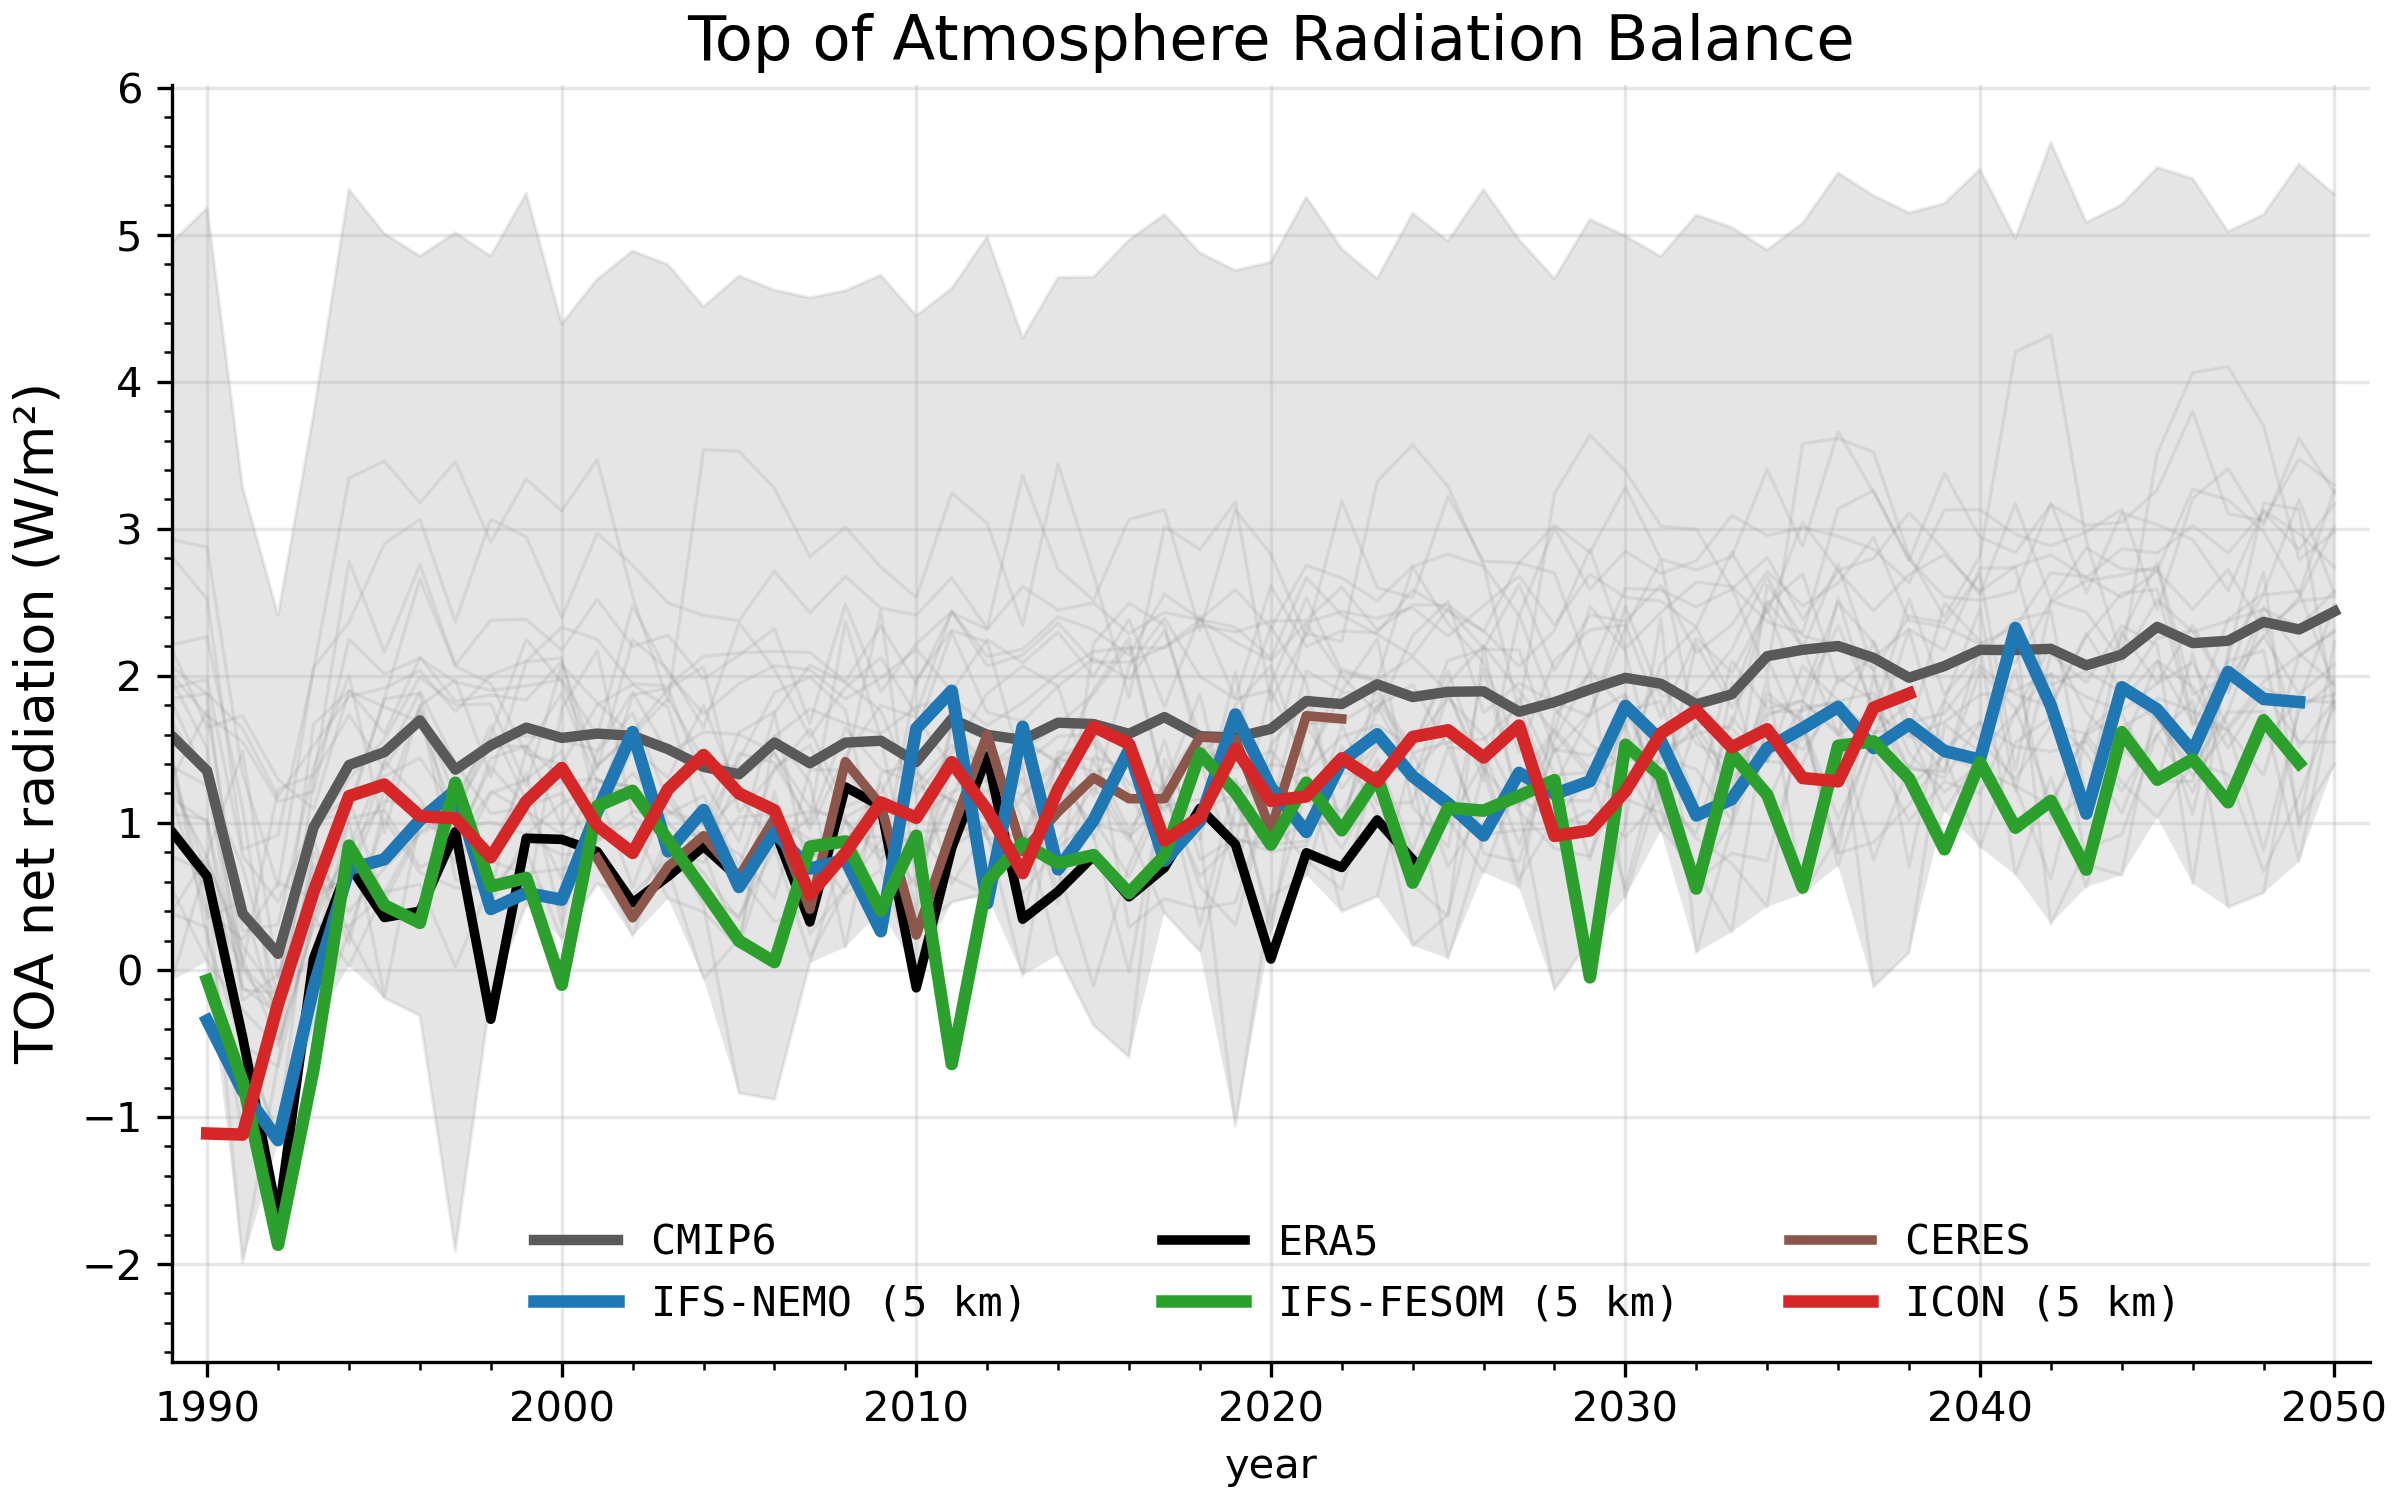
Time series of annual mean TOA radiation balance for the three models and ERA5, and the CMIP6 model ensemble.
The resulting simulated radiative balance explains the realistic GSAT trends shown above, while differences in the rate of GSAT increase are related to differences in how quickly the ocean models distribute the heat vertically and horizontally in their domain, and how the coupled model systems represent ocean-atmosphere feedbacks and reach their surface equilibrium. The different patterns of global warming are shown in the figure below.
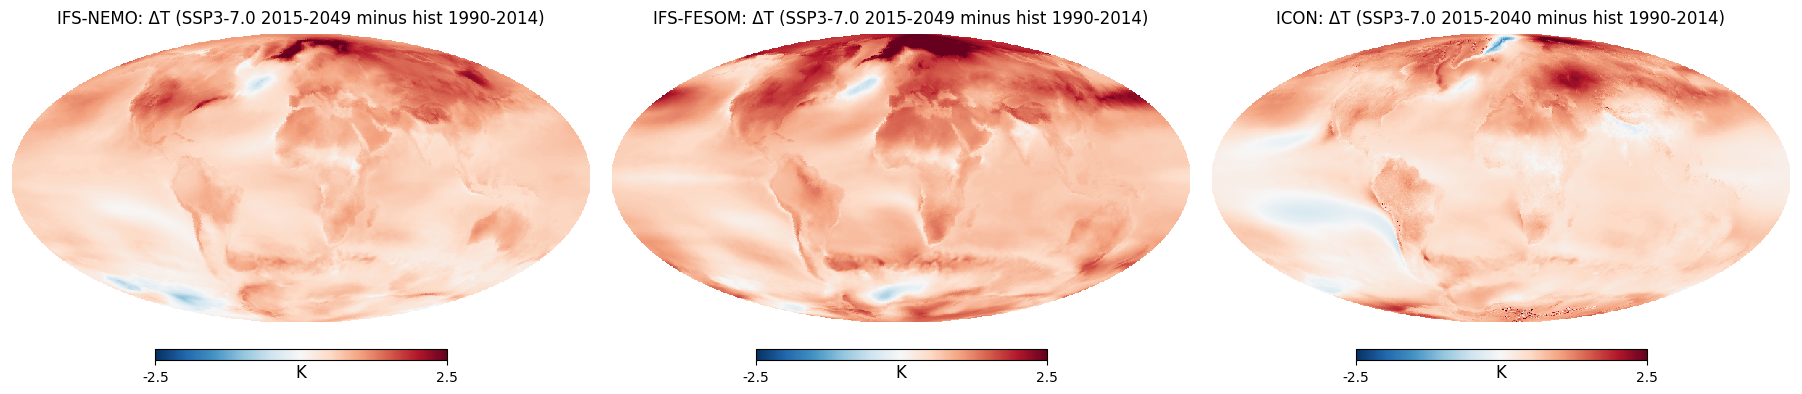
The global pattern of surface air temperature changes between the historical period (1990-2014) and the future SSP3-7.0 scenario (2015-2049) for the three Climate DT models. Note that at release, the period 2015-2040 is used for the ICON model, and will subsequently be updated to match the full SSP3-7.0 scenario period. Image can be re-created with this Polytope Climate DT notebook example.
Additional evaluation plots for the Climate DT models are available in the Climate DT Evaluation Charts.