Technical Documentation
This page describes the technical workflow used to produce the Energy Indicators, including data extraction, processing, application execution, and HPC integration.
Integration in the workflow
The Energy Indicators application is integrated into the Climate DT workflow through a data processing pipeline, which is visually summarised in the figure below. This pipeline extracts climate data and computes energy-specific metrics in streaming mode, while the climate simulation is running.
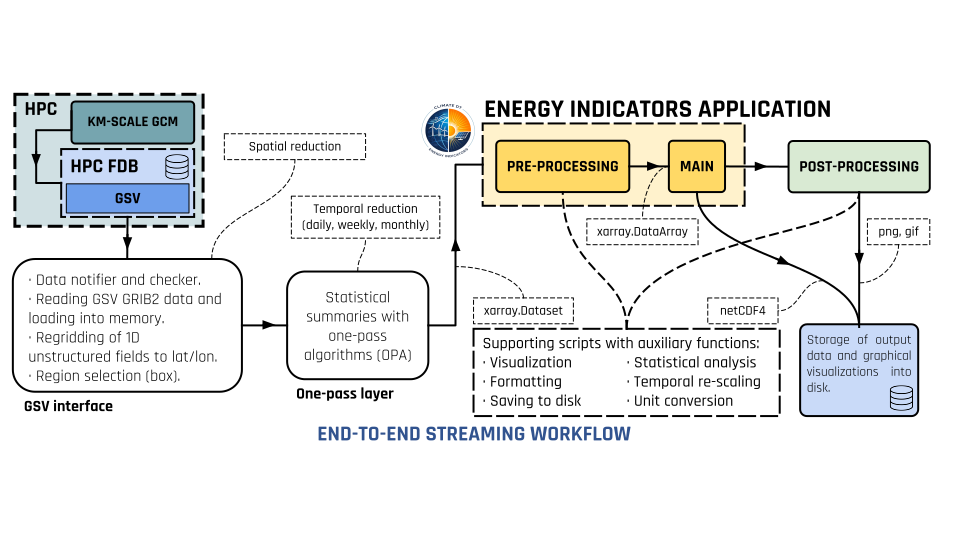
Figure 1: Conceptual scheme of the Energy Indicators application integration into the Climate DT workflow.
Data extraction and processing
In the Climate DT workflow, the climate models output km-scale high-frequency fields, such as hourly fields, which are temporarily stored in GRIB format in a Fields DataBase (FDB). In this process, the native model data is homogenised into a generic state vector (GSV), with a common HEALPix grid and unified metadata.
Before reaching the application, the climate data are retrieved from the GSV through the GSV interface, which supports spatial reduction, regridding onto a regular latitude/longitude grid, and conversion to NetCDF format.
The extracted and processed data serve as input to the application, which generates outputs tailored for renewable energy assessments. For a comprehensive description of all available indicators and their definitions, refer to the Data Description section.
One-pass layer
The workflow then processes the data retrieved from the GSV through the One_Pass layer (Grayson et al., 2025) [], a Python package designed for memory-efficient computation of statistical summaries directly from streamed climate simulation data. It performs temporal reduction, derives statistical summaries, and extracts several climate variables:
Wind components (100u, 100v) at 100 m height for wind resource assessments.
Surface downwelling shortwave solar radiation (sdswrf)
Wind components (10u, 10v) at 10 m height for PV potential calculation.
2 m air temperature (2t) for demand-related metrics and PV potential calculation.
Wind speed statistics.
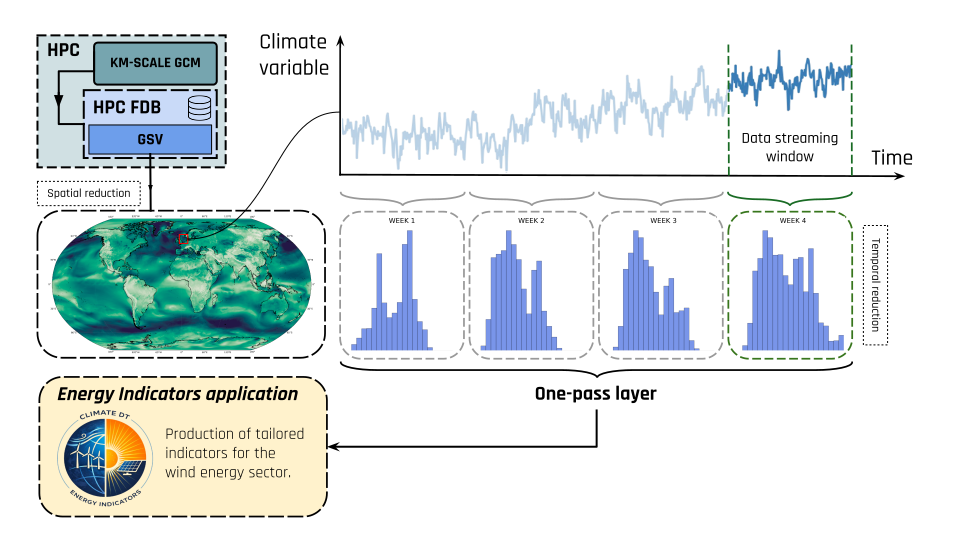
Figure 2: Conceptual scheme of the post-processing applied by the one-pass layer within the Climate DT workflow. Source: Lacima-Nadolnik et al. (preprint).
Energy Indicators computation
The processed climate data is then used by the Energy Indicators application to compute the indicators described in Data Description.
HPC integration
Within the Climate DT, this approach allows the indicators to be computed at model runtime, while the simulation advances. As a result, the produced climate metrics are directly tailored for the renewable energy sector.
The applications run inside dedicated containers on high-performance computing (HPC) platforms from the EuroHPC consortium.