IFS-NEMO
HydroLand output from the IFS-NEMO configuration is documented here for the historical period (1990–2014) and for a future-minus-historical projection analysis for 2015–2049. The page is organised by continent and covers bias-adjusted precipitation and temperature, actual evapotranspiration, and routed river discharge.
The historical validation is separated into three parts: bias-adjusted meteorological forcing compared with ERA5-Land reanalysis, simulated evapotranspiration compared with GLEAM, and routed river discharge compared with GRDC gauge measurements. Results are shown by continent because hydrological model performance varies across regions.
The projection section further below is not an observation-based validation. Instead, it compares projected HydroLand climatologies with the historical baseline and interprets the resulting hydrological changes together with the driving precipitation and temperature fields.
The reference datasets are as follows:
Meteorology (precipitation and temperature): ERA5-Land (Muñoz-Sabater et al., 2021)
Evapotranspiration: GLEAM (Global Land Evaporation Amsterdam Model, Martens et al., 2017)
River discharge: GRDC (Global Runoff Data Centre, 2023)
Full references and dataset links are listed in Related Resources.
Historical period (1990–2014)
North and Central America
Meteorological Forcing
In the meteorological-forcing plots, raw refers to the IFS-NEMO
precipitation or temperature field delivered through OPA before HydroLand bias
adjustment. mapped refers to the field after the HydroLand bias-adjustment
and mapping step, which is the meteorological forcing passed to the
hydrological model.
Precipitation biases over North and Central America are markedly reduced after bias adjustment, with a clearer and more coherent spatial pattern. The raw field features strong dry biases across western regions, particularly along the Pacific coast and mountainous areas, contrasted by wet biases over Central America and the southeastern United States. After adjustment, these contrasts are moderated, but a systematic wet bias becomes evident over Mexico, Central America, and the Gulf of Mexico region. Residual signals over western North America are weaker and more fragmented. At the monthly scale, biases remain relatively small but are more pronounced during the warm season, especially across southern and coastal regions.
The temperature biases were effectively removed across North and Central America, with values close to zero over most regions after bias adjustment. Pronounced warm biases in high-latitude and western areas are largely reduced, while only minor residuals remain in localized regions. Monthly biases remain consistently low throughout the year.
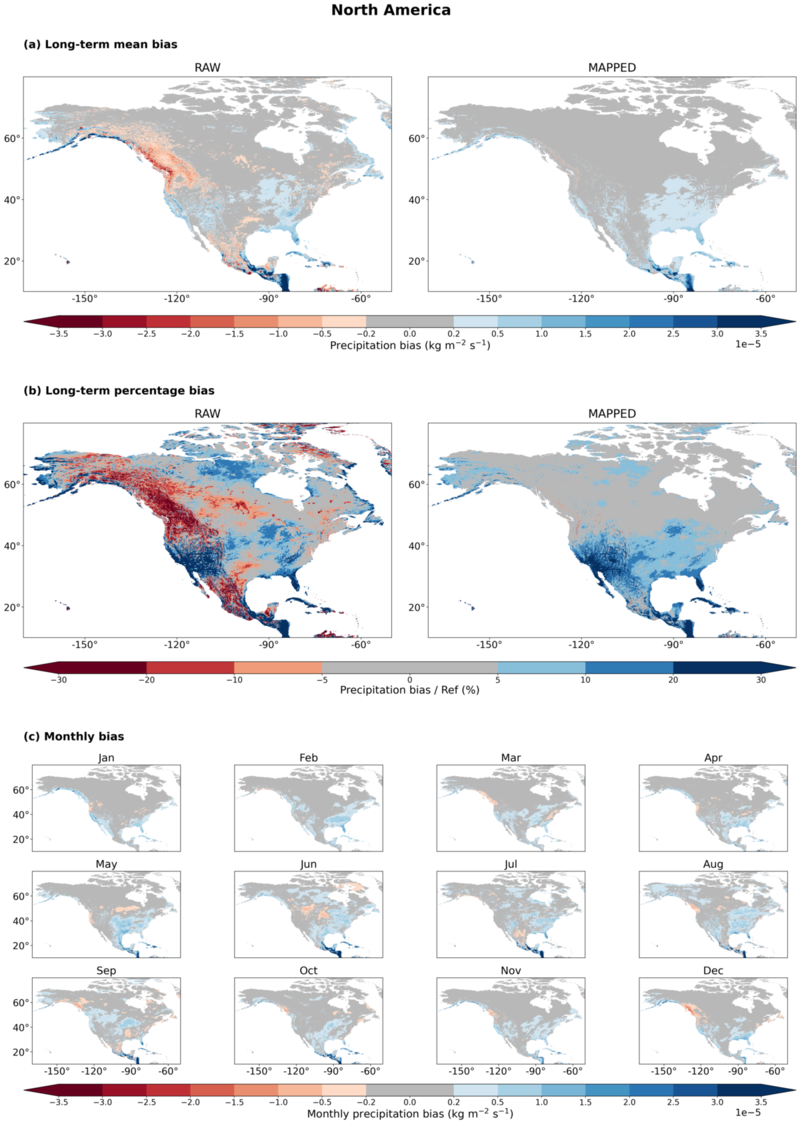
Precipitation bias over North and Central America before and after bias adjustment. (a) presents the long-term mean bias (left raw OPA IFS-NEMO field, right mapped field after bias adjustment), (b) the relative bias (left raw OPA IFS-NEMO field, right mapped field after bias adjustment), and (c) the monthly biases for each calendar month.
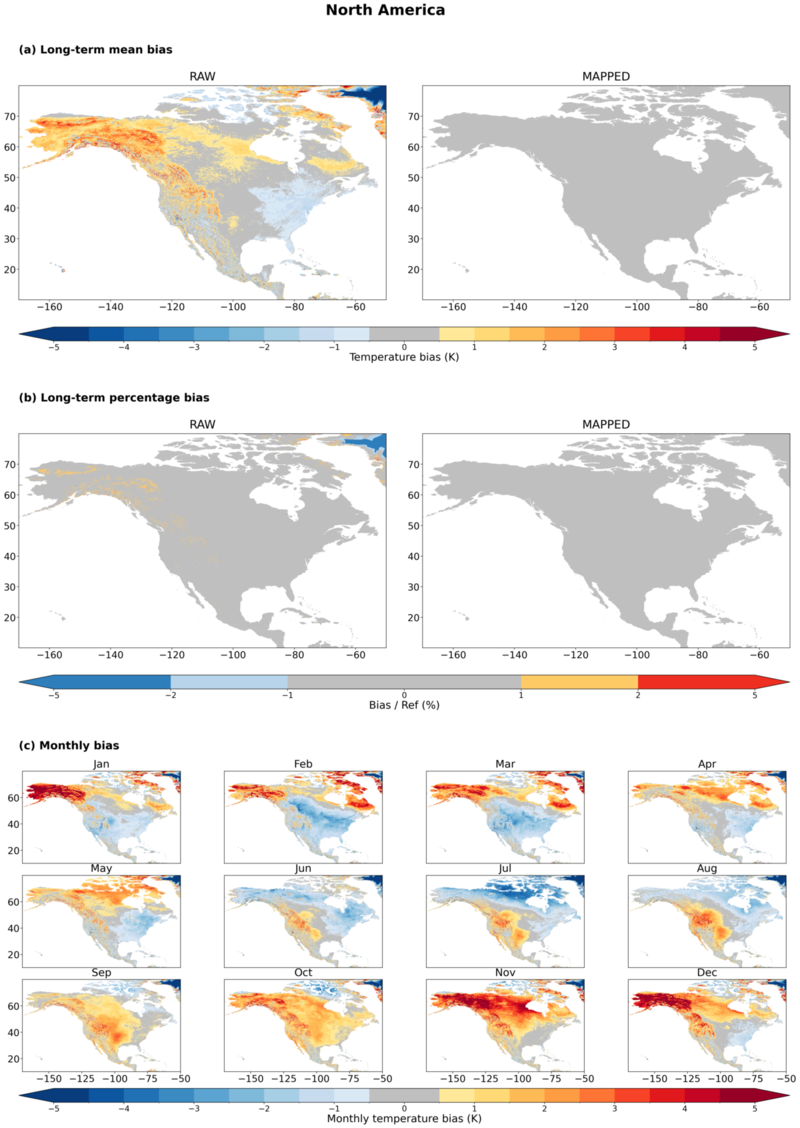
Temperature bias over North and Central America before and after bias adjustment. (a) presents the long-term mean bias (left raw OPA IFS-NEMO field, right mapped field after bias adjustment), (b) the relative bias (left raw OPA IFS-NEMO field, right mapped field after bias adjustment), and (c) the monthly biases for each calendar month.
Evapotranspiration
For the evapotranspiration evaluation, HydroLand-simulated actual evapotranspiration is compared with GLEAM. Ratios close to 1 indicate agreement, values above 1 indicate HydroLand overestimation, and values below 1 indicate underestimation. The difference panel shows the same comparison in mm/day, while the seasonal panel compares the monthly mean cycles.
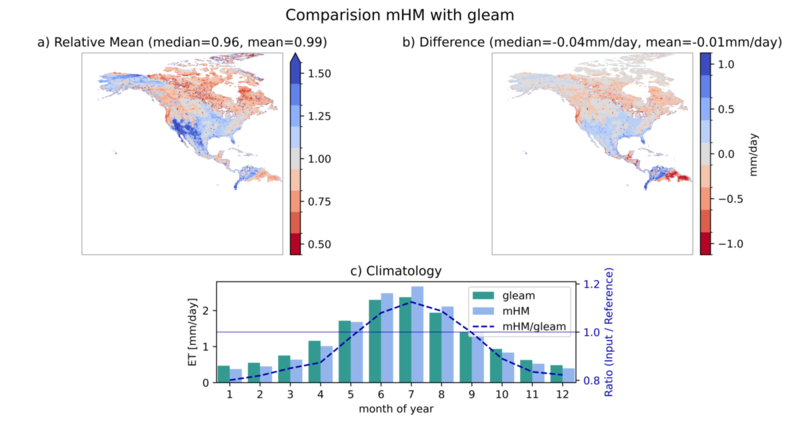
Comparison of mHM-simulated actual evapotranspiration with GLEAM evapotranspiration for North and Central America. (a) shows the relative mean values (E_mHM / E_gleam), (b) shows the difference in mm/day, and (c) shows the seasonality of mean aET compared with mean GLEAM ET for each month. The blue line is the relative mean value over the whole continent for each month.
Simulated evapotranspiration in North and Central America shows general long-term mean agreement with GLEAM reference ET. The model simulation slightly underestimates GLEAM ET by a median of 0.04 mm per day (14.6 mm/year), corresponding to roughly a 4% underestimation (median 96%). Agreement varies by region. In the arid region of the southwestern US and northern Mexico, the model overestimates the reference dataset in parts by more than 50%. In absolute terms, this corresponds to less than 0.5 mm per day. The strongest underestimation can be observed in the densely forested regions of northern Venezuela.
River Discharge
River discharge performance is summarised using the KGE beta component, defined here as the ratio of long-term simulated to observed mean discharge. Values above 1 indicate overestimated discharge volume, and values below 1 indicate underestimated discharge volume. In the text below, beta is interpreted as a long-term discharge-volume bias; it is not used to assess all hydrological fluxes and storage terms.
At 31 selected gauges, long-term river discharge is overestimated by about 30%. More than 90% of gauges are above 1, and around 69% exceed 1.2. This indicates a systematic wet bias across North and Central America. However, regional differences do exist. Basins in high latitudes (Alaska and northern Canada) show a close match with long-term observed flows and even slight underestimation. In contrast, basins located in the central US show high biases, reflecting a mix of existing precipitation biases in this region and the general challenge for hydrological models to reproduce river discharge in this area. This modelling challenge may also explain the lower bias in the eastern US.
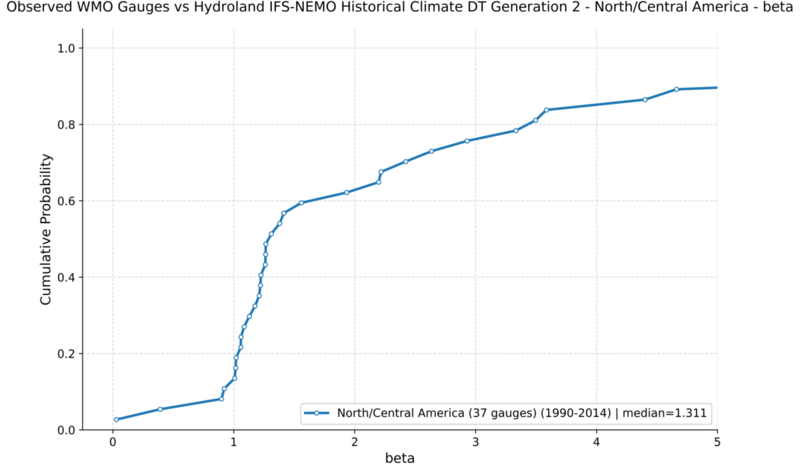
Cumulative distribution function of the KGE beta component for North and Central America.
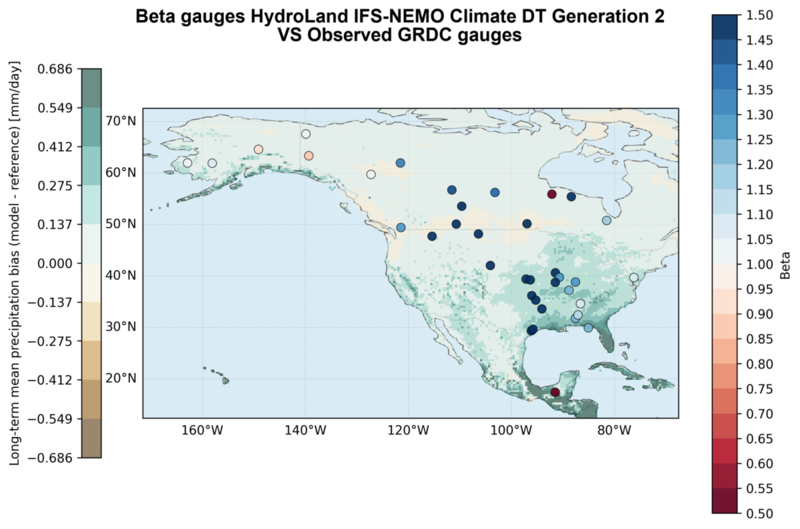
Selected discharge gauges and KGE beta values for North and Central America.
South America
Meteorological Forcing
Across South America, precipitation biases after adjustment are substantially reduced in magnitude, although a clear spatial structure remains. The raw simulation is characterized by widespread underestimation over the Amazon basin and central regions, contrasted by strong overestimation along the eastern coast of Brazil and parts of the Andes. After adjustment, these contrasting patterns are largely weakened, but a dominant wet bias emerges across much of the continent, particularly over the western part of the Amazon River basin and eastern Brazil. Residual deviations are still evident along coastal zones and the Andean margins, while interior regions show more moderate signals. On the monthly scale, biases display a clear seasonal progression, with stronger wet biases during the main rainy periods and reduced amplitudes during drier months.
In contrast, temperature biases over South America are almost entirely removed after bias adjustment. The mixed warm and cold patterns in the raw field are largely corrected, leaving only minimal residuals. Monthly biases remain negligible throughout the year.
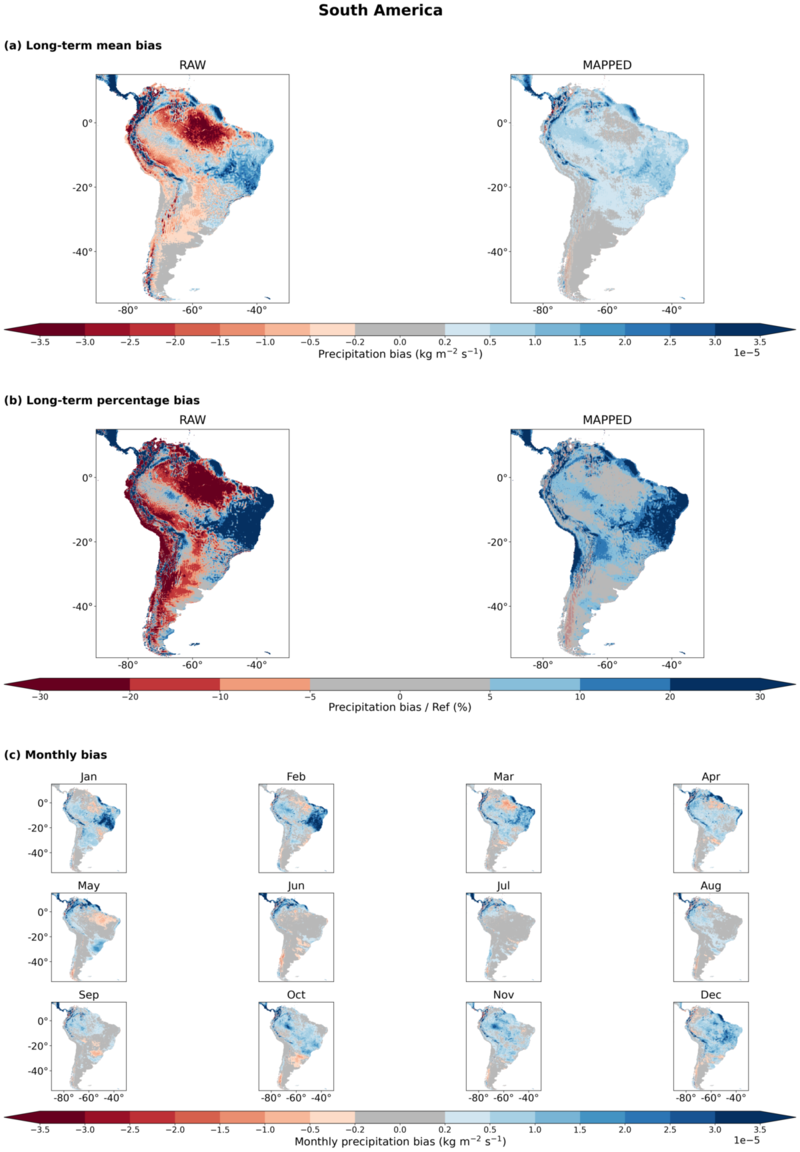
Precipitation bias over South America before and after bias adjustment. (a) presents the long-term mean bias (left raw OPA IFS-NEMO field, right mapped field after bias adjustment), (b) the relative bias (left raw OPA IFS-NEMO field, right mapped field after bias adjustment), and (c) the monthly biases for each calendar month.
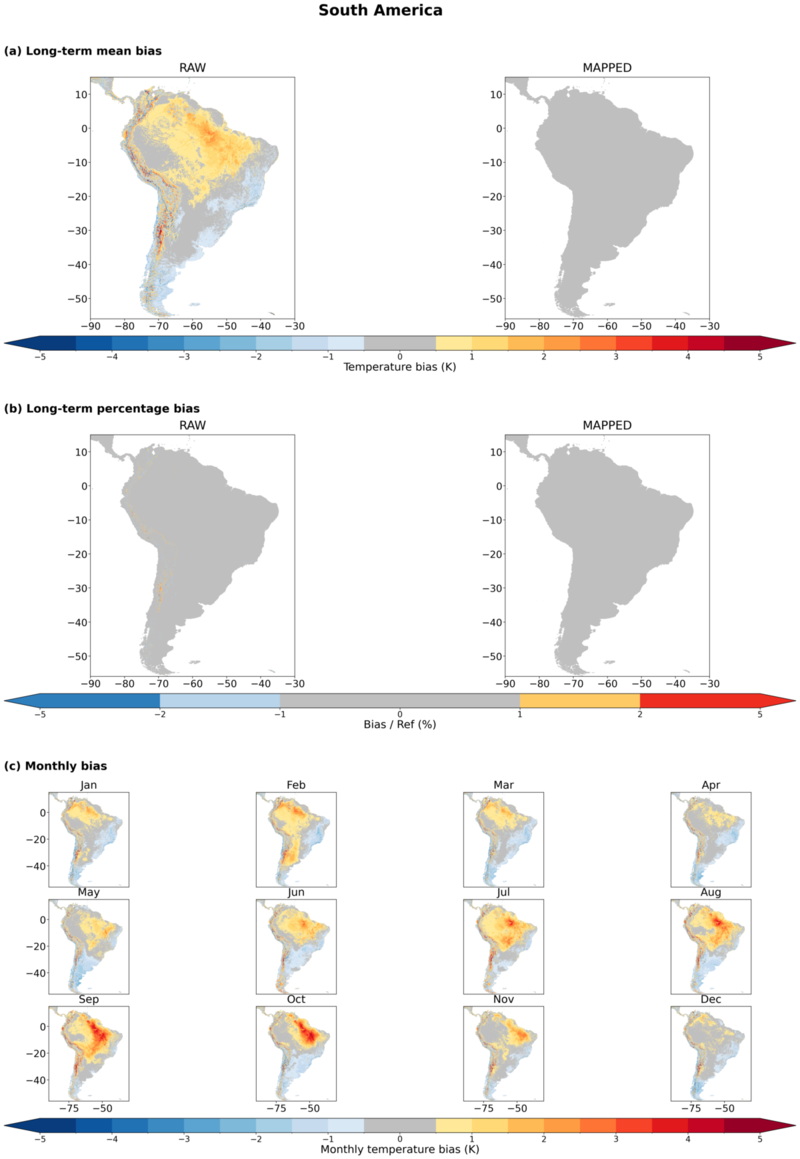
Temperature bias over South America before and after bias adjustment. (a) presents the long-term mean bias (left raw OPA IFS-NEMO field, right mapped field after bias adjustment), (b) the relative bias (left raw OPA IFS-NEMO field, right mapped field after bias adjustment), and (c) the monthly biases for each calendar month.
Evapotranspiration
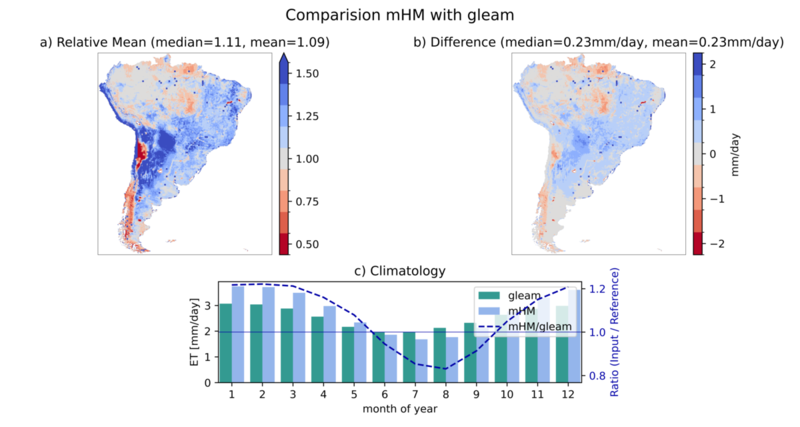
Comparison of mHM-simulated actual evapotranspiration with GLEAM evapotranspiration for South America. (a) shows the relative mean values (E_mHM / E_gleam), (b) shows the difference in mm/day, and (c) shows the seasonality of mean aET compared with mean GLEAM ET for each month. The blue line is the relative mean value over the whole continent for each month.
In South America, the simulation shows overestimation and underestimation of evapotranspiration across nearly the whole continent, with deviations generally below 0.5 mm/day. Underestimation is visible in the Patagonian region of southern Chile and the Andean Highlands. Overestimation is mostly visible in central South America. The highest overestimation of ET occurs in arid regions such as the Atacama Desert, eastern Bolivia and Paraguay, and western Argentina, where values are between 0.25 and 1.25 mm/day above the GLEAM long-term mean, corresponding to more than 50% overestimation. On the continental average, the simulation results show an overestimation of 20% for the months December to March and an underestimation for June, July, August, and September. The seasonality is much stronger than in the GLEAM reference dataset.
River Discharge
South America shows a wet discharge-volume bias. The median beta value is 1.62. About 77% of gauges are above 1, and around 67% exceed 1.2. This means the model usually overestimates mean discharge in the selected South American basins. The largest overestimations occur in eastern Brazil, a semi-arid region where precipitation also shows the highest relative biases. In contrast, river basins in the Amazon River basin show a slight underestimation that is mostly negligible. In summary, the discharge biases are consistent with precipitation biases and mostly occur in semi-arid regions. HydroLand reasonably captures long-term discharge volumes in the Amazon River basin.
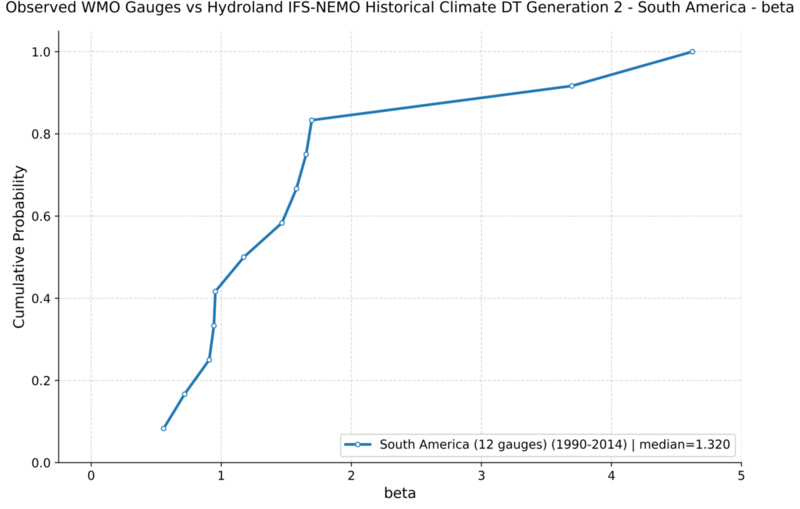
Cumulative distribution function of the KGE beta component for South America.
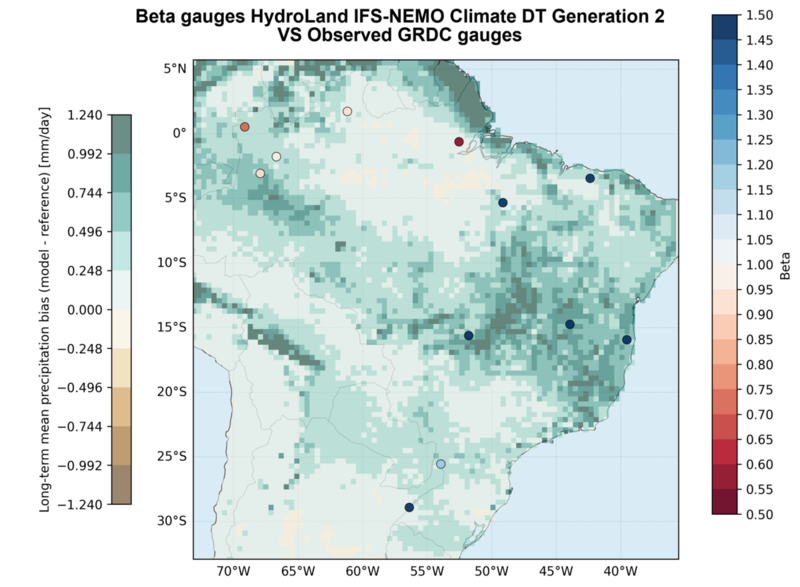
Selected discharge gauges and KGE beta values for South America.
Africa
Meteorological Forcing
Over Africa, the bias-adjusted precipitation shows a clear reduction in long-term mean bias, with most regions exhibiting relatively small residuals. A wet bias remains across tropical regions, particularly across the Sahel and central Africa, while parts of eastern and southern Africa also show moderate deviations. At the monthly scale, remaining biases are generally weak and follow the seasonal migration of the tropical rain belt, with enhanced signals during the peak rainy season.
Temperature bias adjustment over Africa effectively removes the large-scale warm biases present in the raw field, particularly over eastern and southern regions. After adjustment, temperature biases are reduced to near-zero levels across most of the continent, with only minor residuals in isolated areas. Monthly biases remain consistently small throughout the year, with limited seasonal variation.
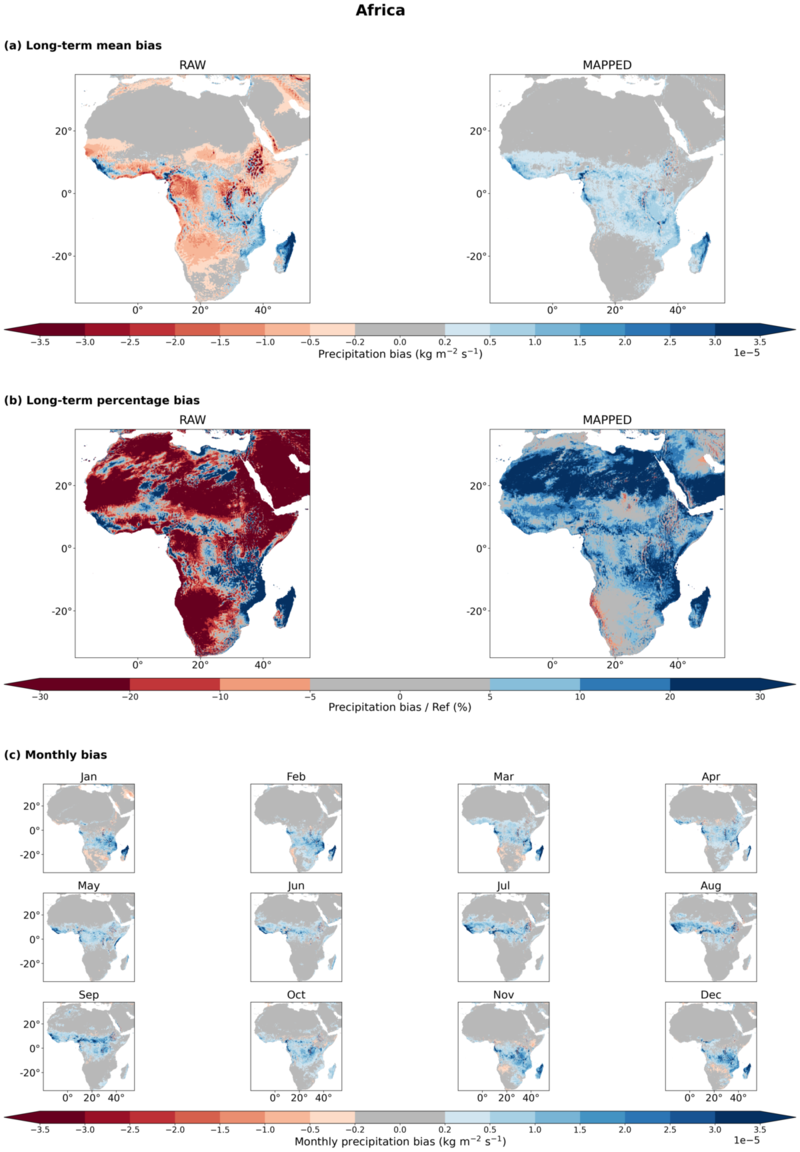
Precipitation bias over Africa before and after bias adjustment. (a) presents the long-term mean bias (left raw OPA IFS-NEMO field, right mapped field after bias adjustment), (b) the relative bias (left raw OPA IFS-NEMO field, right mapped field after bias adjustment), and (c) the monthly biases for each calendar month.
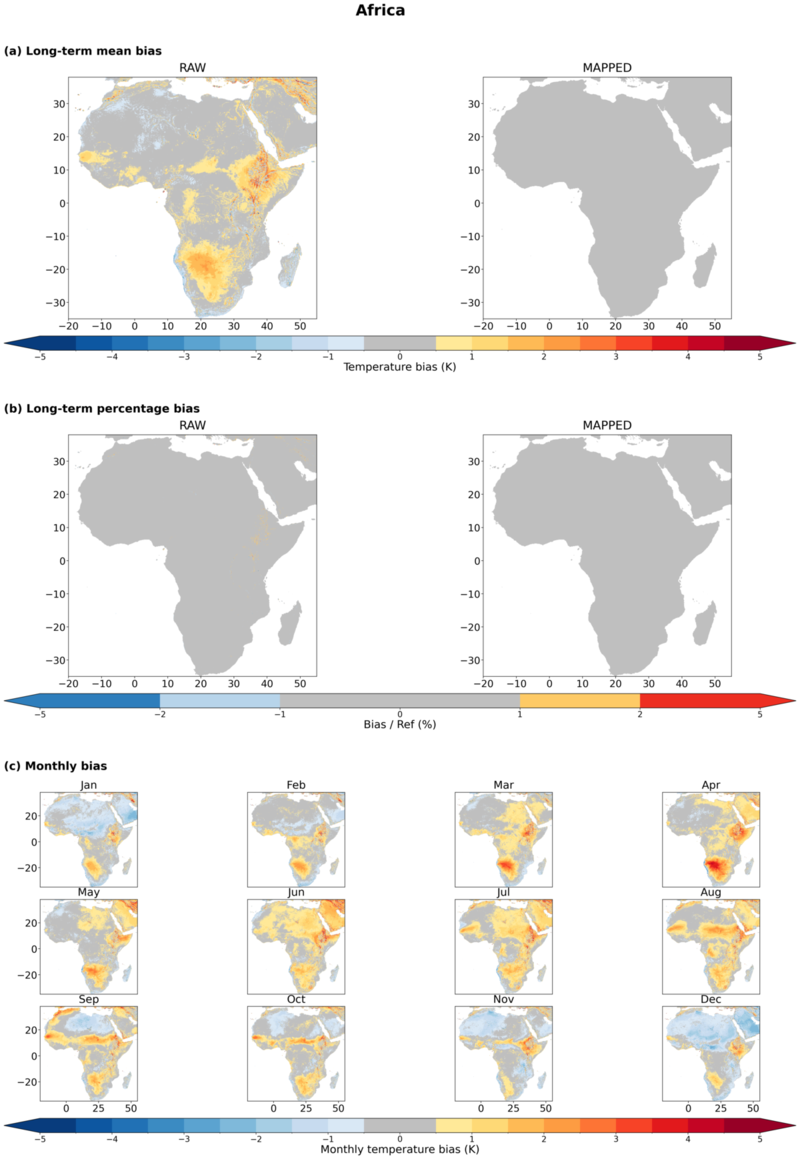
Temperature bias over Africa before and after bias adjustment. (a) presents the long-term mean bias (left raw OPA IFS-NEMO field, right mapped field after bias adjustment), (b) the relative bias (left raw OPA IFS-NEMO field, right mapped field after bias adjustment), and (c) the monthly biases for each calendar month.
Evapotranspiration
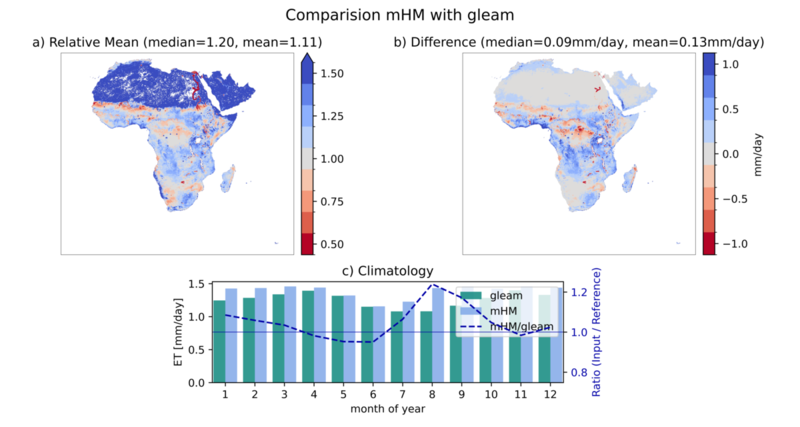
Comparison of mHM-simulated actual evapotranspiration with GLEAM evapotranspiration for Africa. (a) shows the relative mean values (E_mHM / E_gleam), (b) shows the difference in mm/day, and (c) shows the seasonality of mean aET compared with mean GLEAM ET for each month. The blue line is the relative mean value over the whole continent for each month.
Long-term evapotranspiration is mostly within the range of ±20%, except in deserts. Within sub-Saharan Africa, both underestimation and overestimation of ET can be observed. The strongest underestimation occurs in the Congo Basin, while the strongest overestimation occurs in the Sahel region. There is no apparent relationship to different climate zones (other than deserts) or precipitation biases. The continent-wide seasonal mean is difficult to interpret because it averages regions with different seasonal cycles. Most overestimation appears to occur in August.
River Discharge
Africa shows the strongest wet discharge-volume bias among the evaluated regions. Median beta values around 2.3 indicate that the simulations produce more than twice the observed long-term river discharge. More than 90% of gauges are above 1, and around 90% exceed 1.2. This is a very strong wet bias across most selected African basins.
These overestimations are not clearly explained by precipitation biases, as they occur in regions such as southern Africa that have relatively little precipitation bias. They are also not clearly explained by ET biases, which are generally lower than biases in river discharge. This points to additional uncertainty in the comparison with GLEAM and GRDC reference data, while HydroLand tends to reproduce the ET signal better than river discharge. Global hydrological models often struggle to reproduce river discharge in Africa, where limited data are available for model development and calibration.
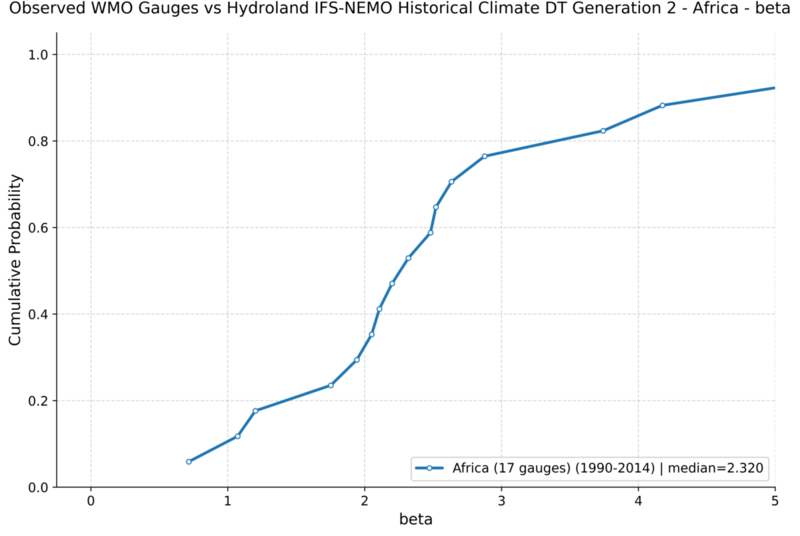
Cumulative distribution function of the KGE beta component for Africa.
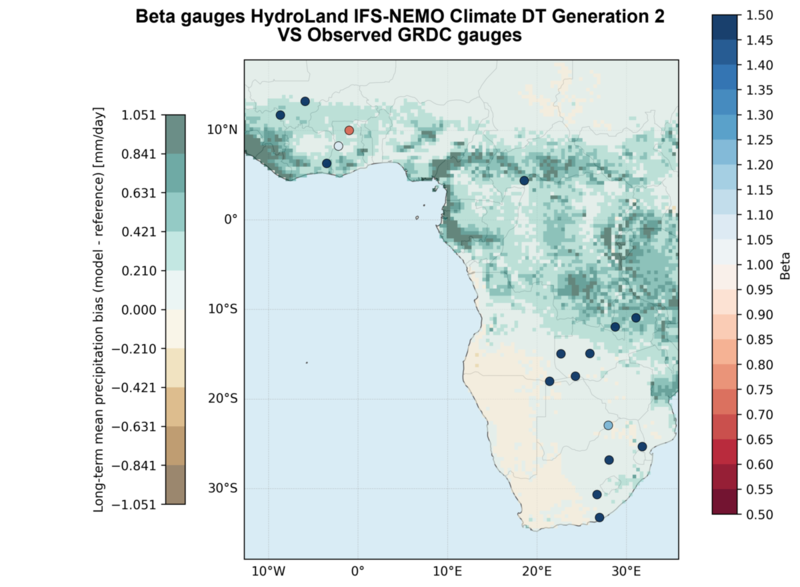
Selected discharge gauges and KGE beta values for Africa.
Europe
Meteorological Forcing
Precipitation biases are visible in the original IFS-NEMO data, with more frequent and stronger underestimation than overestimation, in particular over the Mediterranean region and the Iberian Peninsula. After bias adjustment, the long-term mean bias is reduced across most of Europe. A wet bias emerges over the Mediterranean region.
Temperature biases over Europe are largely eliminated after bias adjustment, with the adjusted field showing values close to zero across the entire domain. The raw simulation is characterized by widespread cold biases, particularly over northern and eastern Europe, which are effectively corrected. Residual biases are minimal and spatially scattered. At the monthly scale, a weak seasonal signal remains, with small negative biases appearing during late winter and early spring over northern regions, and slight positive biases emerging in summer over parts of central and eastern Europe.
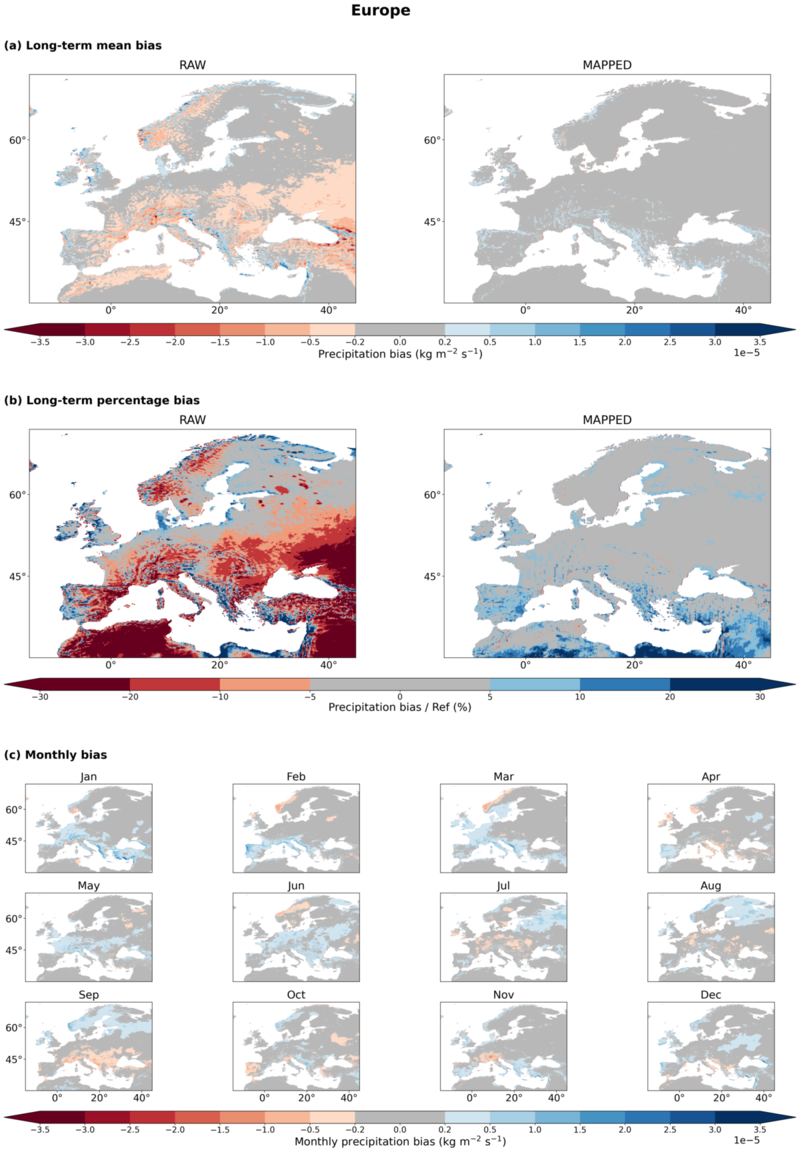
Precipitation bias over Europe before and after bias adjustment. (a) presents the long-term mean bias (left raw OPA IFS-NEMO field, right mapped field after bias adjustment), (b) the relative bias (left raw OPA IFS-NEMO field, right mapped field after bias adjustment), and (c) the monthly biases for each calendar month.
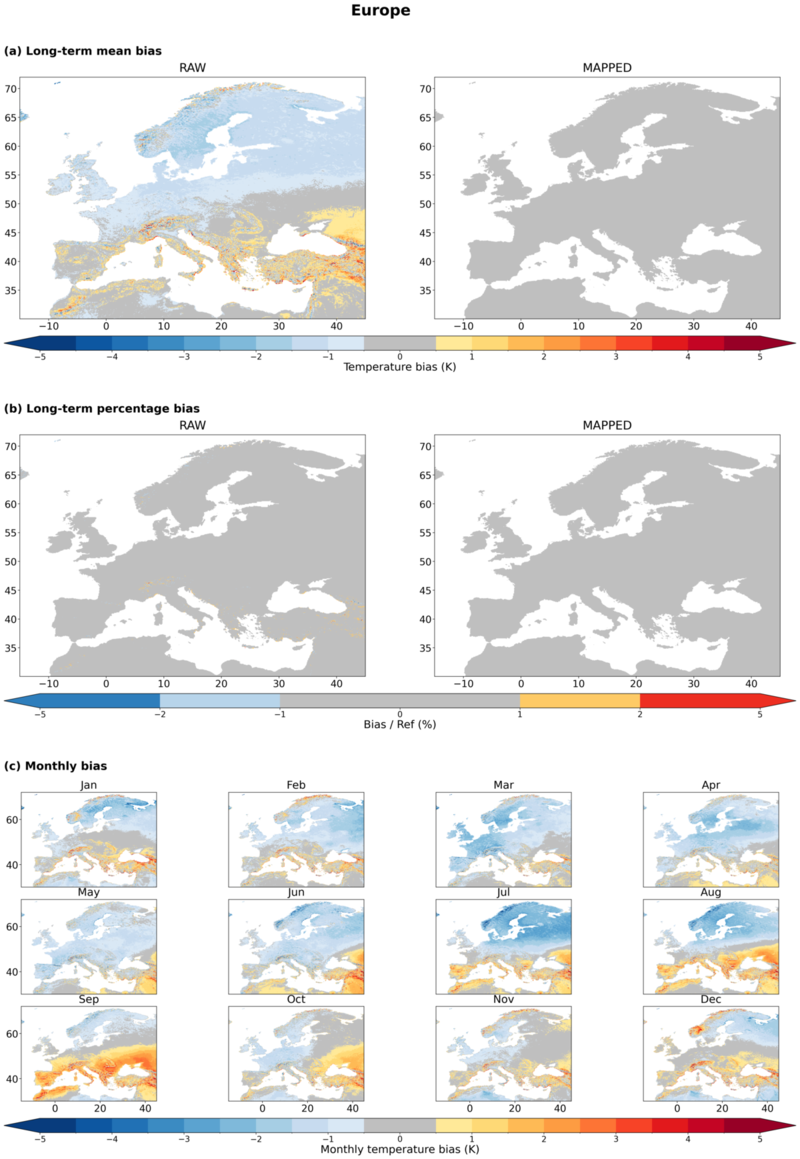
Temperature bias over Europe before and after bias adjustment. (a) presents the long-term mean bias (left raw OPA IFS-NEMO field, right mapped field after bias adjustment), (b) the relative bias (left raw OPA IFS-NEMO field, right mapped field after bias adjustment), and (c) the monthly biases for each calendar month.
Evapotranspiration
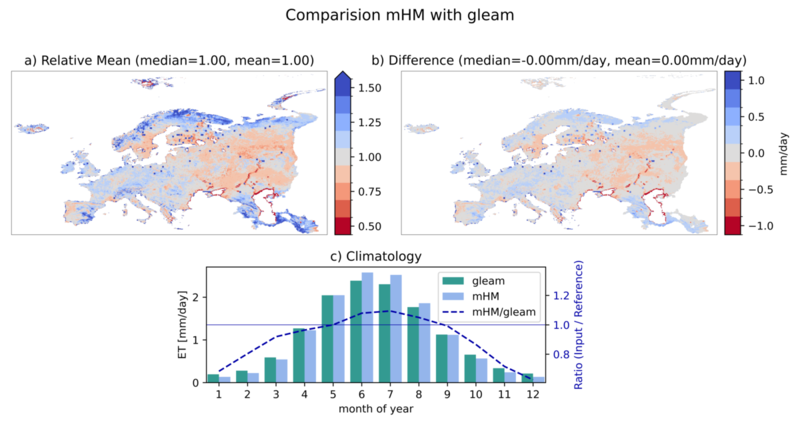
Comparison of mHM-simulated actual evapotranspiration with GLEAM evapotranspiration for Europe. The visible artifacts originate from GLEAM. (a) shows the relative mean values (E_mHM / E_gleam), (b) shows the difference in mm/day, and (c) shows the seasonality of mean aET compared with mean GLEAM ET for each month. The blue line is the relative mean value over the whole continent for each month.
In Europe, there is very good agreement between HydroLand-simulated ET and the observation-based GLEAM dataset at the regional mean scale, with a mean difference of 0 mm per day. This average masks spatial variability, with local overestimation and underestimation partly compensating each other. The highest biases are visible in arid regions (e.g., Spain, Greece, and east of the Caspian Sea) as well as in mountainous regions in the Alps and Norway. In all these regions, the simulation overestimates ET compared to GLEAM, but the absolute differences are low. The simulation underestimates ET in eastern Europe and especially on the coast of the Black Sea and the Caspian Sea; this is likely due to higher evaporation from these water bodies and coarse GLEAM resolution. In Europe, located entirely in the temperate climate zones of the northern hemisphere, the climatology shows that the general trend of seasonal evaporation is well matched. The simulation underestimates evaporation in winter, when ET is low, and overestimates it in summer.
River Discharge
Europe shows a moderate wet discharge-volume bias. The median beta value is 1.36. More than 90% of gauges are above 1, and around 70% exceed 1.2. Although the simulations tend to overestimate long-term river discharge, there is no strong overestimation at any gauge (i.e., all beta values are below 2). The highest beta values are observed within the Elbe River catchment and eastern Europe. A good match is observed for gauges located in western Germany and northern Finland.
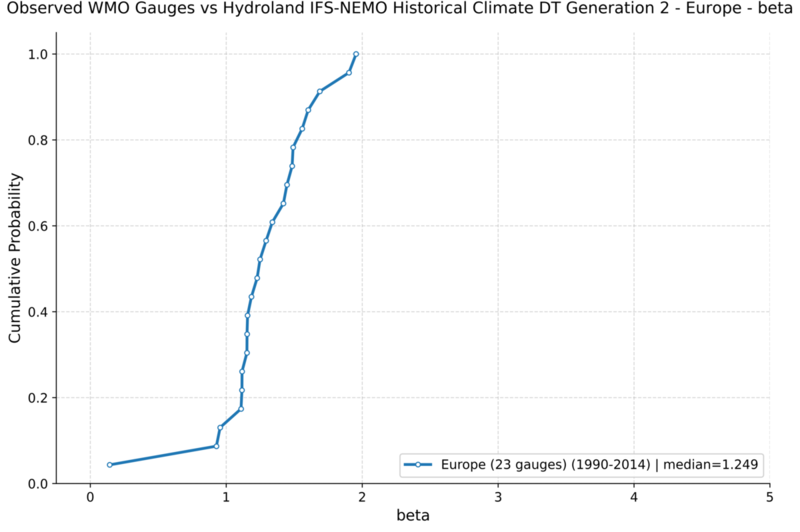
Cumulative distribution function of the KGE beta component for Europe.
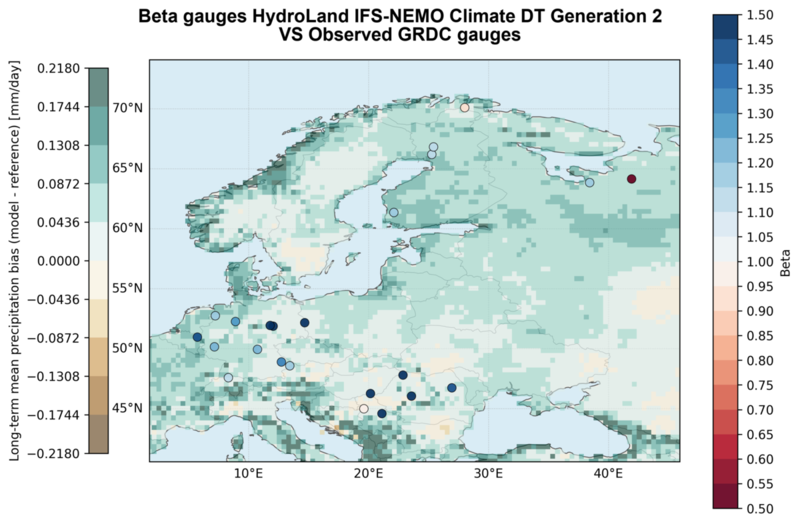
Selected discharge gauges and KGE beta values for Europe.
Asia
Meteorological Forcing
In Asia, the raw IFS-NEMO model output is characterized by a widespread underestimation of precipitation across large parts of the continent, particularly over Central Asia, India, the Tibetan Plateau, and inland regions. After bias adjustment, this large-scale dry bias is largely removed, but a tendency toward overestimation emerges in several regions. The most pronounced wet biases occur over South and Southeast Asia, as well as along coastal regions of East Asia, where precipitation is strongly influenced by monsoon dynamics. These regions are known for high spatial and temporal variability, and the remaining differences are comparatively small in absolute terms.
In contrast, northern and central Asia show much weaker residual biases, indicating a generally good agreement after adjustment. The seasonal cycle reveals that biases are closely tied to the monsoon regime, with stronger overestimation during the summer months when precipitation peaks, and weaker, more scattered signals during the dry season. Overall, the adjustment captures the broad seasonal evolution of precipitation well, although deviations remain during periods of intense monsoon activity.
Temperature biases in Asia are much smaller after bias adjustment. The raw field is dominated by widespread warm biases, particularly over South Asia, the Tibetan Plateau, and parts of East Asia, which are effectively removed after adjustment. The seasonal cycle is also well captured, although small biases remain in certain periods. Slight cold biases can be observed during the colder months over northern regions, while weak warm biases occasionally appear during summer over parts of Central and East Asia.
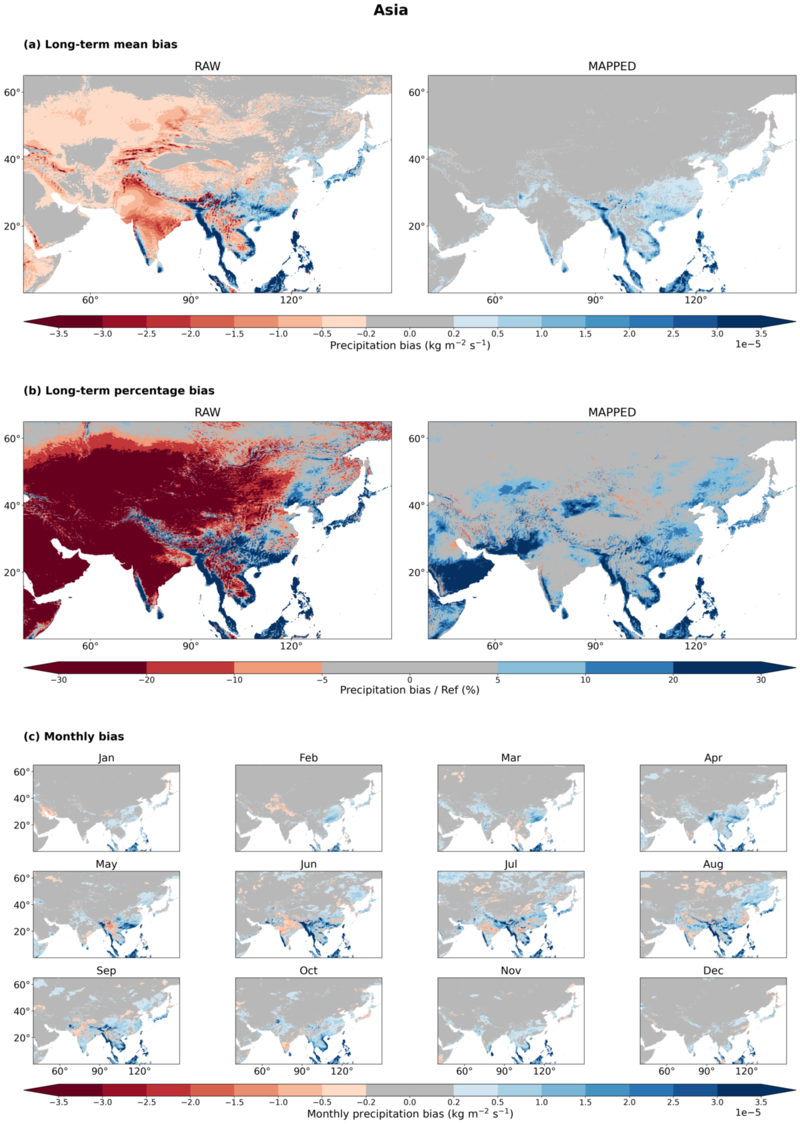
Precipitation bias over Asia before and after bias adjustment. (a) presents the long-term mean bias (left raw OPA IFS-NEMO field, right mapped field after bias adjustment), (b) the relative bias (left raw OPA IFS-NEMO field, right mapped field after bias adjustment), and (c) the monthly biases for each calendar month.
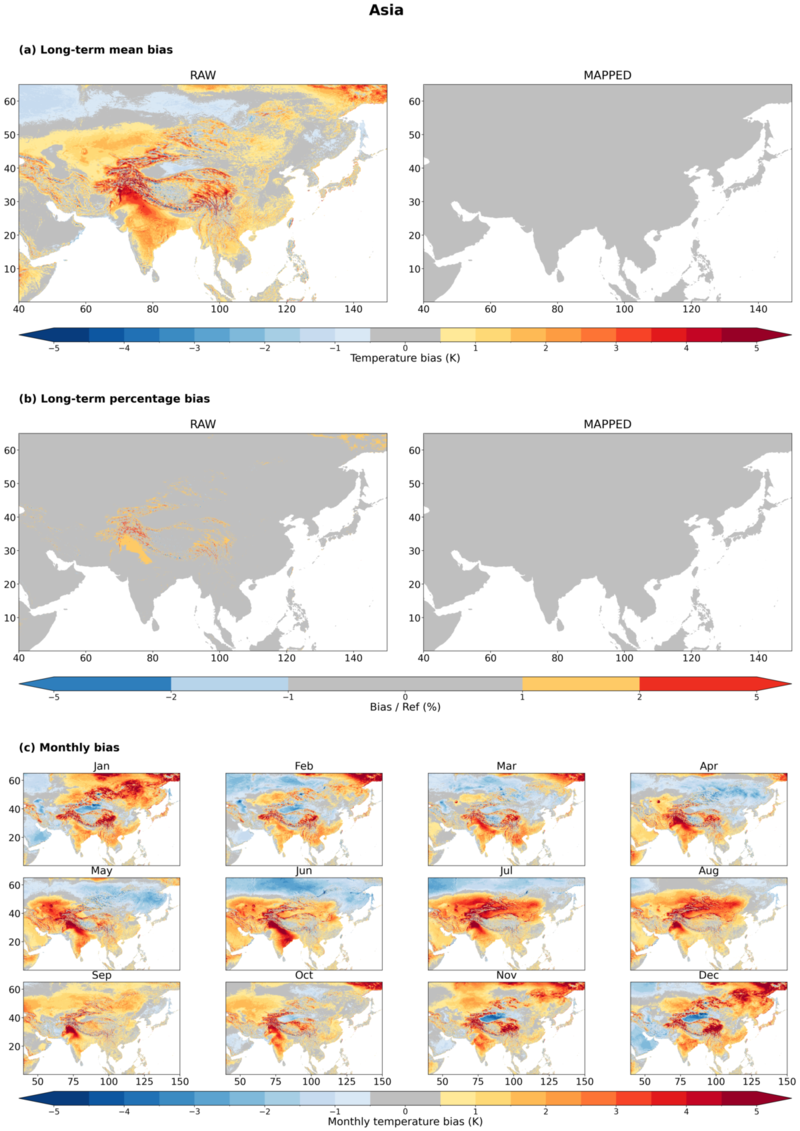
Temperature bias over Asia before and after bias adjustment. (a) presents the long-term mean bias (left raw OPA IFS-NEMO field, right mapped field after bias adjustment), (b) the relative bias (left raw OPA IFS-NEMO field, right mapped field after bias adjustment), and (c) the monthly biases for each calendar month.
Evapotranspiration
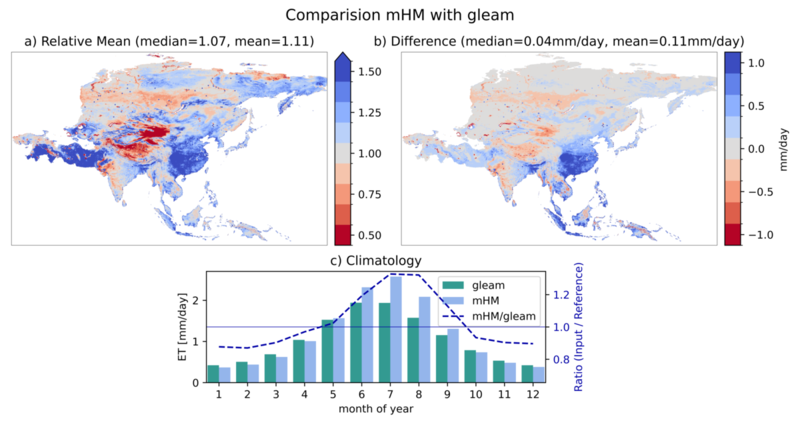
Comparison of mHM-simulated actual evapotranspiration with GLEAM evapotranspiration for Asia. (a) shows the relative mean values (E_mHM / E_gleam), (b) shows the difference in mm/day, and (c) shows the seasonality of mean aET compared with mean GLEAM ET for each month. The blue line is the relative mean value over the whole continent for each month.
The agreement of simulated evapotranspiration with GLEAM for the Asian continent varies strongly by region. In some regions, such as western India, Mongolia, the Tibetan Plateau, and parts of Southeast Asia, the simulation underestimates ET. In contrast, ET is overestimated in western China and most of Southeast Asia, as well as eastern India, Bangladesh, and Bhutan. On average, the simulation overestimates ET by 0.11 mm/day, or 11%. This overestimation seems to be highly seasonal, as the model only overestimates the mean evapotranspiration of the continent from June to September.
River Discharge
Long-term simulated river discharge matches observed discharge relatively well in Asia compared with other regions. The median beta value is about 1.02, very close to the ideal value of 1. Overall, about 44% of gauges lie within 0.8–1.2. Simulated discharge is higher than observed at about 59% of gauges, but the central bias is modest compared with the other regions. Over Japan, slight underestimations are visible, while slight overestimations occur in other locations. The relatively good performance in Asia is notable given the complex climate and hydrology of the region, which includes monsoon dynamics, diverse topography, and a wide range of hydroclimatic zones.
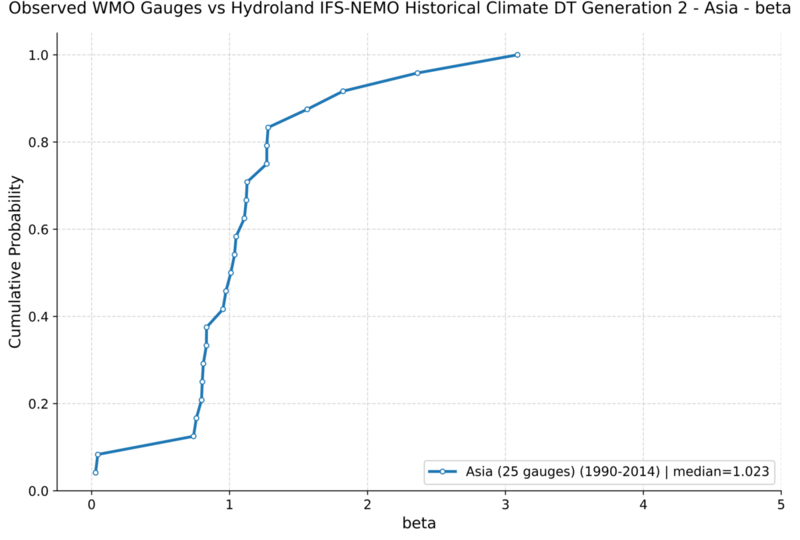
Cumulative distribution function of the KGE beta component for Asia.
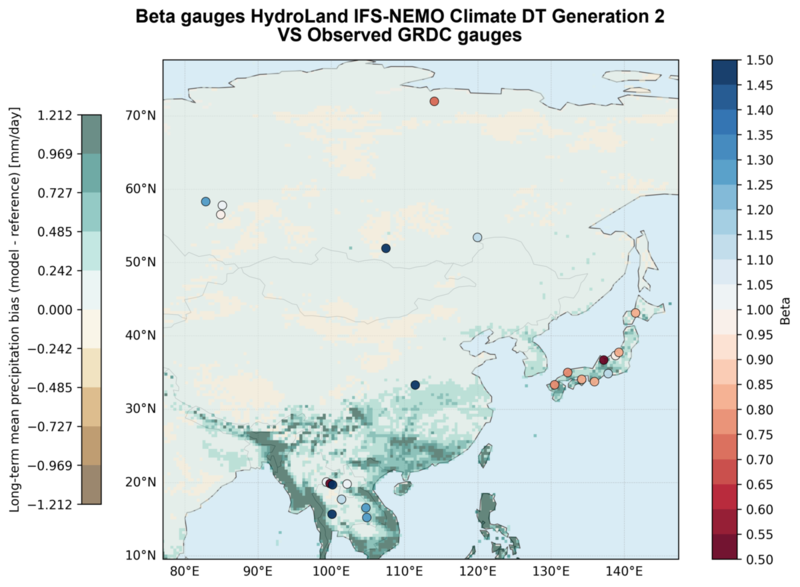
Selected discharge gauges and KGE beta values for Asia.
Oceania
Meteorological Forcing
For Oceania, the raw precipitation field shows a widespread underestimation, particularly over interior land areas. This dry bias is largely reduced after bias adjustment, with only weak residual signals over land. Slight overestimation remains in the northern part of Oceania and adjacent tropical regions. The seasonal cycle of precipitation reflects the characteristic rainfall regime of the region. Biases are more pronounced during the austral summer, when rainfall is concentrated in the northern tropics, while they remain weak and spatially confined during the rest of the year. This indicates that the seasonal evolution of precipitation is well captured, although deviations increase during periods of peak rainfall.
The raw temperature field shows moderate warm biases over much of Oceania, particularly over interior land areas. These biases are largely removed after bias adjustment, with the adjusted field showing only minimal and spatially scattered residuals. Seasonal variations are weak, and monthly biases remain small throughout the year, with no clear systematic pattern.
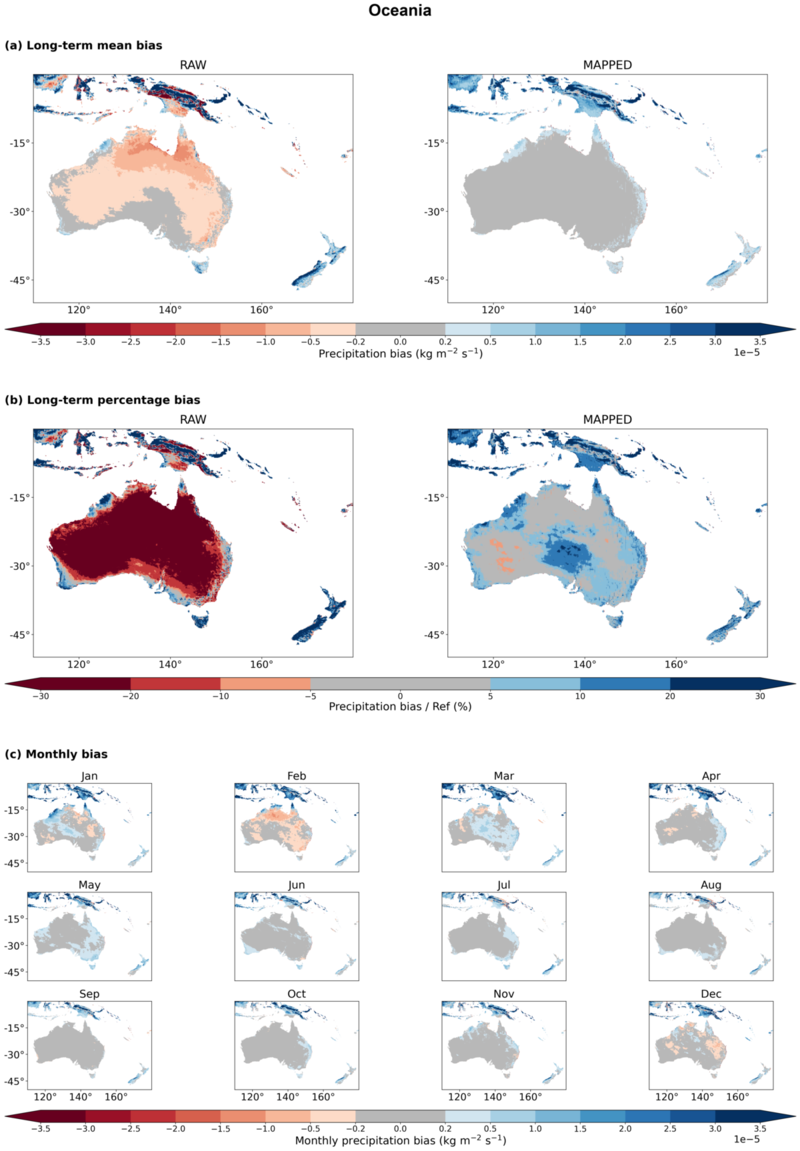
Precipitation bias over Oceania before and after bias adjustment. (a) presents the long-term mean bias (left raw OPA IFS-NEMO field, right mapped field after bias adjustment), (b) the relative bias (left raw OPA IFS-NEMO field, right mapped field after bias adjustment), and (c) the monthly biases for each calendar month.
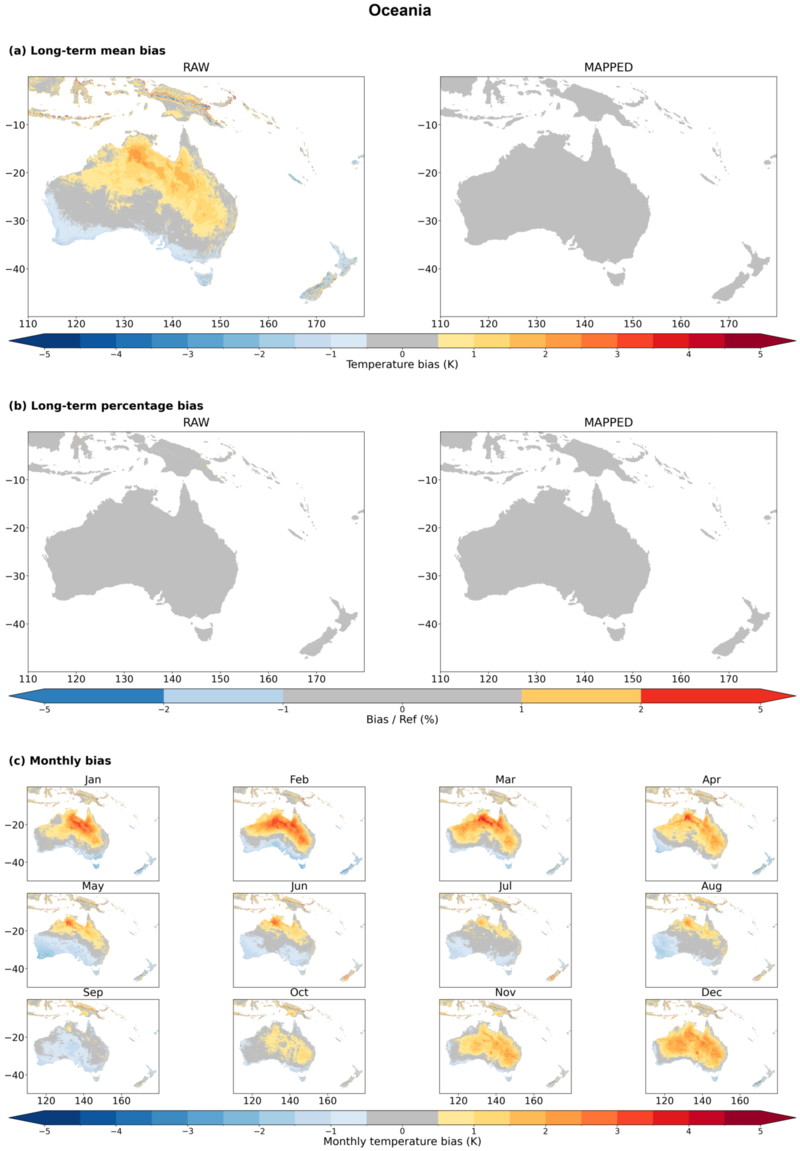
Temperature bias over Oceania before and after bias adjustment. (a) presents the long-term mean bias (left raw OPA IFS-NEMO field, right mapped field after bias adjustment), (b) the relative bias (left raw OPA IFS-NEMO field, right mapped field after bias adjustment), and (c) the monthly biases for each calendar month.
Evapotranspiration
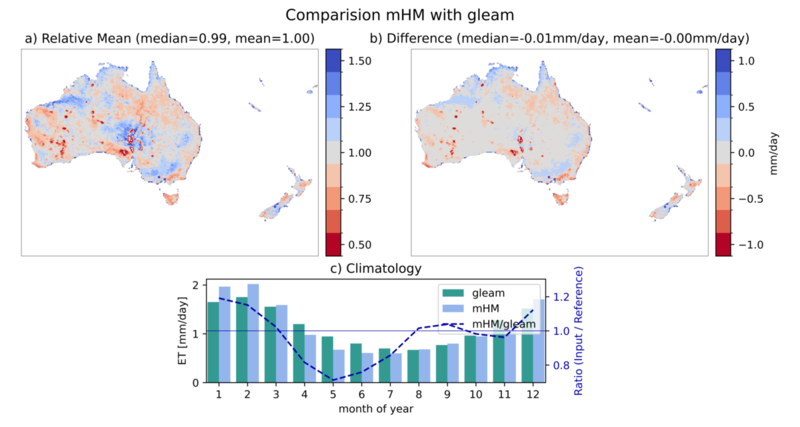
Comparison of mHM-simulated actual evapotranspiration with GLEAM evapotranspiration for Oceania. (a) shows the relative mean values (E_mHM / E_gleam), (b) shows the difference in mm/day, and (c) shows the seasonality of mean aET compared with mean GLEAM ET for each month. The blue line is the relative mean value over the whole region for each month.
Evapotranspiration over Oceania matches GLEAM reference data well. Averaged over the whole region, the simulation has a near-zero regional mean bias relative to GLEAM, while slightly more cells have a lower ET value than the reference dataset (median difference -0.01 mm/day). The seasonality shows that the simulation has a stronger seasonal cycle than the reference data, overestimating in austral summer and underestimating during the low-ET season from April to August.
River Discharge
Long-term river discharge is overestimated over most of the region. The median beta value is 1.69. Simulated discharge is higher than observed at about 76% of gauges, and around 72% exceed 1.2. The spatial distribution of beta values shows that the wet bias is widespread across the eastern part of Oceania. Wet biases in this region might be related to anthropogenic water use, which is not included in the model, but can significantly reduce river discharge in many basins across the region. Notably, dry biases are observed in the northern part of Oceania.
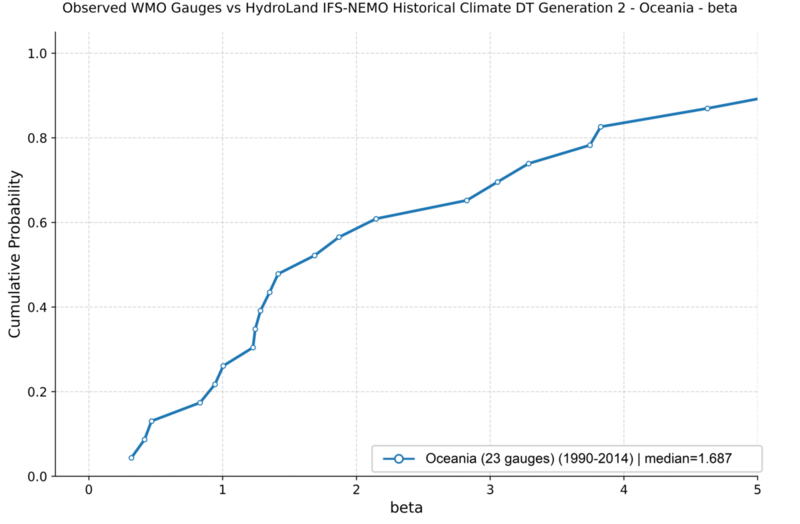
Cumulative distribution function of the KGE beta component for Oceania.
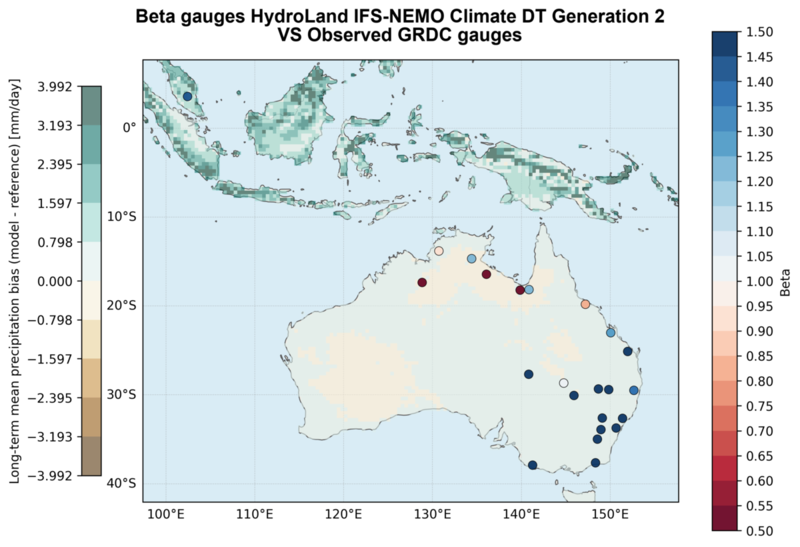
Selected discharge gauges and KGE beta values for Oceania.
Summary and conclusion
The IFS-NEMO historical validation shows that bias adjustment improves the meteorological forcing used by HydroLand. Temperature biases are largely removed across the evaluated regions, while precipitation biases are reduced but still retain regional and seasonal patterns, including wet residuals in parts of the tropics, monsoon-influenced regions, the Mediterranean, and northern Oceania.
HydroLand reproduces evapotranspiration more consistently than river discharge. Evapotranspiration agrees well with GLEAM in Europe and Oceania, is close on average in North and Central America, and is mostly within ±20% in Africa outside deserts. Larger regional or seasonal deviations remain in arid regions, the Congo basin, the Sahel, South America, and parts of Asia.
River discharge shows the largest uncertainty. Asia has the strongest overall agreement with GRDC observations, and Europe shows moderate overestimation, while North and Central America, South America, Africa, and Oceania generally show wet discharge biases. The strongest overestimation occurs in Africa. These regional biases should be considered when using IFS-NEMO HydroLand outputs and indicators, especially where residual precipitation biases, missing anthropogenic water use, or limited calibration and validation data affect the interpretation.
Projection period (2015–2049)
The projection material for IFS-NEMO compares future and historical HydroLand climatologies. Unlike the historical sections above, this part of the page is a change analysis rather than a validation against external observations. It uses the projected bias-adjusted meteorological forcing, projected actual evapotranspiration, and projected routed river discharge to describe the hydrological response under future climate conditions.
Global overview
Meteorology
At the global scale, precipitation changes are spatially heterogeneous and strongly seasonal. The clearest wetting signals appear in tropical and monsoon-influenced regions, while drying remains visible in parts of Australia, southern Africa, the Mediterranean, and sections of the Americas. Temperature changes are more coherent, with widespread warming over most land areas and the strongest signals over high latitudes, continental interiors, and major mountain regions.
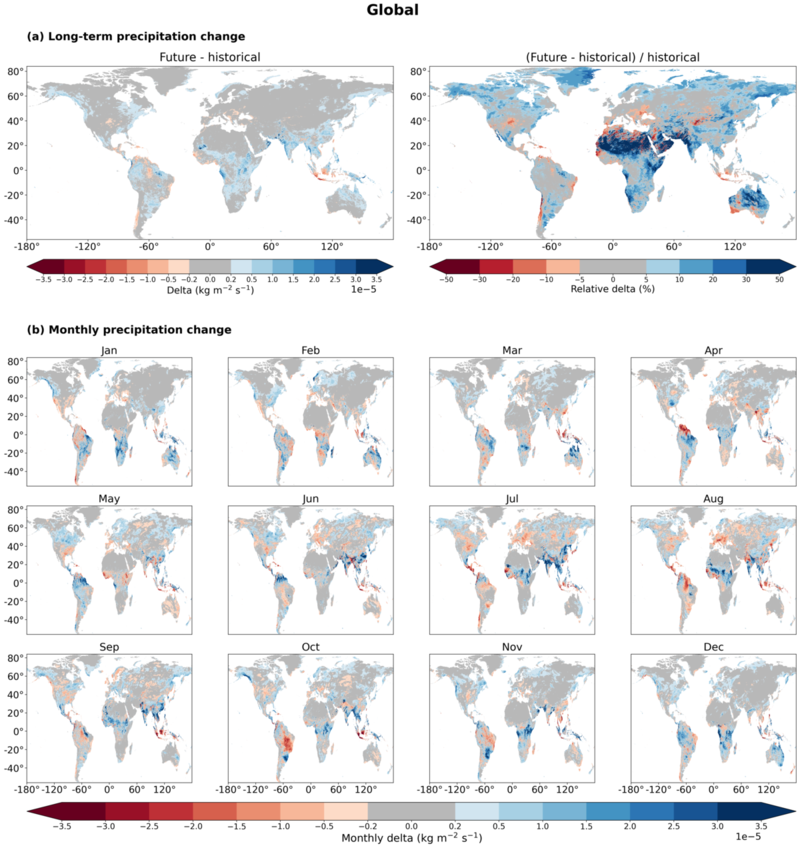
Projected precipitation change relative to the historical HydroLand forcing at the global scale. The figure shows long-term absolute and relative changes together with the monthly climatology differences.
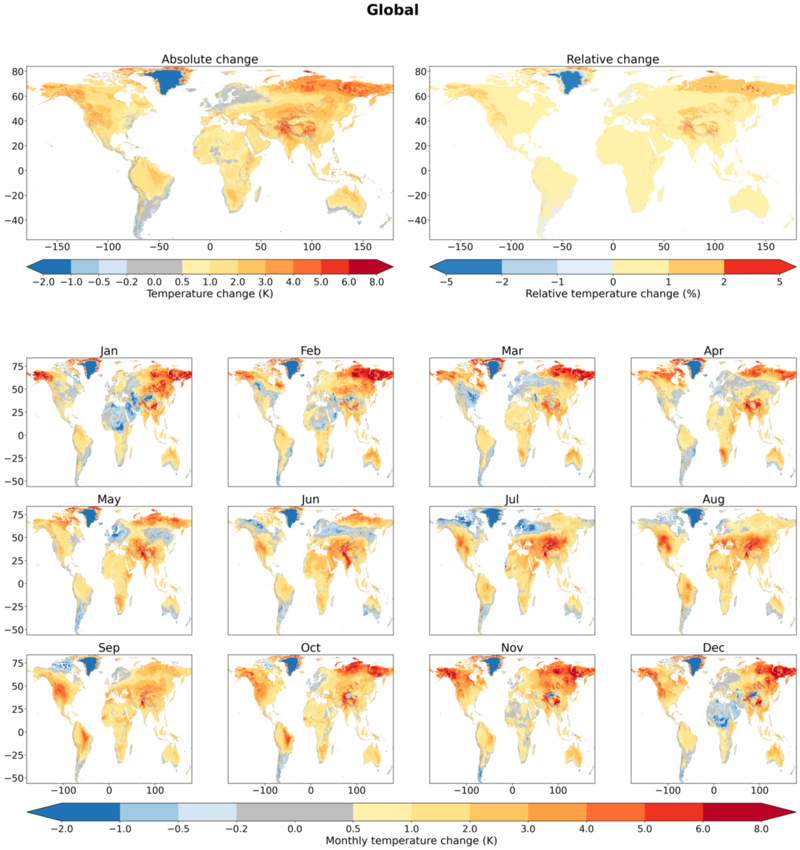
Projected near-surface temperature change relative to the historical HydroLand forcing at the global scale. The figure shows long-term absolute and relative changes together with the monthly climatology differences.
Evapotranspiration
The supplied global ET change map shows increases across large parts of high-latitude North America and Eurasia, tropical Africa, and parts of monsoon Asia, while decreases remain visible around the Mediterranean, portions of South America, and parts of Australia. This broad pattern is consistent with the combined influence of changing precipitation and widespread warming.
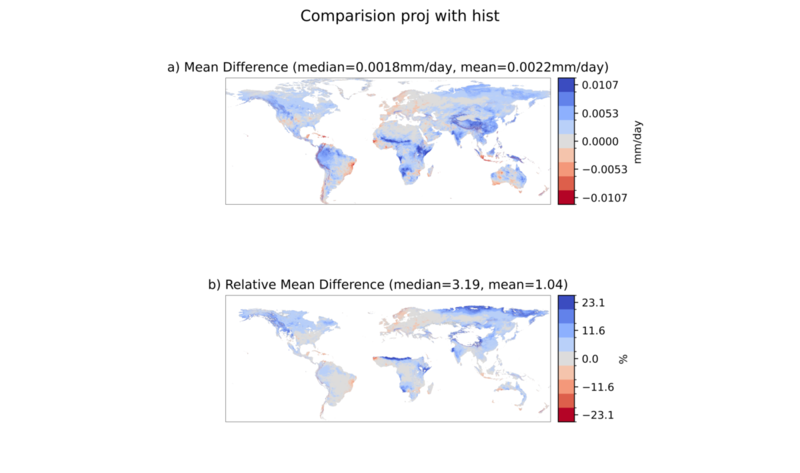
Global HydroLand actual evapotranspiration change between the projection and historical periods, shown as absolute and relative long-term mean differences.
River Discharge
Global discharge changes reflect two dominant modes. In tropical and monsoon-influenced regions, positive discharge changes are mainly driven by enhanced precipitation. Over high latitudes and major mountain systems, positive changes are more closely tied to warming-induced snow and glacier melt. Negative changes cluster over Australia, subtropical southern Africa, and parts of the Americas, where drying and higher evaporative demand reinforce each other.
The monthly discharge panels show the same contrast in seasonal form. Precipitation-driven signals follow monsoon migration, while temperature-driven signals peak in spring and early summer in snow- and glacier-fed basins. Relative changes are particularly large where moderate warming shifts melt timing or amplifies evapotranspiration losses.
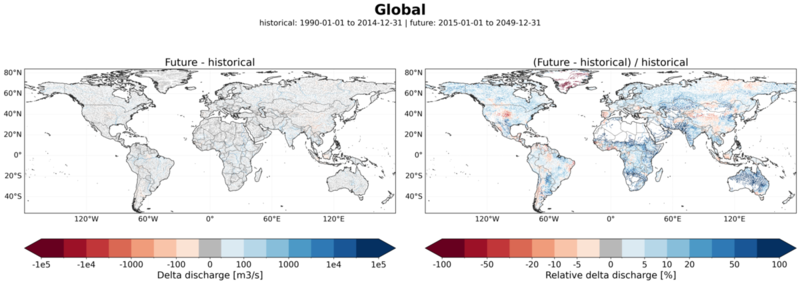
Long-term absolute and relative river-discharge change at the global scale.
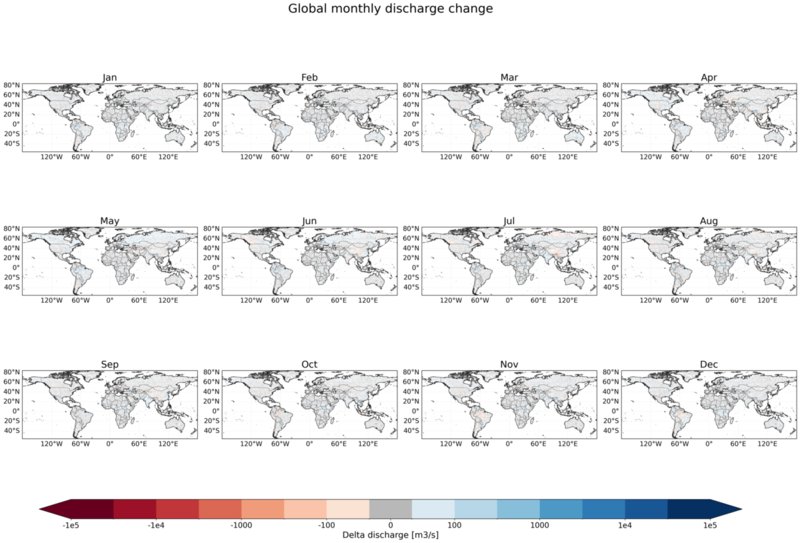
Monthly absolute river-discharge climatology change at the global scale.
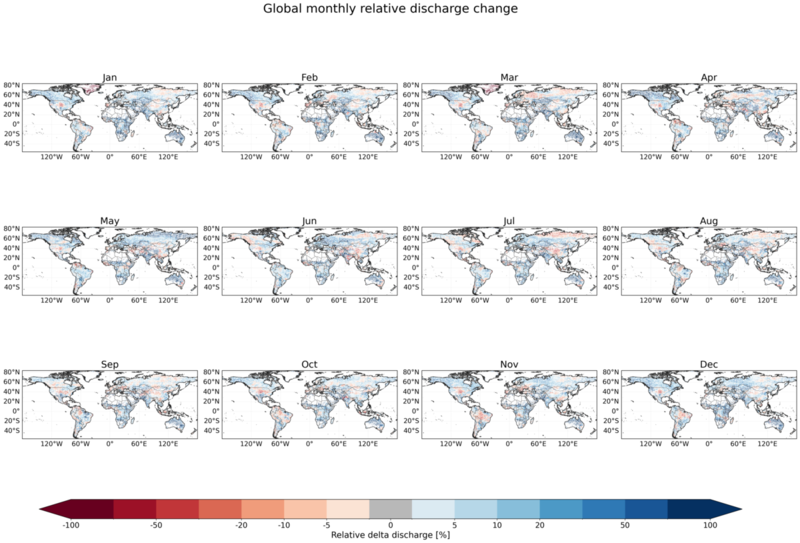
Monthly relative river-discharge climatology change at the global scale.
North and Central America
Meteorology
North and Central America becomes generally warmer and slightly wetter overall, but the change is spatially heterogeneous. Precipitation increases are most pronounced in Alaska and northern Canada, while parts of the southwestern United States and northern Mexico show drying. Temperature increases are widespread, typically around 1–3 K, with much stronger warming over Arctic and sub-Arctic regions during late autumn and winter.
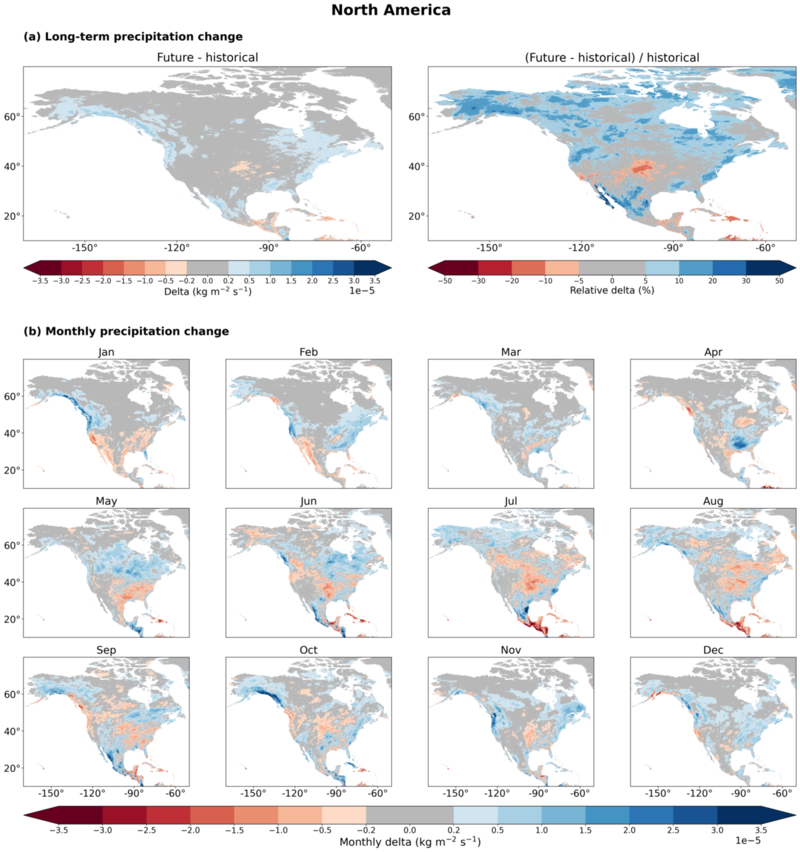
Projected precipitation change over North and Central America.
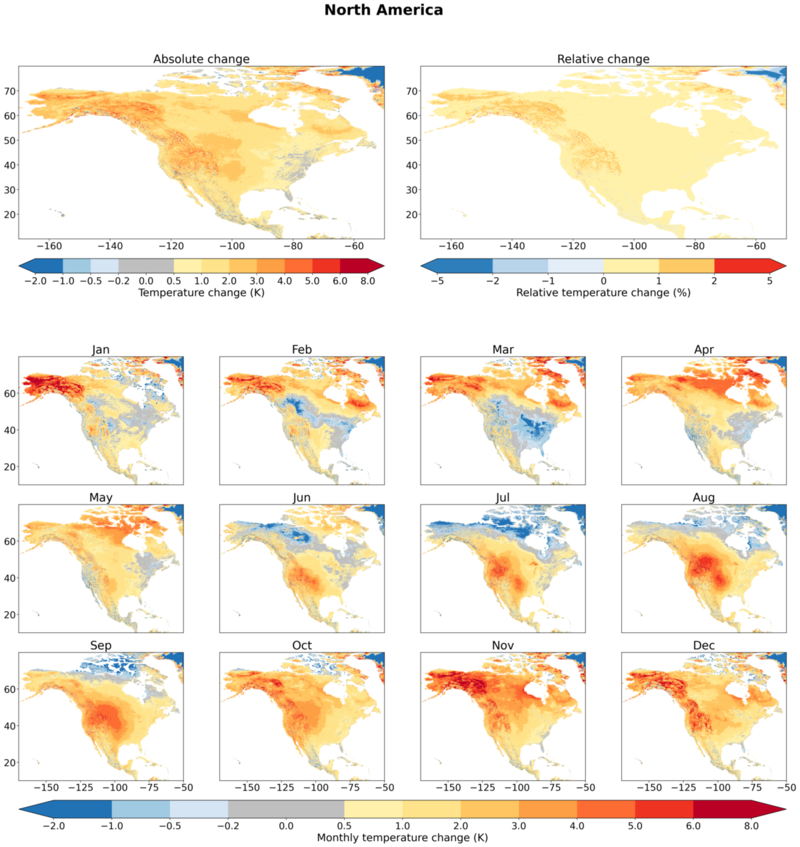
Projected near-surface temperature change over North and Central America.
Evapotranspiration
Projected actual evapotranspiration increases dominate the high-latitude and humid parts of the continent, while decreases are more visible in the southwestern United States, northern Mexico, and parts of Central America. The local absolute-change panel provides the ET context required to interpret the strong regional contrasts in future discharge.
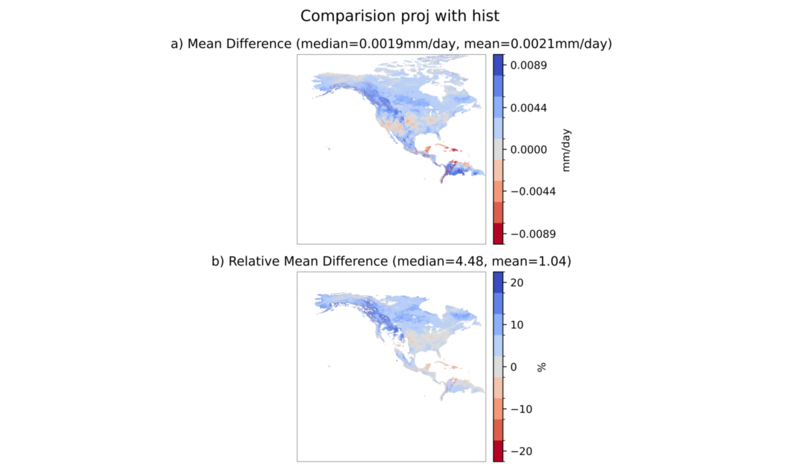
Regional HydroLand actual evapotranspiration change for North and Central America, shown as absolute and relative long-term mean differences.
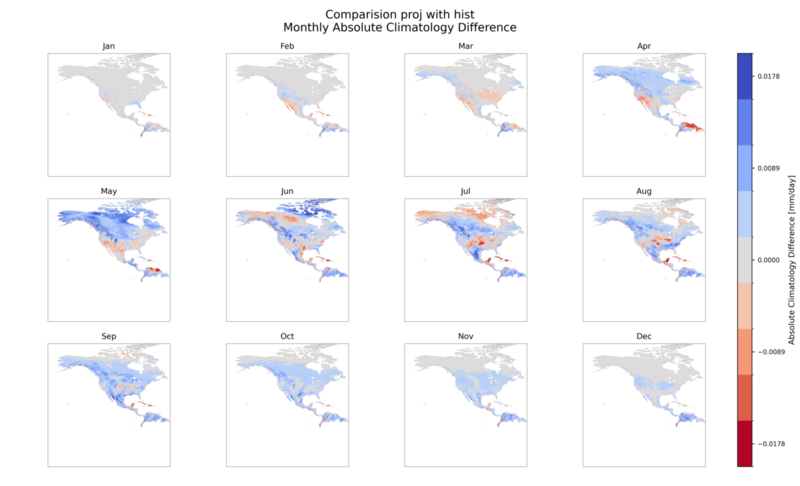
Monthly local absolute HydroLand actual evapotranspiration change for North and Central America.
River Discharge
The projected discharge response shows a pronounced north-south divide. Canadian and Alaskan rivers gain discharge through a combination of increased high-latitude precipitation and earlier snowmelt under strong warming. Western United States rivers show substantial losses where reduced precipitation and sustained warming progressively deplete the snowpack that historically supports summer flows.
The monthly discharge panels show the temperature control clearly. Northern gains are strongest in late winter and spring as snowmelt occurs earlier, whereas several western United States basins approach near-total late-season losses in the relative-change view.
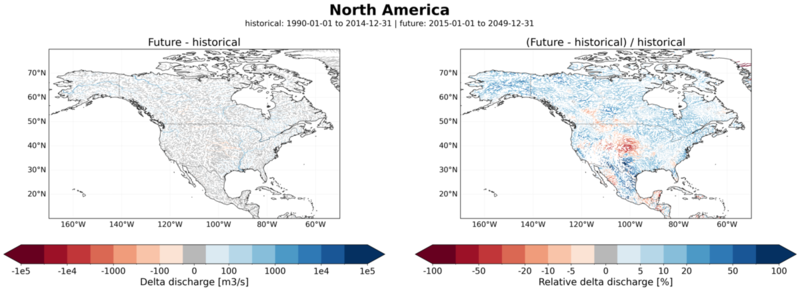
Long-term absolute and relative river-discharge change over North and Central America.
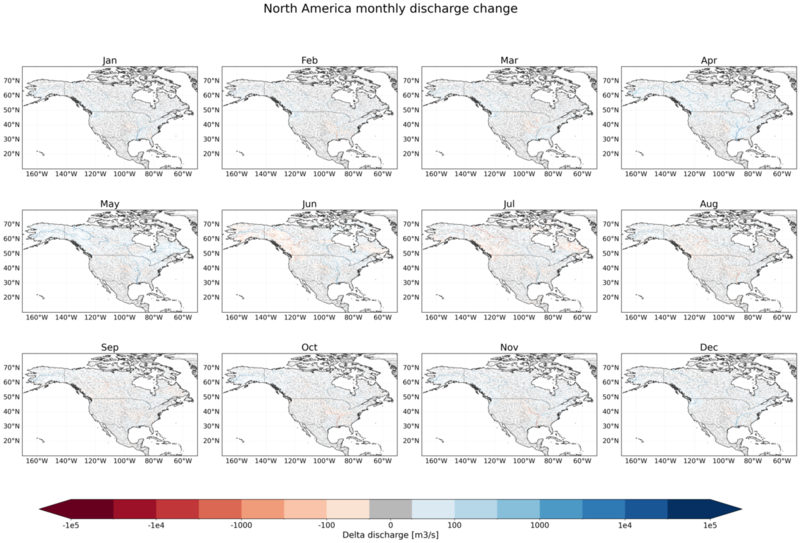
Monthly absolute river-discharge climatology change over North and Central America.
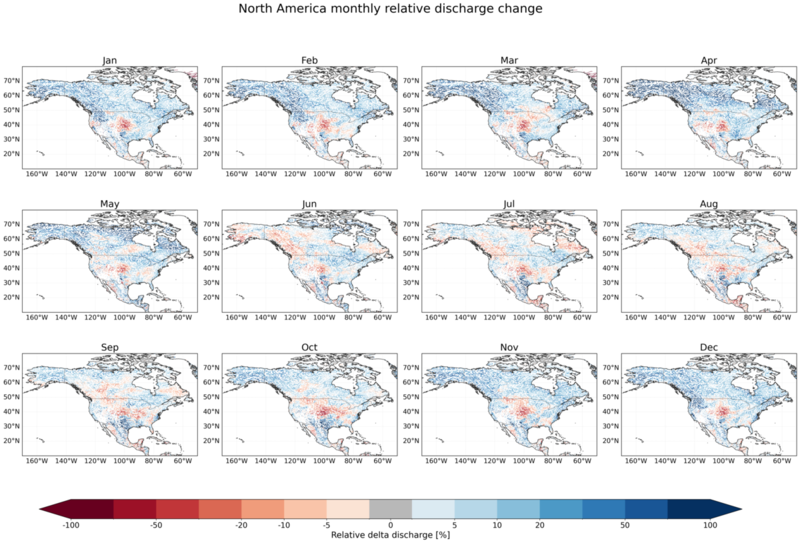
Monthly relative river-discharge climatology change over North and Central America.
South America
Meteorology
South America becomes substantially warmer, while precipitation changes remain mixed across regions and seasons. Long-term wetting is concentrated over parts of the Amazon basin and tropical northern South America, whereas southern South America and parts of the Andes show more localized drying. Warming is widespread, usually around 1–3 K, and is strongest over central and eastern Brazil and parts of subtropical South America.
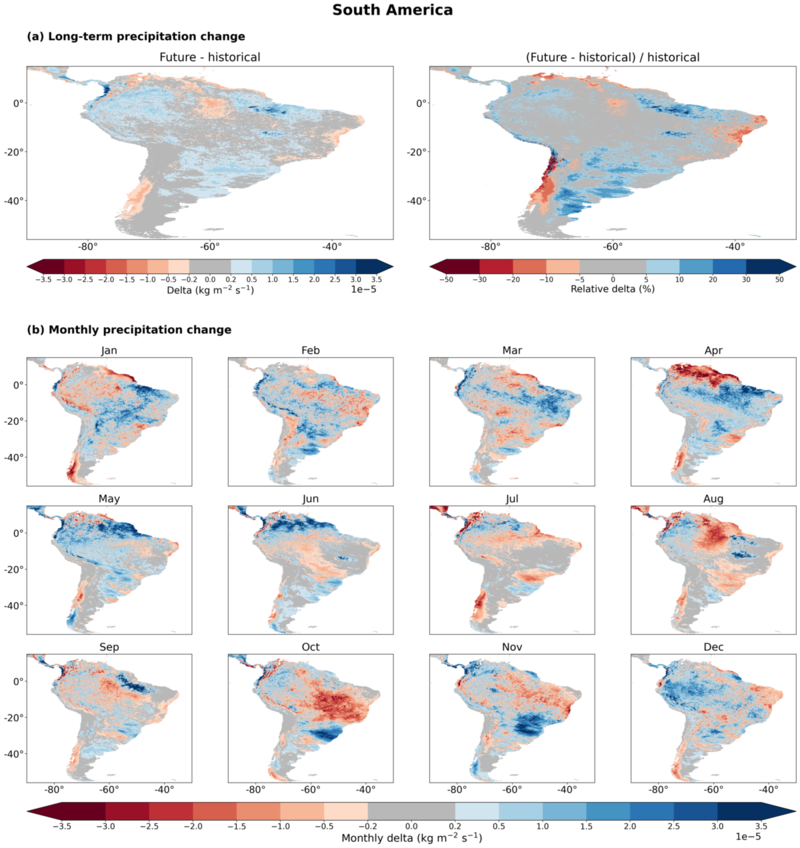
Projected precipitation change over South America.
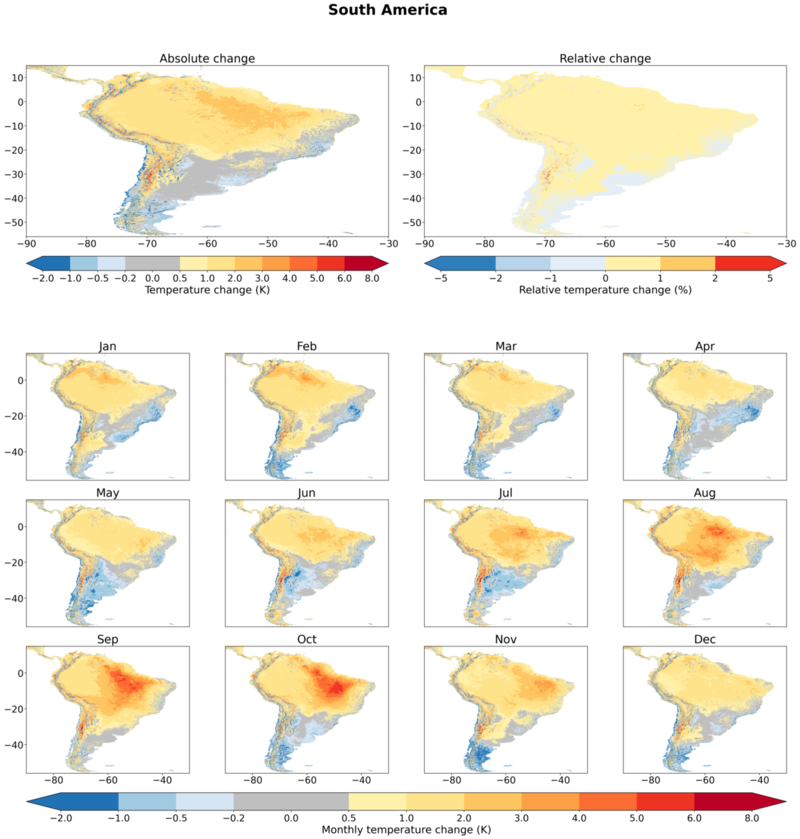
Projected near-surface temperature change over South America.
Evapotranspiration
The ET change maps indicate increases over substantial parts of tropical and subtropical South America, with more localized decreases along the southern cone and selected Andean and coastal regions. These patterns help explain why future runoff changes are weak or negative across parts of the Amazon and central Brazil despite mixed precipitation signals.
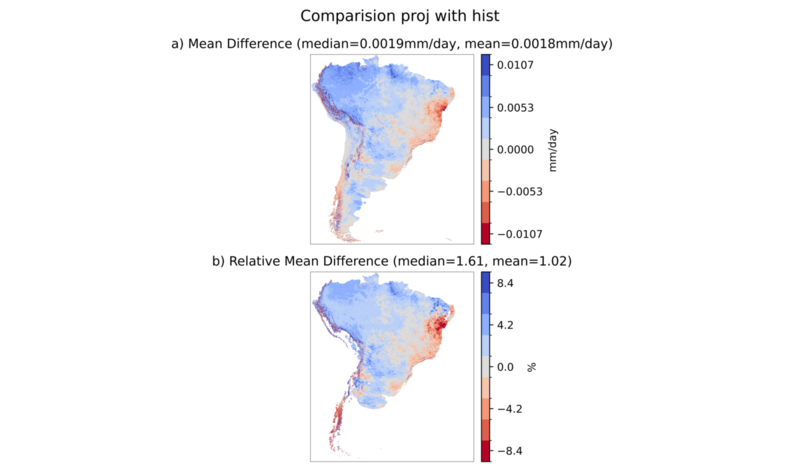
Regional HydroLand actual evapotranspiration change for South America, shown as absolute and relative long-term mean differences.
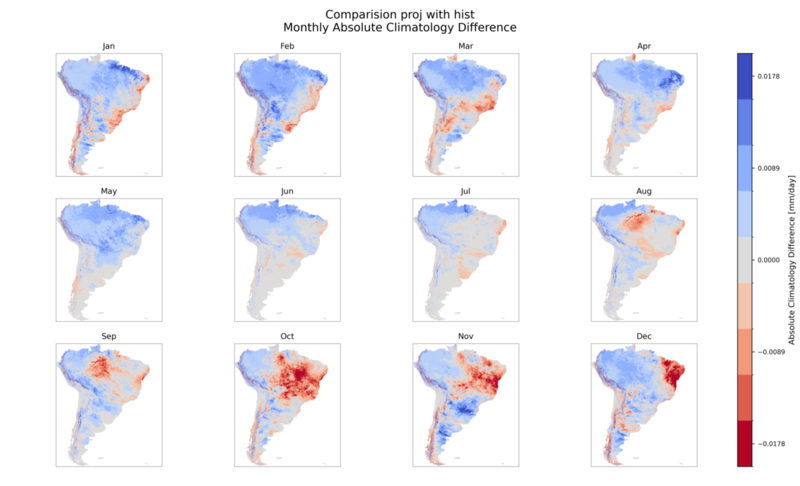
Monthly local absolute HydroLand actual evapotranspiration change for South America.
River Discharge
The discharge response differs strongly by region. Andean tributaries show positive changes driven primarily by glacier and snowmelt acceleration under sustained warming. Over the Amazon lowlands the signal is near-neutral to slightly negative, while southern South American rivers decrease where reduced precipitation combines with the lack of a compensating meltwater source.
The monthly panels show the Andean melt signal peaking in austral summer. Over the Amazon and central Brazil, warming-enhanced evapotranspiration reduces the runoff fraction for much of the year, even where precipitation changes are small.
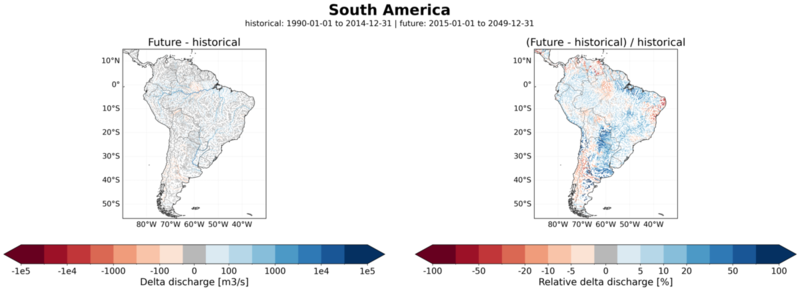
Long-term absolute and relative river-discharge change over South America.
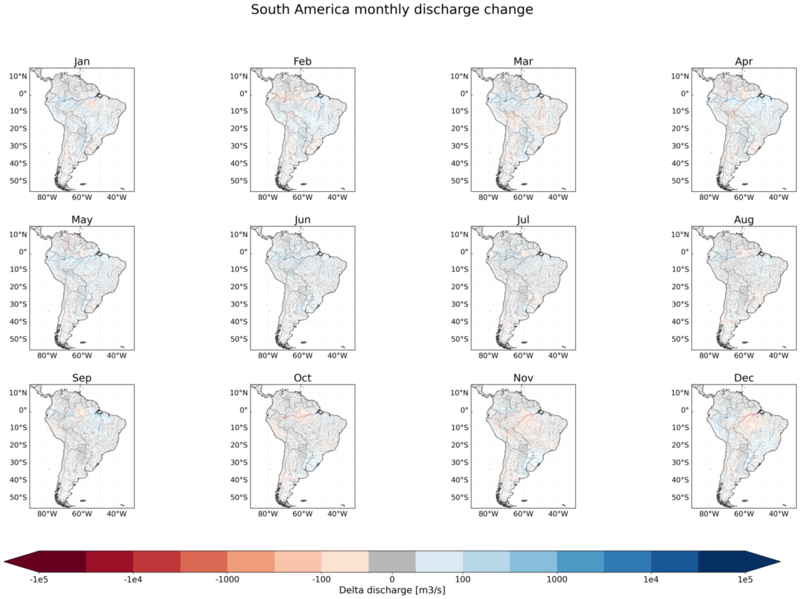
Monthly absolute river-discharge climatology change over South America.
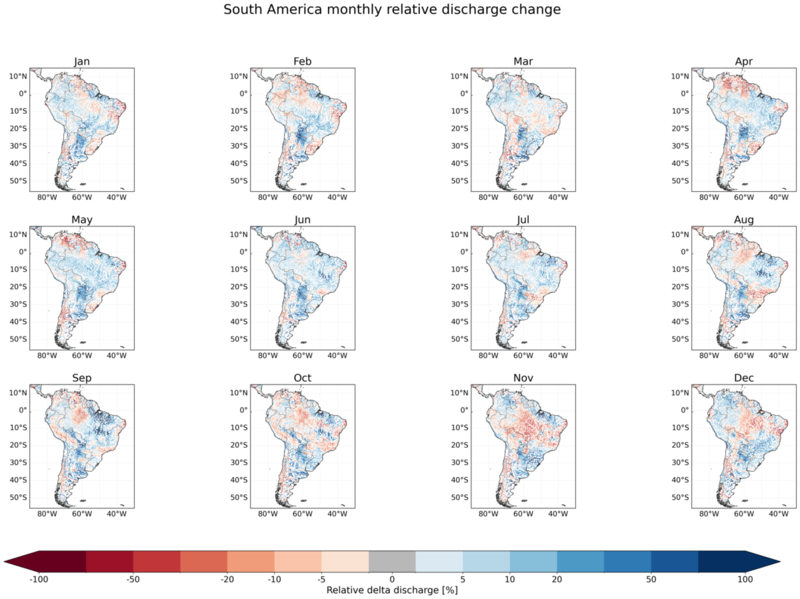
Monthly relative river-discharge climatology change over South America.
Africa
Meteorology
Africa becomes generally wetter and substantially warmer, but the response is strongly regional and seasonal. Relative precipitation increases are most pronounced over the Sahel, northern Africa, and parts of eastern and southern Africa. Temperature increases are widespread, typically around 1–3 K, with the strongest warming over the Sahara, northern Africa, and southern Africa.
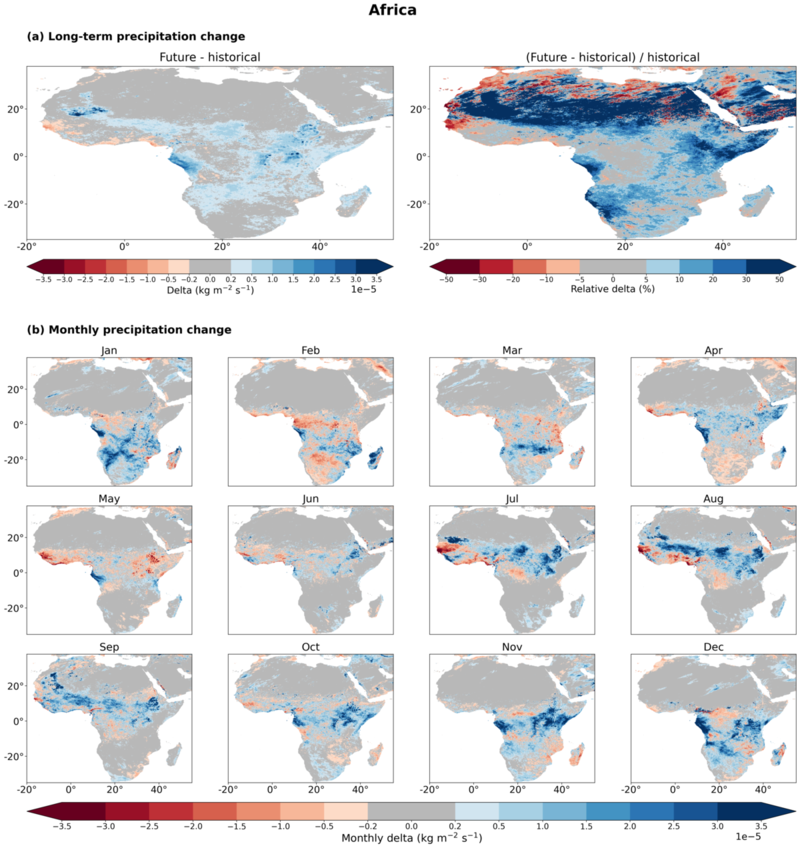
Projected precipitation change over Africa.
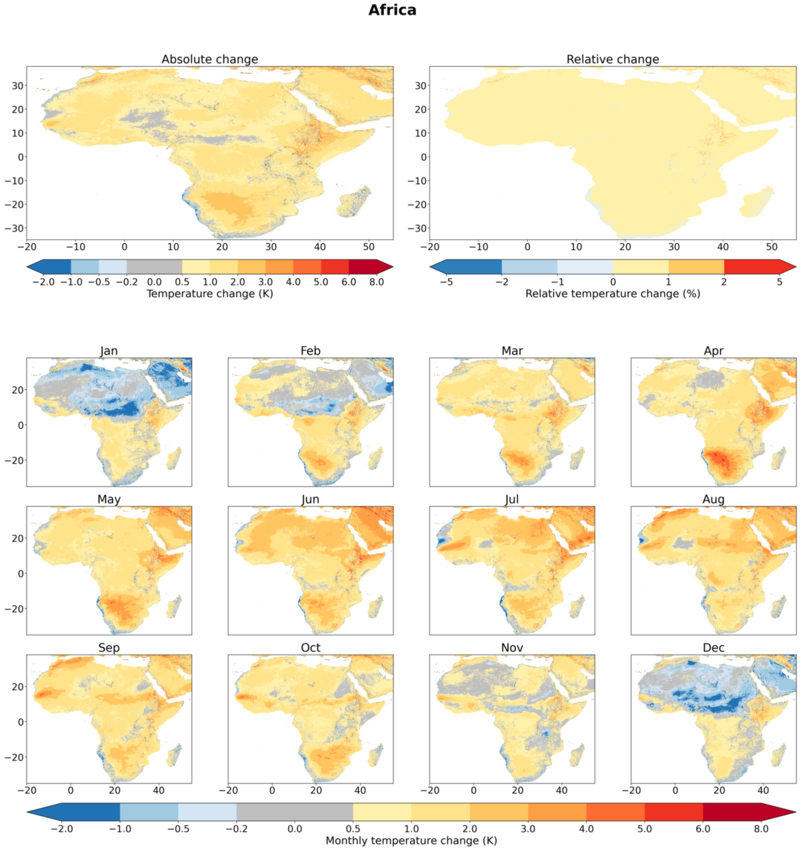
Projected near-surface temperature change over Africa.
Evapotranspiration
Projected ET increases are widespread across tropical and southern Africa, with the most structured changes following the wet seasonal belt and the eastern African highlands. The monthly local-change panel shows that these ET increases vary strongly with the seasonal migration of rainfall and temperature.
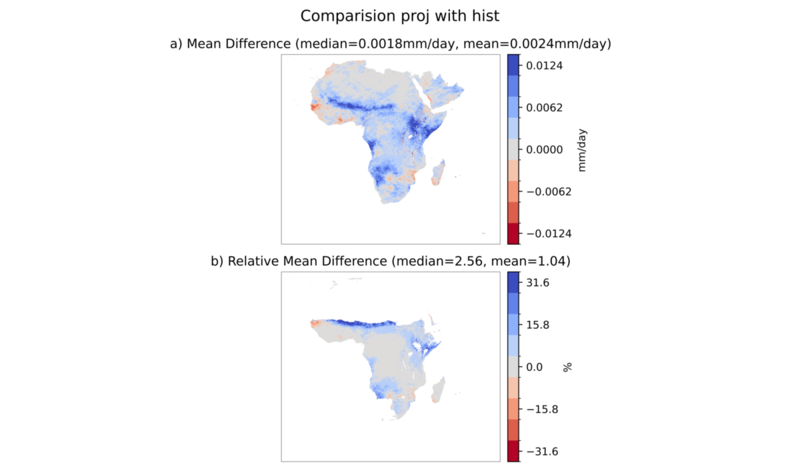
Regional HydroLand actual evapotranspiration change for Africa, shown as absolute and relative long-term mean differences.
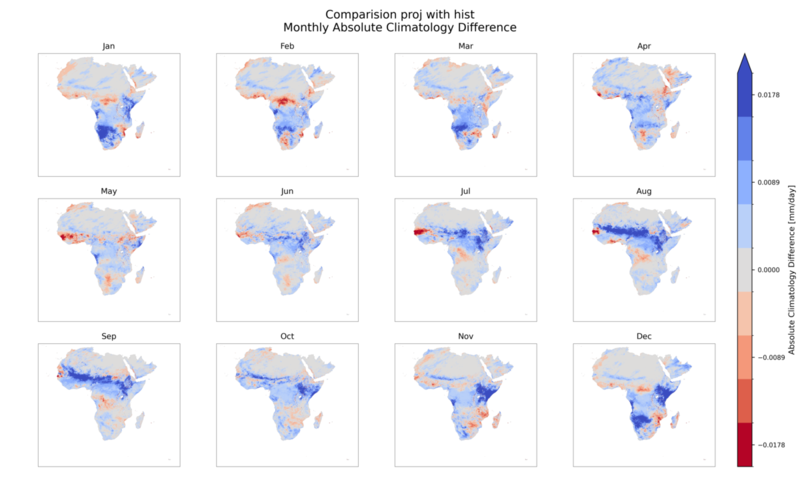
Monthly local absolute HydroLand actual evapotranspiration change for Africa.
River Discharge
African discharge changes are spatially heterogeneous but modest in the long-term mean. West African rivers tend to gain through enhanced monsoon precipitation, whereas southern African rivers mostly lose discharge. Across much of the continent, warming increases evapotranspiration demand and reduces the runoff response even where precipitation increases.
The monthly panels show the clearest positive changes in West Africa during the core monsoon season. The relative-change view highlights the sharp contrast between monsoon gains in the Sahel and persistent losses in subtropical southern Africa.
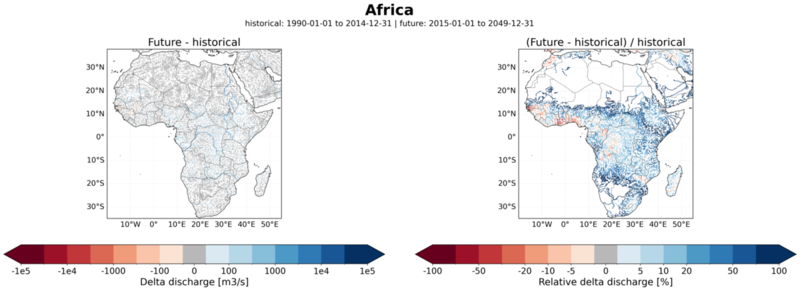
Long-term absolute and relative river-discharge change over Africa.
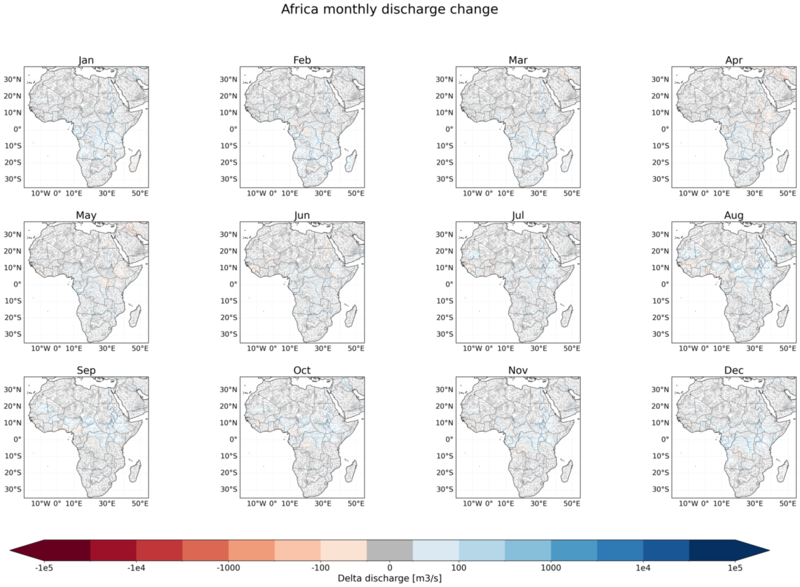
Monthly absolute river-discharge climatology change over Africa.
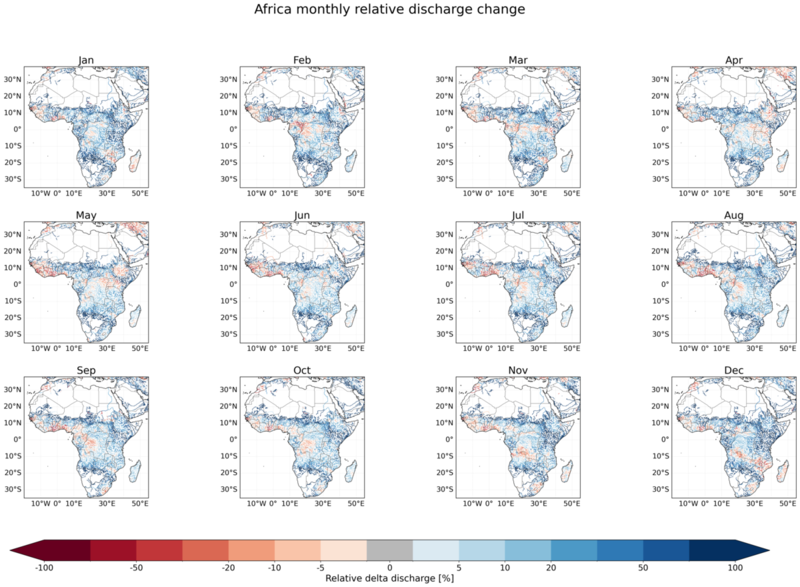
Monthly relative river-discharge climatology change over Africa.
Europe
Meteorology
Projected precipitation changes over Europe are moderate in the long-term mean, with wetter conditions mainly in northern Europe and western Russia and drying tendencies across southern and southeastern Europe. Temperature changes indicate overall warming, typically between about 0.2 and 2 K, but the seasonal signal is more differentiated: southern and southeastern Europe warm strongly in summer, while parts of western, central, and northern Europe show weak cooling signals in late spring and early summer.
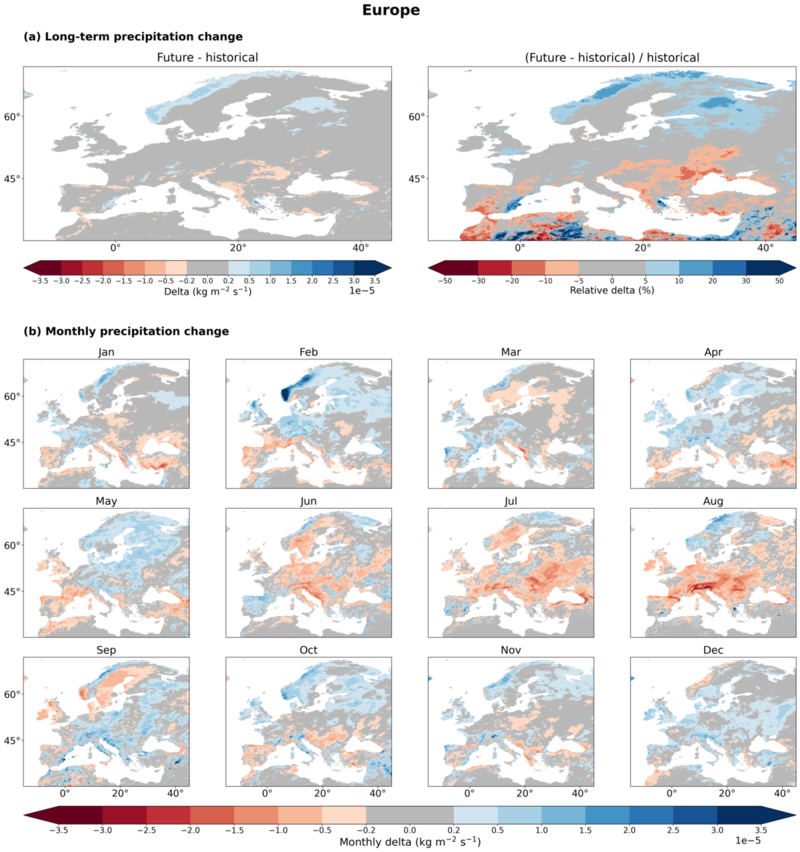
Projected precipitation change over Europe.
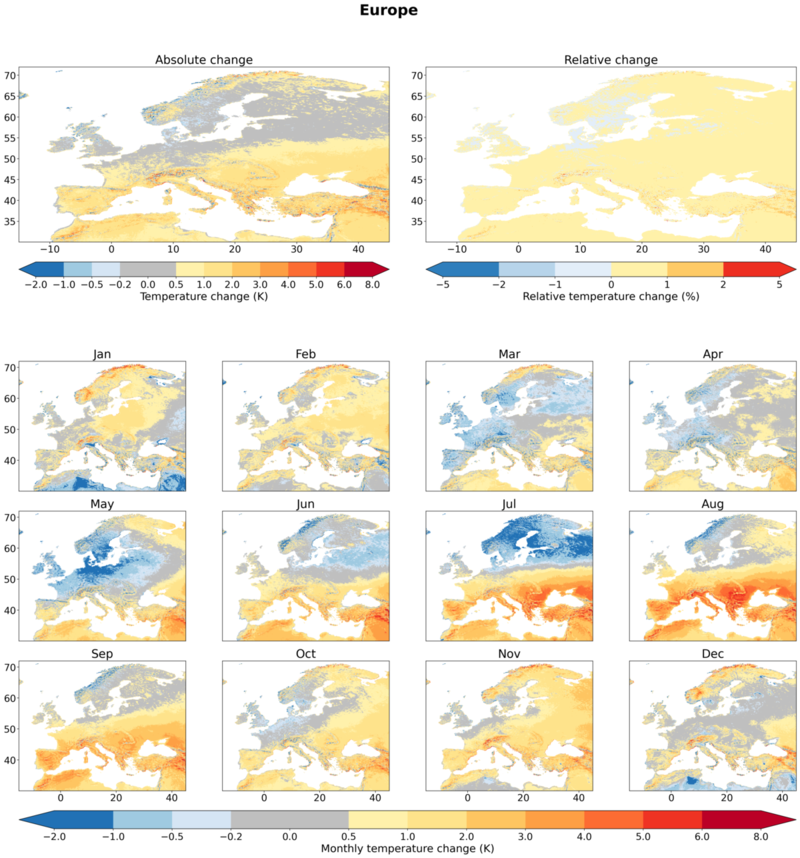
Projected near-surface temperature change over Europe.
Evapotranspiration
The ET figures show a mixed European response, with decreases more evident around the Mediterranean and increases or near-neutral behavior across parts of northern Europe. This spatial contrast is consistent with the combination of drier southern summers, stronger southeastern warming, and cooler late-spring conditions in parts of central and northern Europe.
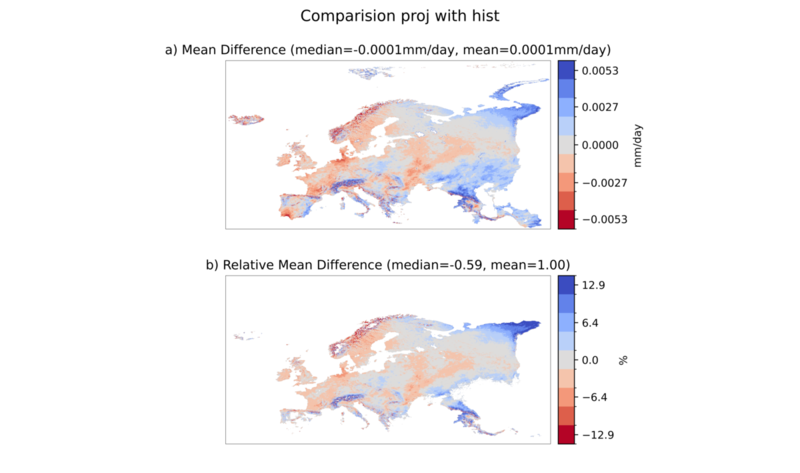
Regional HydroLand actual evapotranspiration change for Europe, shown as absolute and relative long-term mean differences.
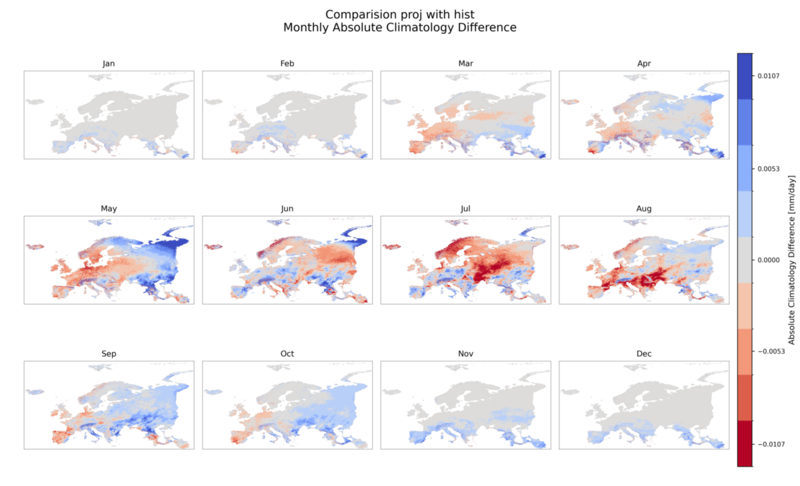
Monthly local absolute HydroLand actual evapotranspiration change for Europe.
River Discharge
European discharge changes show a small continental mean but a strong spatial contrast. Southwestern rivers decline where reduced precipitation and stronger summer warming amplify evapotranspiration losses. Scandinavian rivers gain slightly, and several Alpine-fed basins show a seasonal redistribution rather than a strong long-term mean change.
The monthly panels show that temperature strongly shapes the seasonal pattern. Positive Alpine anomalies appear from late spring to summer, when warming advances and intensifies melt, while the largest losses in southwestern Europe occur during the dry and warm summer season.
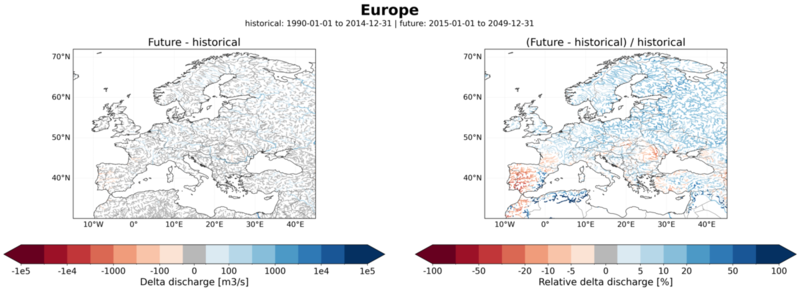
Long-term absolute and relative river-discharge change over Europe.
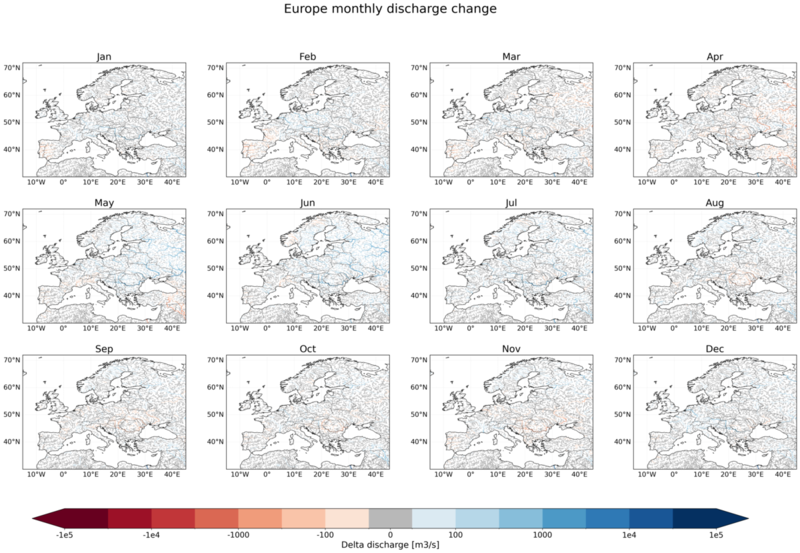
Monthly absolute river-discharge climatology change over Europe.
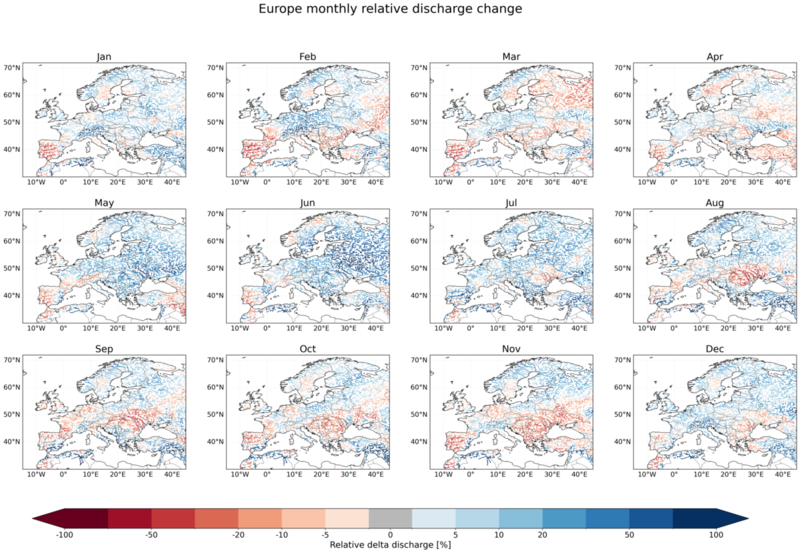
Monthly relative river-discharge climatology change over Europe.
Asia
Meteorology
Asia shows strong regional contrasts shaped by monsoon systems, continental circulation, and complex topography. Long-term precipitation increases dominate across South Asia, eastern China, and parts of Southeast Asia, while relative changes are also large in arid and semi-arid parts of western China, Central Asia, and the Middle East. Temperature increases are robust across nearly the whole continent and become especially strong over Central Asia, the Tibetan Plateau, and the Himalayan region.
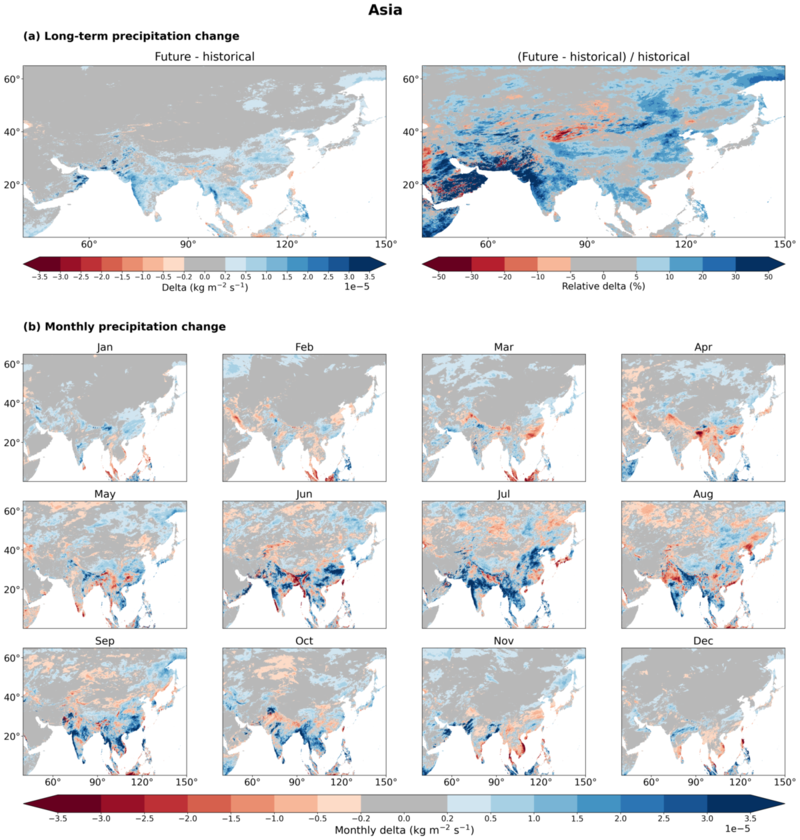
Projected precipitation change over Asia.
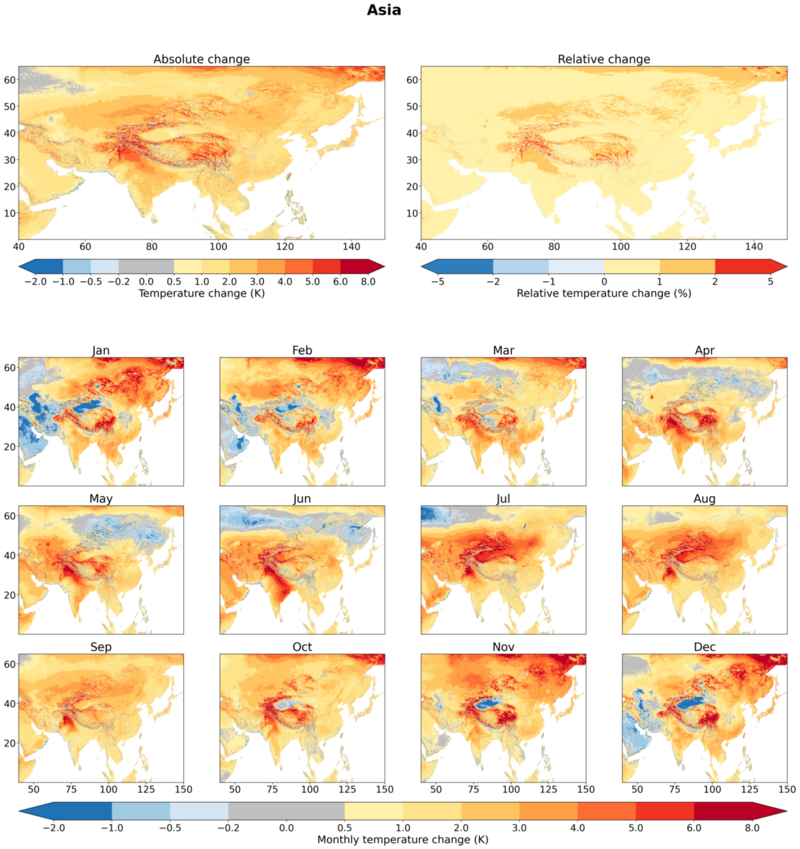
Projected near-surface temperature change over Asia.
Evapotranspiration
Projected ET increases are widespread across South Asia, the Himalayan foothills, and large parts of East and Southeast Asia, while smaller or more mixed changes remain over arid interiors. The regional ET maps provide the process context for the very strong future discharge response in snow- and glacier-fed Asian basins.
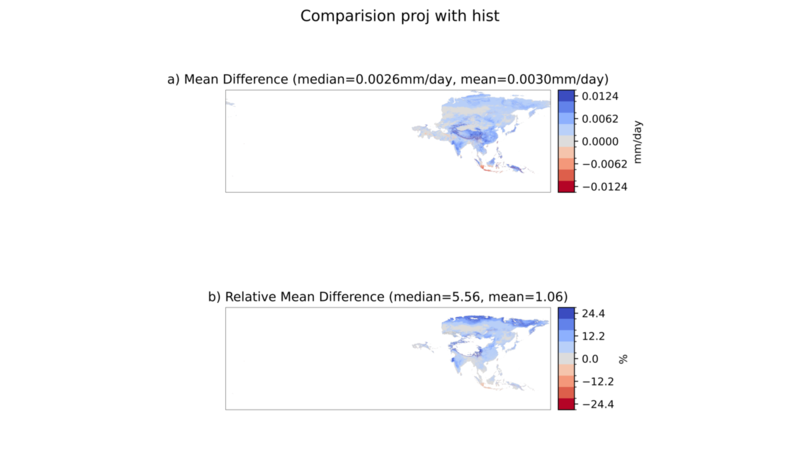
Regional HydroLand actual evapotranspiration change for Asia, shown as absolute and relative long-term mean differences.
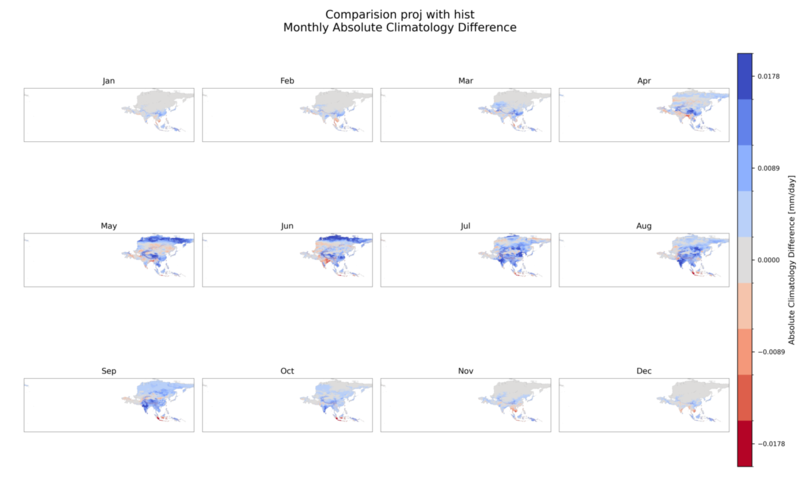
Monthly local absolute HydroLand actual evapotranspiration change for Asia.
River Discharge
Asia shows the strongest projected discharge response of all evaluated regions. The largest gains occur in rivers draining the Tibetan Plateau and Himalayas, where extreme warming accelerates snow and glacier melt. Indian rivers also gain, but there the driver is mainly monsoon intensification. By contrast, several Central Asian rivers lose discharge because warming removes seasonal snow storage without a compensating precipitation increase.
The monthly panels show the Himalayan melt signal peaking in boreal summer, while the monsoon-driven Indian response is strongest from June to September. The relative-change panel also indicates that the meltwater-driven gains are likely to be a transient early-century response.
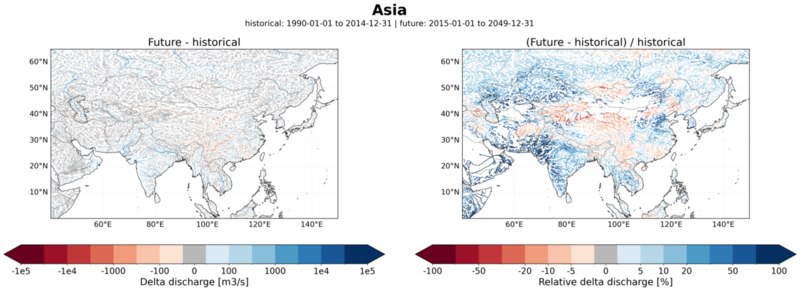
Long-term absolute and relative river-discharge change over Asia.
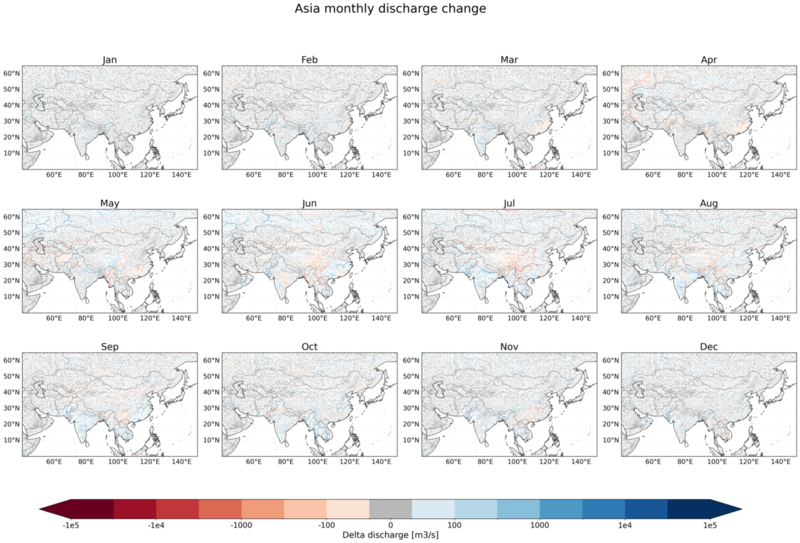
Monthly absolute river-discharge climatology change over Asia.
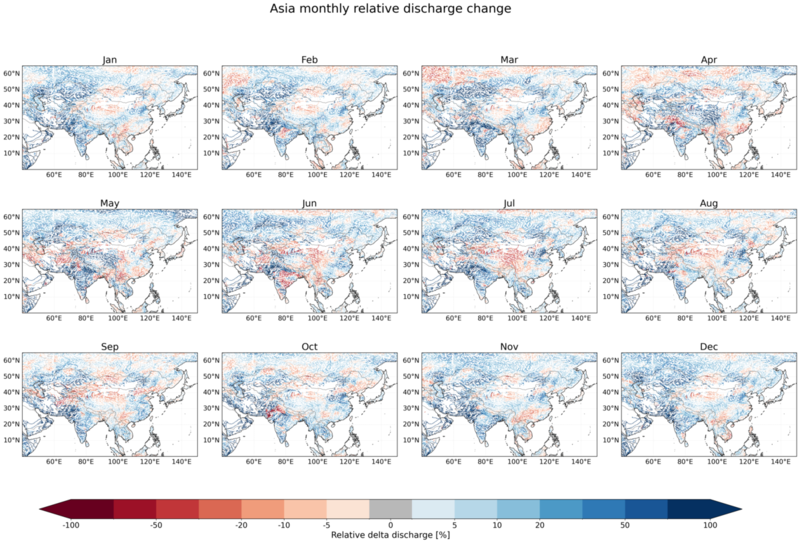
Monthly relative river-discharge climatology change over Asia.
Oceania
Meteorology
Within the currently available projection material, the Oceania assessment is centred on Australia and nearby islands. Precipitation changes are moderate in the long-term mean and strongly seasonal, with wetter conditions during austral summer in northern and eastern regions and more persistent drying across southern and western Australia. Temperature changes are more coherent, with general warming of around 1–3 K and stronger summer warming over inland Australia.
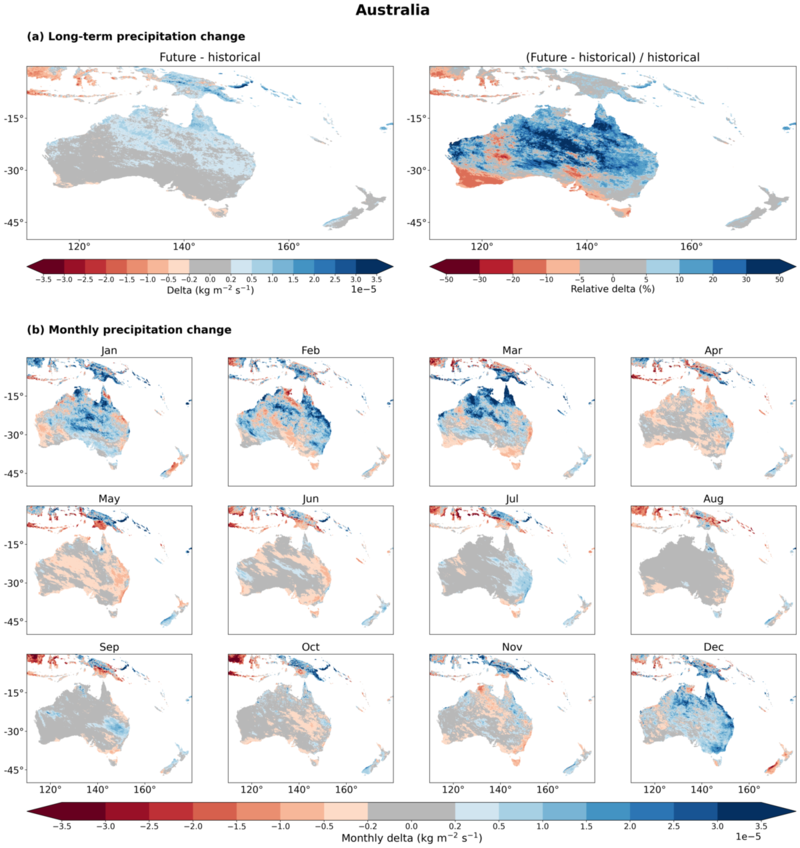
Projected precipitation change over Oceania, centred on Australia.
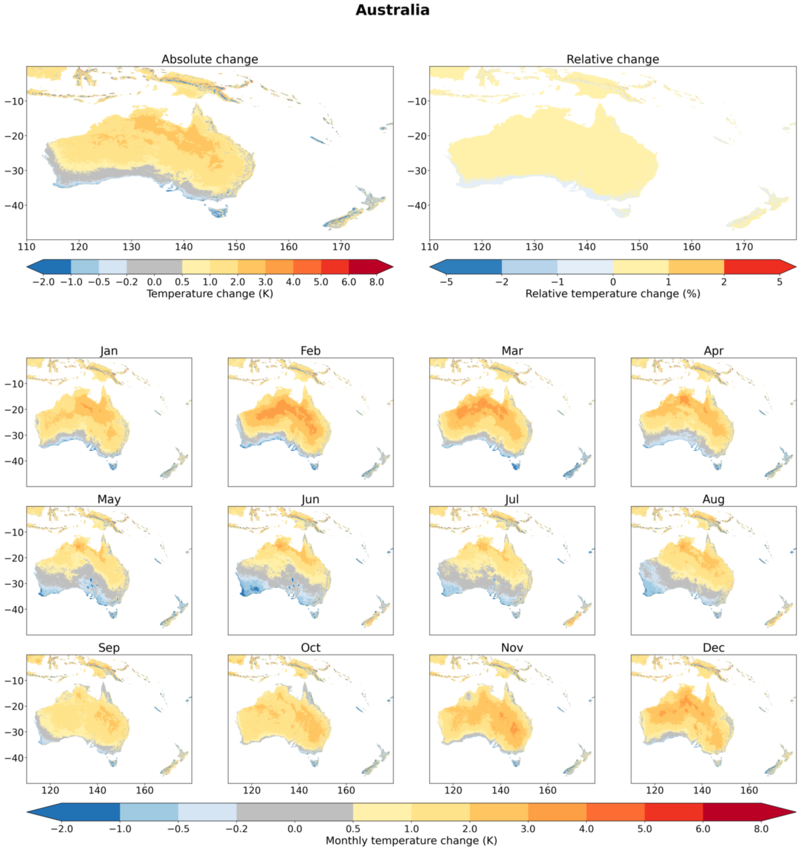
Projected near-surface temperature change over Oceania, centred on Australia.
Evapotranspiration
The ET figures indicate that much of the region experiences small to moderate changes in long-term actual evapotranspiration, but the seasonal local maps show how warming offsets part of the wet-season precipitation gains. This is an important control on the near-universal future discharge decreases across the region.
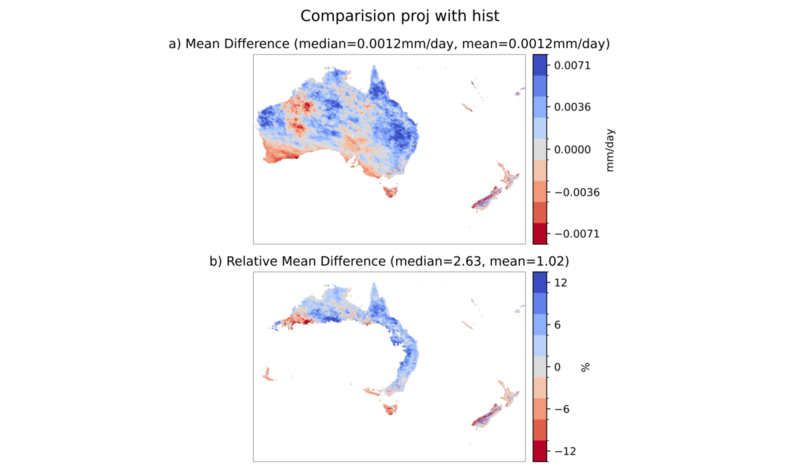
Regional HydroLand actual evapotranspiration change for Oceania, centred on Australia, shown as absolute and relative long-term mean differences.
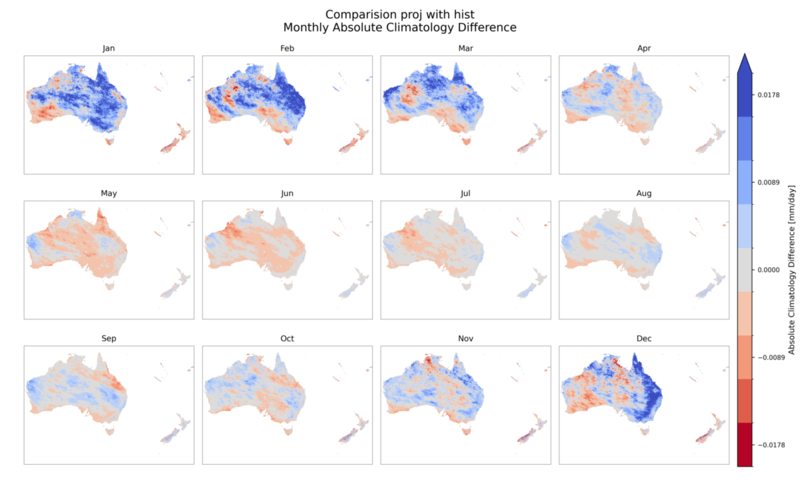
Monthly local absolute HydroLand actual evapotranspiration change for Oceania, centred on Australia.
River Discharge
Oceania shows the most spatially coherent future discharge reduction of any evaluated region. The strongest losses occur over the Murray-Darling basin, where precipitation drying and higher evapotranspiration demand act in the same direction. Northern catchments do not compensate through stronger runoff, because warming returns a larger fraction of rainfall to the atmosphere.
The monthly panels show that this negative signal is robust across the full year. In the supplied projection material, no season or major Australian region shows a sustained positive discharge response.
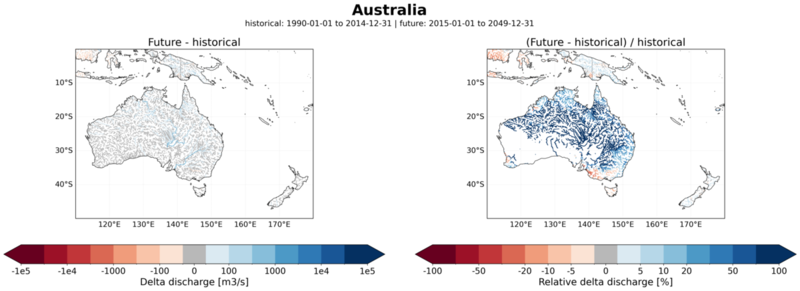
Long-term absolute and relative river-discharge change over Oceania, centred on Australia.
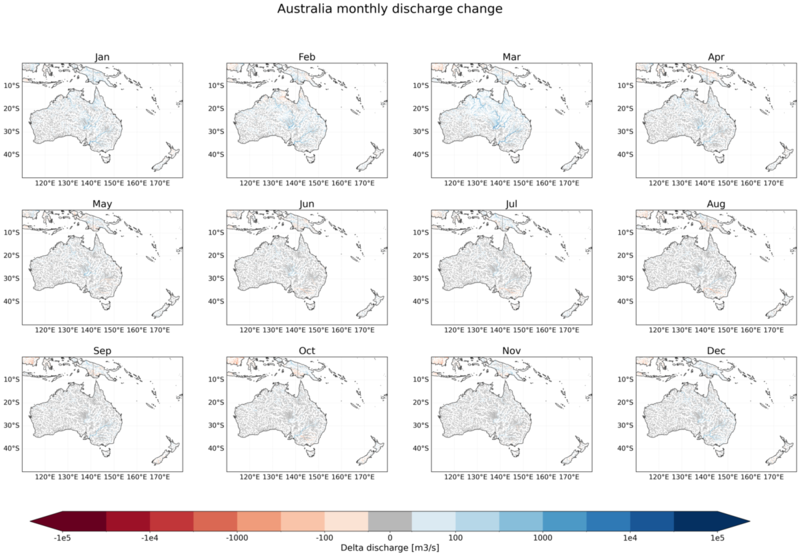
Monthly absolute river-discharge climatology change over Oceania, centred on Australia.
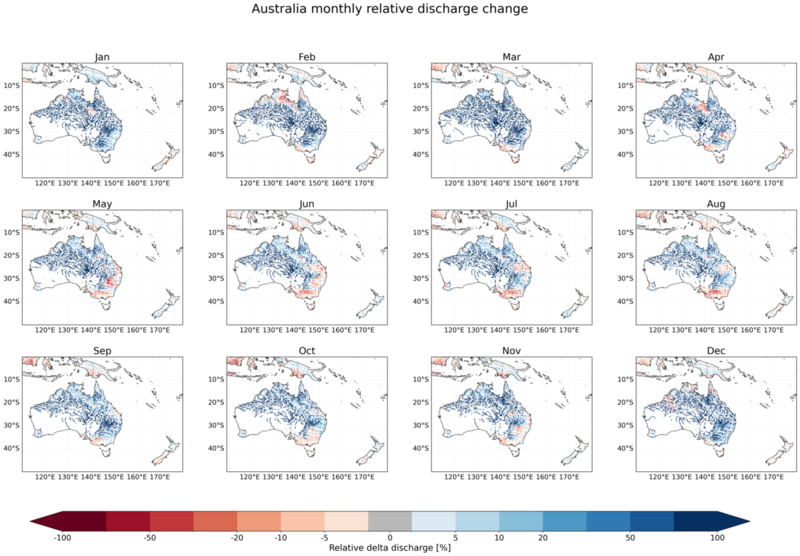
Monthly relative river-discharge climatology change over Oceania, centred on Australia.
Projection summary and conclusion
The IFS-NEMO projection analysis shows that future HydroLand changes are driven by different combinations of precipitation and temperature depending on region. Monsoon intensification tends to increase discharge in South Asia and parts of Africa, while snow- and glacier-fed basins in Asia, Europe, and high-latitude North America respond strongly to warming-driven melt. The strongest negative discharge signals appear where drying and higher evaporative demand align, notably in Australia, the southwestern part of North America, southern Africa, Mediterranean Europe, and southern South America.
Across the evaluated continents, the projection figures also show that future hydrological change cannot be inferred from precipitation alone. Temperature changes alter evapotranspiration, snow storage, and glacier melt, and in many regions these controls either amplify or offset the runoff response expected from precipitation change by itself. These process interactions should be kept in mind when interpreting future HydroLand outputs and the indicator products that will follow from them.