ICON
ICON’s precipitation performance is strongest in the northern midlatitudes, particularly in summer. As HydroMet focuses on extreme precipitation events in Europe, which predominantly occur in summer, this regional strength increases confidence in HydroMet’s results for the target domain. A systematic evaluation against CMIP6 models is presented here in this user guide.
However, all the evaluations shown here concentrate on averaged and aggregated values. To assess the quality of HydroMet’s results, the analysis should be carried out at a resolution close to the native grid size and at hourly resolution, as extreme events operate on these scales.
In the following, we present HydroMet’s specific evaluation with data from the historical and projection periods. Reference datasets are GPEX [Gründemann et al., 2023] for Europe and KOSTRA [Shehu et al., 2023] for Germany. HydroMet quantifies the statistical strength of extreme precipitation events across many combinations of duration and return time. Here, we limit the comparison to events with a return time of 20 years and a duration of 3 hours because this combination is available across all datasets and represents an exemplary middle ground between long and short return periods. Comparing all combinations shows that this combination is well representative.
Historical
The figure below depicts the strength of extreme precipitation events with a return time of 20 years and a duration of three hours of ICON data divided by the KOSTRA dataset. Overall, there is a good agreement, especially in the eastern part of the country. However, there are large regions where the strength of extreme events is overestimated, despite KOSTRA having a longer timeseries (up to 70 years), which normally leads to stronger events. Therefore, results from ICON represent the upper bound of possible extreme precipitation strength.
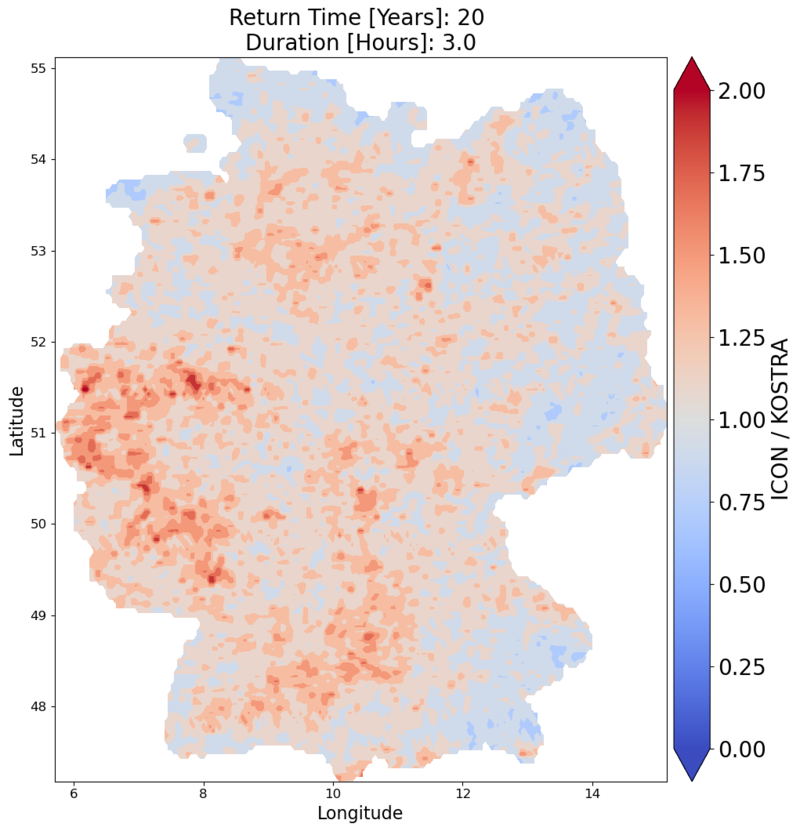
The strength of extreme precipitation events over Germany with a return time of 20 years and a duration of three hours. ICON data divided by KOSTRA data (ratio without unit).
To evaluate further on a continental scale, results are compared to GPEX on a European level in the next figure. The HydroMet results from ICON show widespread areas with more than twice the strength as in GPEX. The comparison highlights the main difference between the results from ICON and those from the other models in Climate DT: IFS-FESOM and IFS-NEMO. The strongest precipitation is found in short local events, which improves compatibility with local gauge-based datasets such as KOSTRA. In return, the agreement to datasets like GPEX that do not capture these small time scales is much worse. Therefore, ICON can still serve as an upper limit for extreme events that align well with very local observational datasets such as KOSTRA, but requiring careful interpretation when compared with coarser-resolution datasets at larger spatial or temporal scales.
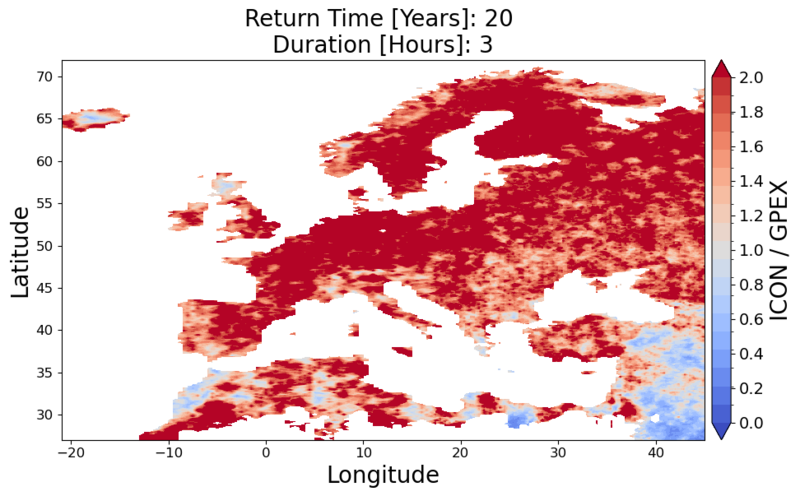
The strength of extreme precipitation events over Europe with a return time of 20 years and a duration of three hours. ICON data divided by GPEX.
Projection
By establishing confidence in historical results, the ICON projection can indicate a potential climate change signal. The figure below presents the precipitation amount of extreme events with a return time of 20 years and a duration of three hours dividing the projection by the historical results. KOSTRA results with these return time and duration have an average uncertainty of 20%. Therefore, changes smaller than 20 % are masked out. The results are very uniform across the entire domain, with significant increases in precipitation intensity. Eastern Europe and the Balkans are especially pronounced, with an increase of up to 80%.
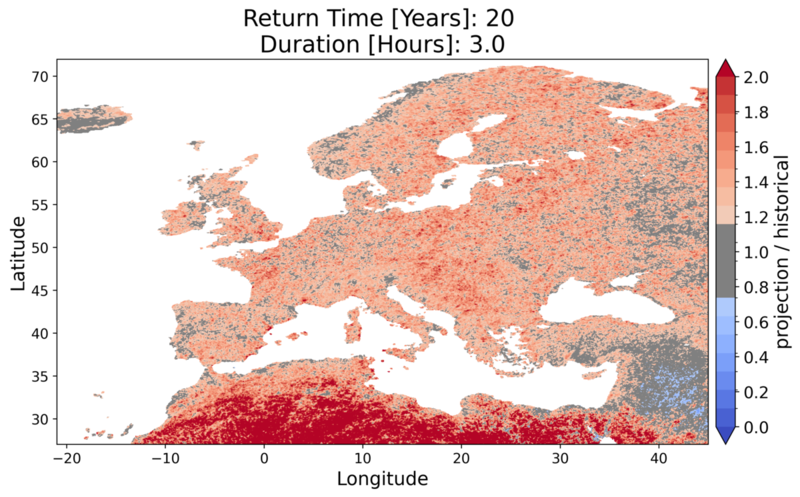
Ratio of projected and historical modelled extreme precipitation rate as climate change signal for extreme events of a 20 year return period and three hour duration (ratio without unit)
The next figure gives an aggregated overview of all events captured over Europe during the complete simulation period. The number of captured events is four times higher than in the other IFS-based results in Climate DT, underlining that ICON models many small-scale events in summer. Therefore, the widespread increase in extreme precipitation intensity is not directly reflected in event numbers, as there are already many events in the historical period. Nevertheless, the projection shows the overall highest peak at the end of the simulation.
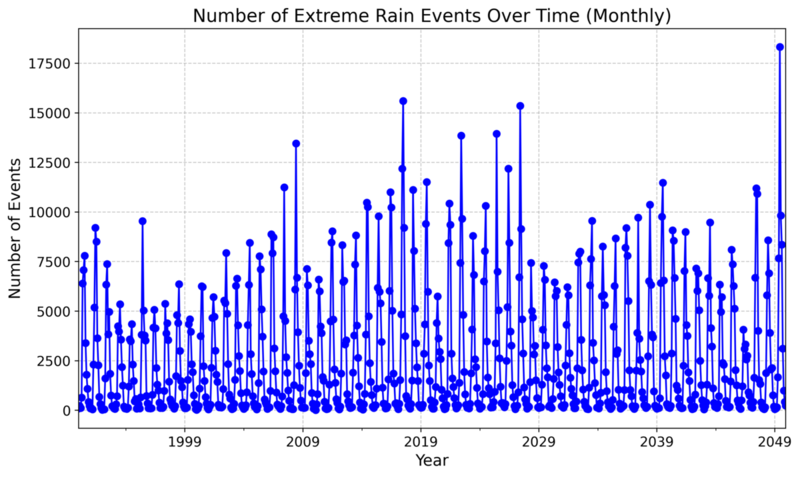
Number of all monthly captured events over Europe during the whole simulation period.