Canadian Forest Fire Weather Index for IFS-NEMO
Historical
The Canadian Forest Fire Weather Index (FWI) is derived from the IFS-NEMO coupled simulations (0.05° × 0.05°) for the historical period (1994–2014) (hereafter hist). These have been evaluated against reference datasets. ERA5 (0.25° × 0.25°) is used as the main reference dataset (hereafter ref), and ERA5-Land is used where land-only, higher-resolution context is useful. ERA5 and ERA5-Land are reanalysis products rather than direct observations, so differences should be interpreted as model-to-reference differences rather than absolute errors.
The following statistical metrics derived from FWI have been compared with ERA5-derived values:
Bias metrics:
Bias in FWI climatology (1994–2014) from IFS-NEMO relative to ERA5, shown for the mean, minimum, maximum, median (P50), and upper percentiles (P95, P99)
Bias in the annual number of days assigned to European Forest Fire Information System (EFFIS) fire danger categories: Very Low < 5.2, Low 5.2–11.2, Moderate 11.2–21.3, High 21.3–38.0, Very High 38.0–50.0, Extreme 50.0–70.0, and Very Extreme > 70.0
Seasonal cycle of FWI over Europe
Trends in June–September seasonal mean FWI over Europe
Climatological Bias in FWI
Globally, IFS-NEMO shows a strong and widespread overestimation of fire weather conditions across nearly all regions, including tropical, subtropical, and temperate zones. The positive bias is particularly pronounced in Africa, South America, South Asia, Australia, and large parts of North America and Eurasia, indicating a systematic overestimation of both average and high fire weather conditions. Most high-latitude regions also exhibit positive biases, especially in high-percentile (P95, P99). In Europe, biases are consistently positive across the entire domain, with the strongest overestimation occurring in southern and southeastern regions, including the Mediterranean. Both typical (P50) and high-percentile (P95, P99) fire weather conditions are overestimated across most of the continent, while even northern Europe shows moderate positive biases. These results suggest that IFS-NEMO exhibits a systematic and nearly global overestimation of baseline and extreme fire danger conditions, with little evidence of negative biases in cooler climates. Some high-latitude and ice-margin signals, including fire danger around the edge of Antarctica, should be treated cautiously. FWI is driven by meteorological conditions and does not include vegetation, fuel continuity, ignition sources, or land-cover constraints, so physically implausible fire risk can appear in regions where combustible fuel is absent or highly limited.
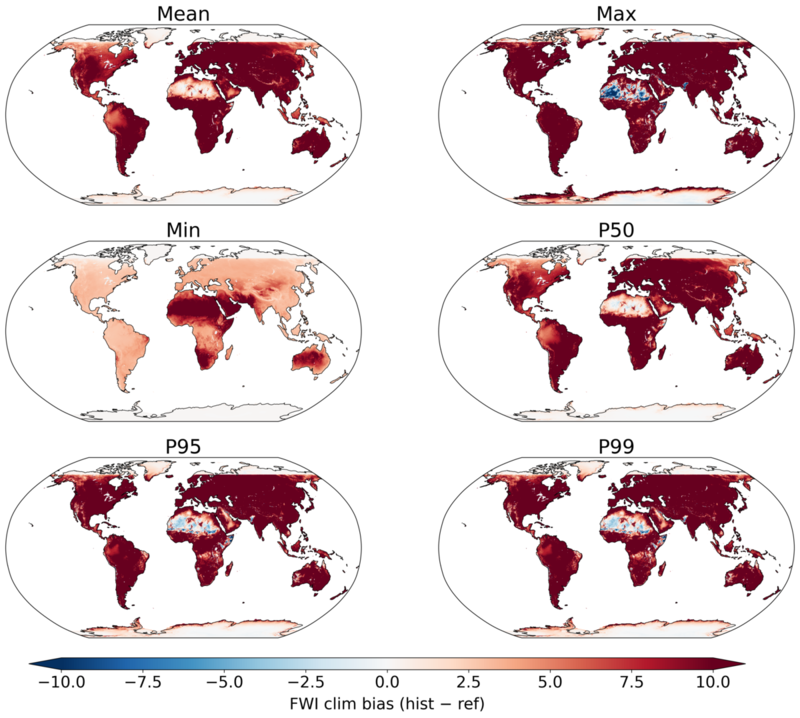
Figure 1. Bias in FWI climatology (1994–2014) from IFS-NEMO relative to ERA5. Shown are the mean, minimum, maximum, median (P50), and upper percentiles (P95, P99).
Bias in Fire Danger Classes
The European Forest Fire Information System (EFFIS) fire danger classes translate continuous FWI values into operational fire danger categories, making threshold exceedances easier to compare across regions. The categories used here follow the EFFIS/CEMS classification:
Very Low: FWI < 5.2
Low: 5.2 <= FWI < 11.2
Moderate: 11.2 <= FWI < 21.3
High: 21.3 <= FWI < 38.0
Very High: 38.0 <= FWI < 50.0
Extreme: 50.0 <= FWI < 70.0
Very Extreme: FWI > 70.0
Further information on the EFFIS fire danger classification is available from the EFFIS fire danger forecast technical background and the Copernicus Fire Weather Index dataset description. Biases in the number of days falling into these categories were evaluated as the difference between model and reference (model - reference). Results show that IFS-NEMO exhibits a strong negative bias in very low fire danger days across most regions, indicating a substantial reduction in the length of the low fire danger season, and a pronounced positive bias in low to extreme fire danger days. The increase is particularly widespread and consistent for moderate, high, very high, and extreme categories across Africa, South America, South Asia, Australia, and large parts of North America and Eurasia. In Europe, very low fire danger days are strongly underestimated across the entire domain, while moderate to extreme fire danger days show a clear positive bias, with the strongest increases in southern and southeastern regions, including the Mediterranean. High-latitude regions also exhibit positive biases in moderate and high fire danger conditions, although some localised negative biases remain. Overall, IFS-NEMO shows a clear upward shift in the distribution of fire danger categories globally, with a systematic decrease in low fire danger days and a widespread increase in higher fire danger conditions.
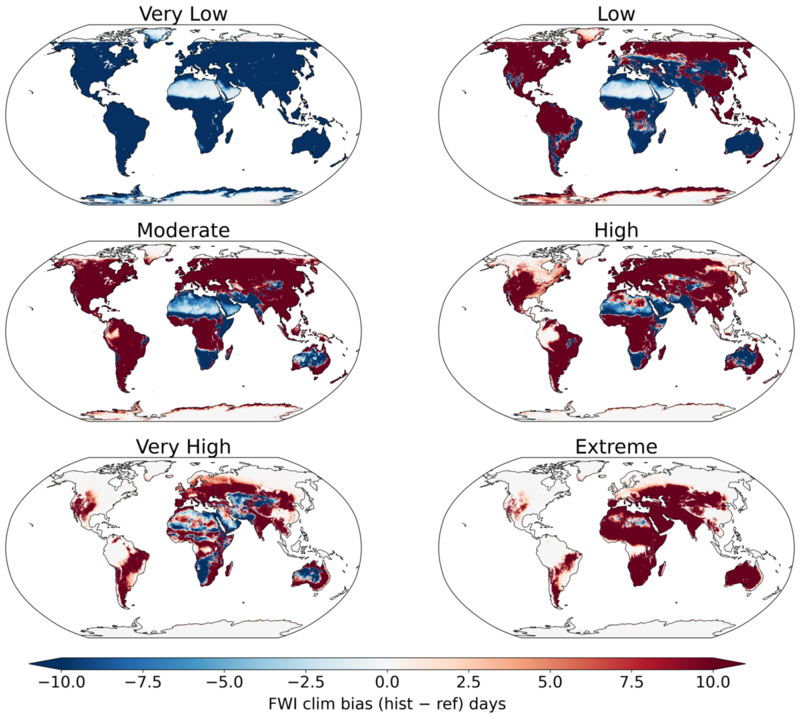
Figure 2. Bias in FWI climatology (1994–2014) from IFS-NEMO relative to ERA5, shown for EFFIS fire danger classes (Very Low–Extreme).
Seasonal Cycle
The seasonal cycle of FWI averaged over Europe shows that both IFS-NEMO and ERA5 capture a consistent annual progression of fire danger, with low values in winter, increasing through spring, and peaking in summer. However, IFS-NEMO exhibits a strong and persistent positive bias throughout the year, with substantially higher mean and upper-percentile values compared to ERA5 in all seasons. The largest differences occur during the summer peak (June–September), where IFS-NEMO strongly overestimates both the mean and the 90th percentile, indicating an overestimation of high fire weather conditions by the model. In addition, the bias is already evident during winter and spring, where IFS-NEMO simulates elevated baseline fire danger relative to ERA5. Overall, while the seasonal timing and shape of the annual cycle are well captured, IFS-NEMO systematically overestimates fire weather conditions across the entire year, with particularly large deviations during the main fire season and a clear upward shift in both mean and variability.
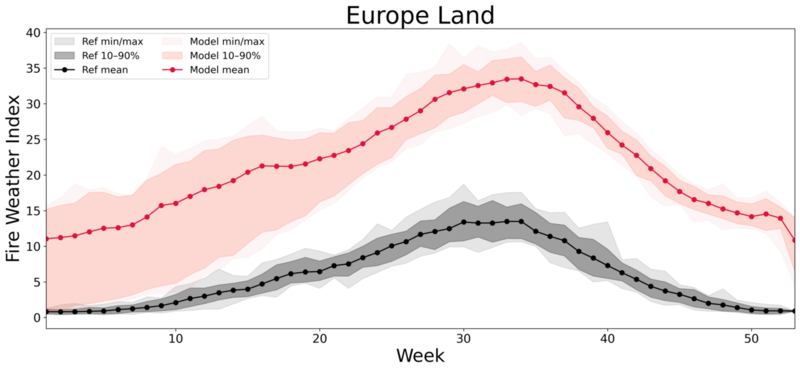
Figure 3. Seasonal cycle of the FWI over European land areas for 1994–2014, comparing IFS-NEMO simulations (red) with the ERA5 reference dataset (black). Weekly means are shown together with the 10th–90th percentile range and minimum–maximum envelope.
Trends in Fire Season FWI
The evaluation of June–September seasonal mean FWI over 1994–2014 shows that ERA5 has a robust upward trend of +0.73 units per decade, reflecting observed intensification of fire weather conditions. IFS-NEMO also reproduces the increasing tendency but at a substantially stronger rate of +1.41 units per decade, indicating it captures the direction of change but overestimates the magnitude of the observed trend. IFS-NEMO exhibits a strong systematic positive bias in mean FWI throughout the entire period, indicating a consistent overestimation of baseline fire danger conditions, while simultaneously amplifying the rate of intensification compared to the reference.
When estimating differences relative to ERA5-Land, resolution should also be considered. IFS-NEMO is produced at 0.05° × 0.05°, while ERA5-Land is available at approximately 9 km and is forced by ERA5 meteorology. Higher spatial resolution can represent sharper land-surface gradients and small-scale weather features more explicitly, but it can also produce more spatially fragmented high-FWI areas and may resolve more small high-danger patches than a coarser product. ERA5-Land also has caveats: it is not a direct observational dataset, it inherits uncertainty from ERA5 forcing fields, and it is most informative over land. Therefore, apparent overestimation relative to ERA5-Land should be interpreted alongside differences in resolution, forcing, land masking, and reanalysis uncertainty, not only as an IFS-NEMO model error.
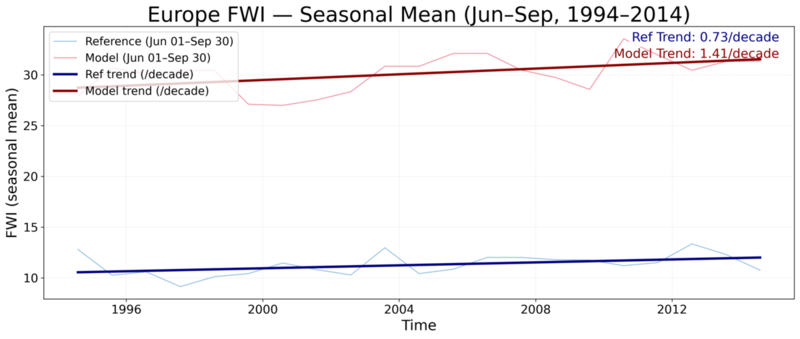
Figure 4. Seasonal mean Fire Weather Index (FWI) over European land areas during the main fire season (June–September) for the period 1994–2014, comparing IFS-NEMO simulations (red) with the ERA5 reference dataset (blue). Thin lines show interannual variability, while bold lines indicate linear trends.
Strengths and Limitations
Strengths
Captures the overall spatial and seasonal patterns of fire danger across Europe and globally.
Reproduces the seasonal cycle well, including the timing of onset, peak, and decline of the fire season.
Reproduces the direction of long-term trends in fire weather over Europe.
Provides kilometre-scale global output, which supports analysis of regional gradients and spatial patterns that are not visible in coarser products.
Limitations
Shows a strong tendency toward higher baseline fire danger across most regions, with widespread positive biases.
Overestimates both average and high fire danger conditions, including a higher occurrence of moderate to extreme fire danger classes in fire-prone regions (e.g., Mediterranean, Africa, South Asia, and Australia).
Exhibits a substantial reduction in very low fire danger days, indicating a shorter low-risk season.
Tends to overestimate the magnitude of intensification in long-term trends compared to the reference.
Can show potentially unphysical fire danger in regions with little or no burnable vegetation, such as ice margins and polar areas, because FWI represents meteorological fire weather rather than realised fire risk.
Should be interpreted with the wider caveats described in Data Description, especially the absence of explicit vegetation, fuel, ignition, suppression, and human-exposure information.
User Guidance for IFS-NEMO Climate DT FWI Indicators
The IFS-NEMO FWI indicators are most suitable for analysing spatial patterns, seasonal cycles, relative changes, anomalies, and the direction of long-term change. Users should apply caution when interpreting absolute FWI values or the absolute number of days in EFFIS fire danger classes, because IFS-NEMO shows a systematic positive bias relative to ERA5 and ERA5-Land across many regions. The indicators should be understood as meteorological fire danger, not as realised wildfire probability, and should be combined with local information on vegetation, fuels, ignition sources, land management, and exposure when used for impact assessment or decision-making.
Conclusion
Overall, the Climate DT FWI indicators derived from the IFS-NEMO simulation provide a robust representation of spatial and seasonal patterns of fire danger and successfully capture the direction of long-term changes. However, the dataset exhibits a systematic positive bias, with higher baseline fire danger and a widespread increase in moderate to extreme fire danger conditions, along with a reduction in low fire danger days. Additionally, the rate of intensification is stronger than observed in ERA5. Despite these differences, the dataset remains well suited for analysing relative changes, variability, and trends in fire danger under changing climate conditions.