IFS-FESOM
Output of IFS-FESOM performs well compared to the mean of CMIP6 models (shown here), especially in terms of precipitation, which is important for HydroMet’s outputs. While significant biases are found in the tropics, HydroMet focuses exclusively on Europe, where precipitation performance is better in summer than in winter — further strengthening confidence in HydroMet’s results, as nearly all extreme precipitation events over Europe occur in summer.
However, all the evaluations shown here concentrate on averaged and aggregated values. To assess the quality of HydroMet’s results, the analysis should be carried out at a resolution close to the native grid size and at hourly resolution, as extreme events operate on these scales.
In the following, we present HydroMet’s specific evaluation with data from the historical and projection periods. Reference datasets are GPEX [Gründemann et al., 2023] for Europe and KOSTRA [Shehu et al., 2023] for Germany. HydroMet quantifies the statistical strength of extreme precipitation events across many combinations of duration and return time. Here, we limit the comparison to events with a return time of 20 years and a duration of 3 hours because this combination is available across all datasets and represents an exemplary middle ground between long and short return periods. Comparing all combinations shows that this combination is well representative.
Historical
The figure below depicts the strength of extreme precipitation events with a return time of 20 years and a duration of three hours of IFS-FESOM data divided by the KOSTRA dataset. The original values are in mm while the resulting fraction is dimensionless. Overall, there is a good agreement, especially in the middle and northern parts of the country. HydroMet results mostly underestimate the strength compared to KOSTRA, but this is expected, as KOSTRA has a longer timeseries (up to 70 years). The good agreement with a local high-resolution dataset strengthens confidence in the results’ viability across Germany and Central Europe.
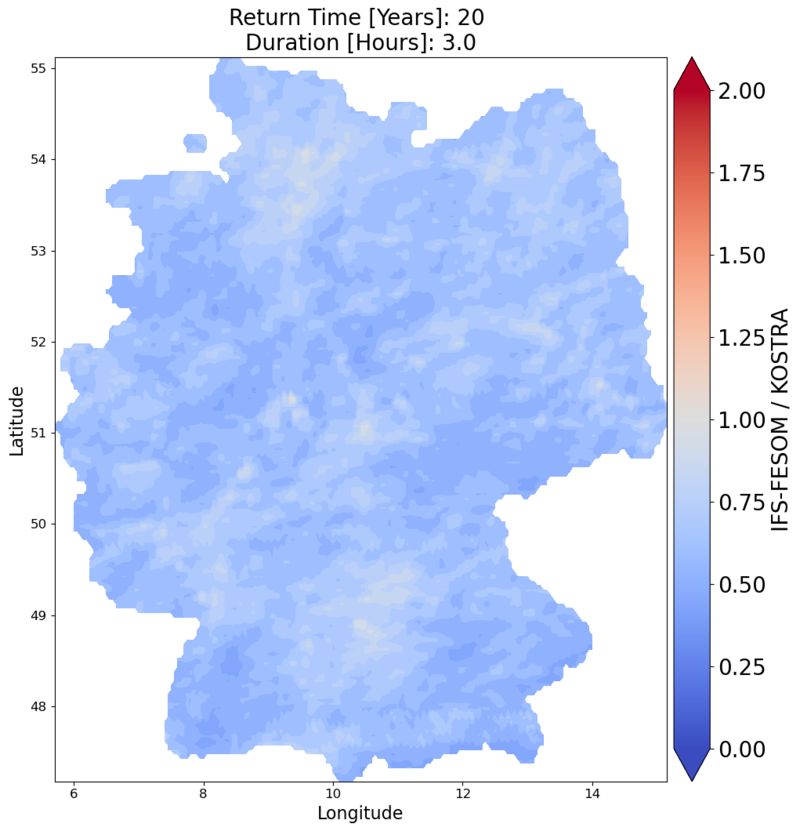
The strength of extreme precipitation events over Germany with a return time of 20 years and a duration of three hours. IFS-FESOM data divided by KOSTRA data (ratio without unit).
To further evaluate the HydroMet results on a continental scale, they are compared to GPEX on a European level in the next figure. There is quite good agreement across large parts of Europe, although Central and Eastern Europe exhibit larger overestimations, while Southern Europe shows underestimations. Notably, GPEX behaves quite differently from KOSTRA across Germany; the extremes are much weaker. This discrepancy can be attributed to GPEX’s lower temporal and spatial resolution, as well as its use of a different data source illustrating that every reference has drawbacks. Despite these limitations, the overall good agreement on a continental level strengthens confidence in the results from the historical period.
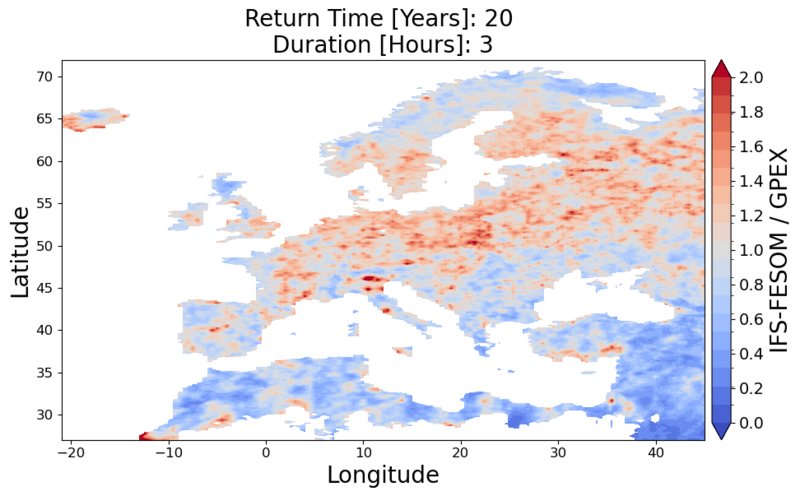
The strength of extreme precipitation events over Europe with a return time of 20 years and a duration of three hours. IFS-FESOM data divided by GPEX (ratio without unit).
Projection
By establishing confidence in historical results, the IFS-FESOM projection can indicate a potential climate change signal. The figure below presents the precipitation amount of extreme events with a return time of 20 years and a duration of three hours dividing the projection by the historical results. KOSTRA results with these return time and duration have an average uncertainty of 20%. Therefore, changes smaller than 20 % are masked out. The precipitation amount of 20‑year 3‑hour extreme events increases are widespread in the Mediterranean, Western and Northern Europe by about 20–80 % in the modelled future.
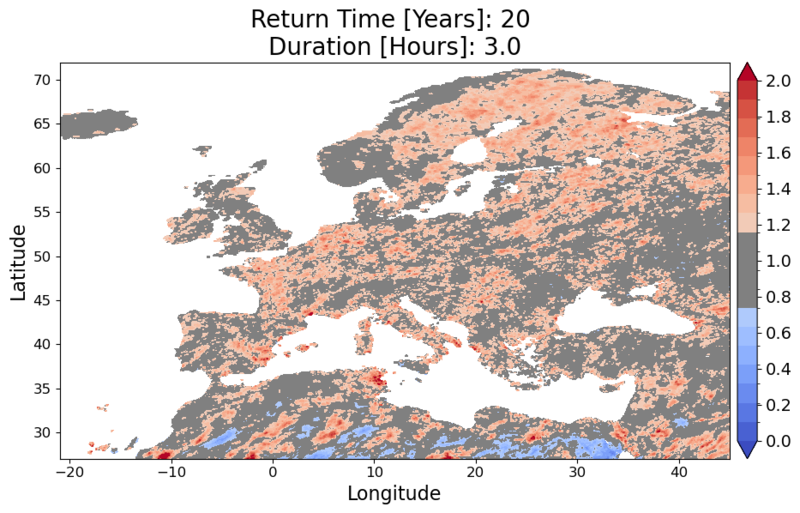
Ratio of projected and historical modelled extreme precipitation rate as climate change signal for extreme events of a 20 year return period and three hour duration (ratio without unit)
The next figure gives an aggregated overview of all events captured over Europe during the complete simulation period. It is evident that the number of captured events is overall stable over the entire period, with slightly higher peaks beginning in 2033.
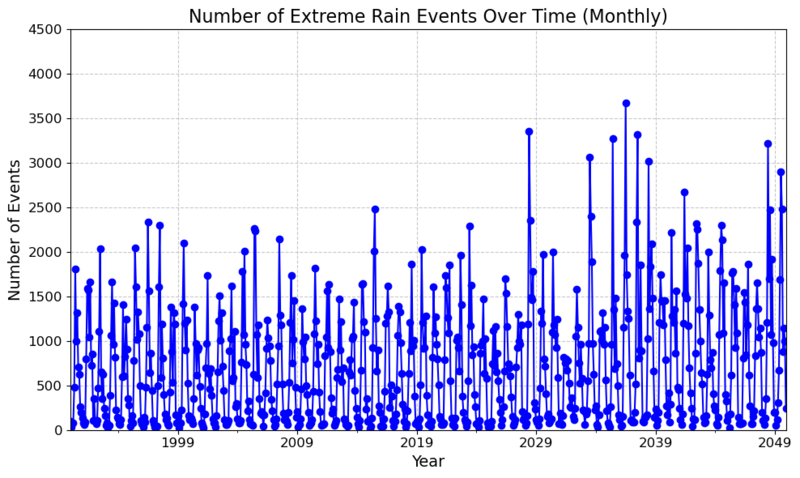
Number of all monthly captured events over Europe during the whole simulation period.